

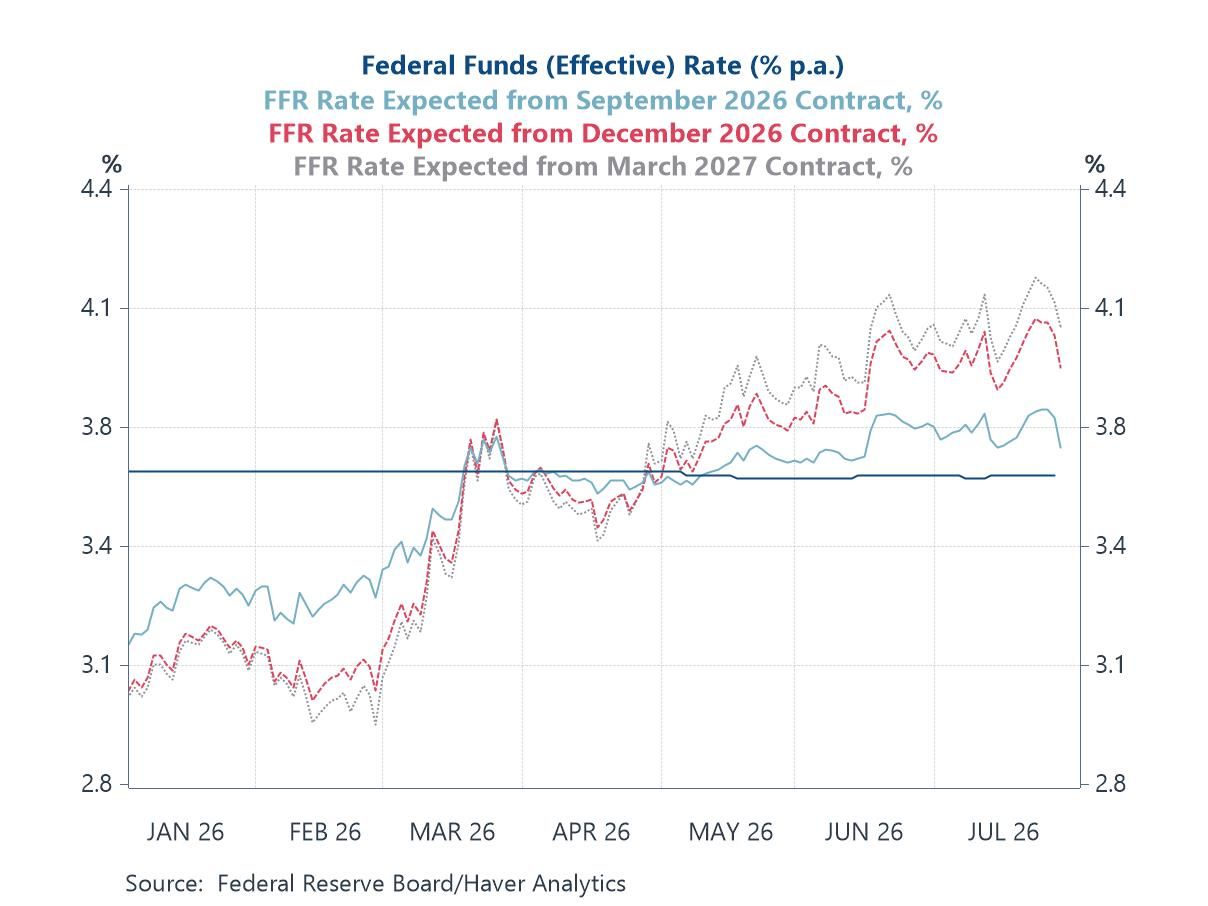
The Federal Reserve left its policy rate unchanged at the conclusion of last night’s meeting, a decision that had been widely expected — the futures market went in pricing only around a one-in-three chance of a hike — but one that split the committee unusually sharply, with three of its members dissenting in favour of an increase to counter inflation that has now run above target for more than five years (chart 1). Yet whatever the near-term path of official rates, the real cost of capital has already moved decisively. The real ten-year yield has climbed to around its highest in two decades, and it has done so in step with a run of firmer-than-expected economic data (chart 2). Behind that resilience lies an investment cycle that is quietly gathering pace. The July flash surveys show the upturn led, unusually, by manufacturing rather than services (chart 3), and the hard data are beginning to agree, with manufacturing orders across many major economies turning firmly higher (chart 4). Equity markets, for their part, have taken elevated real rates in their stride, the bond–equity relationships that fractured in 2022 having since been restored (chart 5) — the signature of a market that believes it has entered a higher-return, investment-led regime. The optimism is not unqualified. A fresh round of US tariffs and a sharp sell-off in chip stocks, led by South Korea, are reminders that the payoff from all this spending is far from assured. And the boom is colliding with a physical constraint: since the breakdown of the US–Iran understanding, Baltic tanker and gas freight rates have surged even as dry-bulk rates have stayed calm (chart 6), a pointed warning about the security of the world’s energy arteries.
 Global| Jul 30 2026
Charts of the Week: The Price of an Investment Boom
by:Andrew Cates
|in:Economy in Brief
More Commentaries
 USA| Jul 29 2026
U.S. Mortgage Applications Declined in the July 24 Week
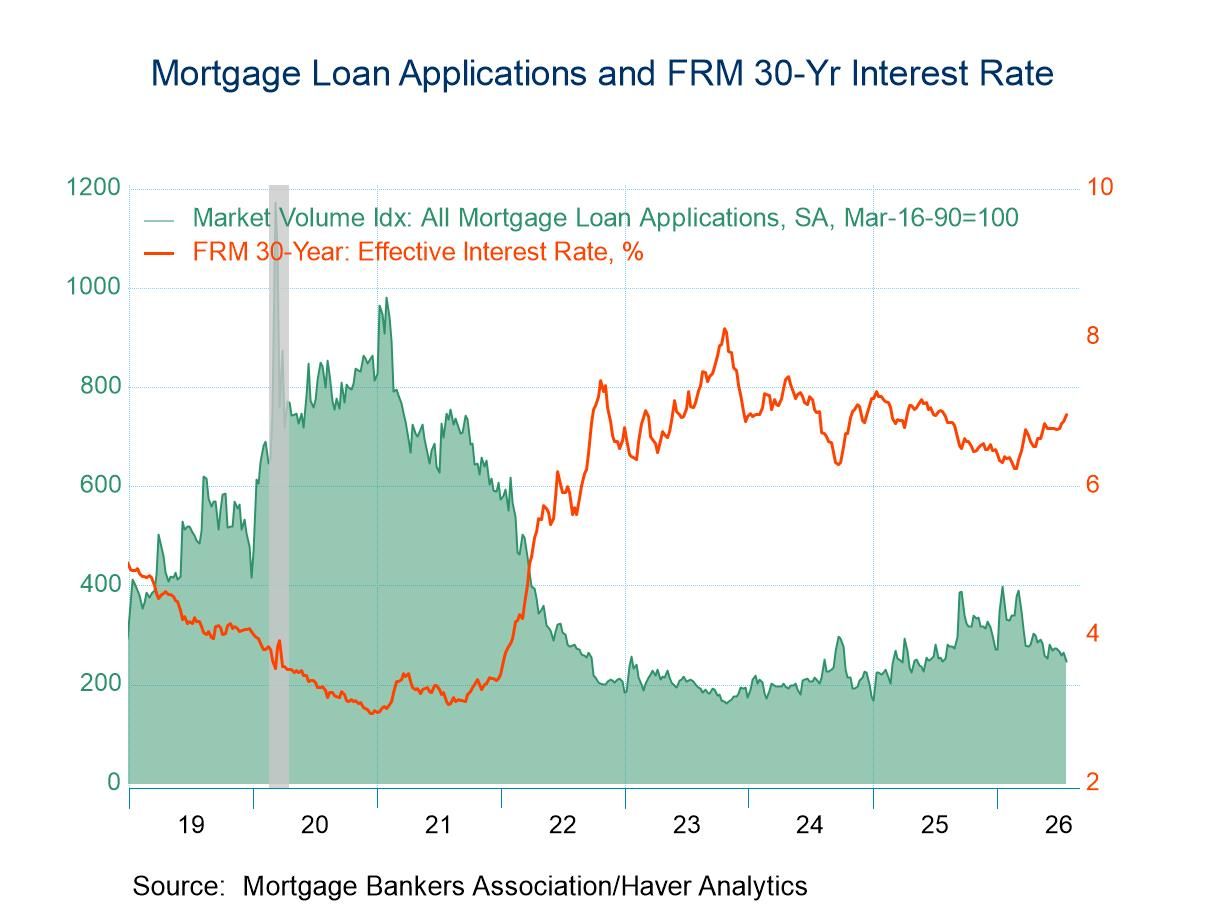
- Both applications for loans to purchase and applications for loan refinancing declined in the latest week.
- Interest rate on 30-year fixed-rate loans rose 9bps to 6.96%.
- Average loan size edged up.
 USA| Jul 28 2026
U.S. Consumer Confidence Continues Downtrend in July
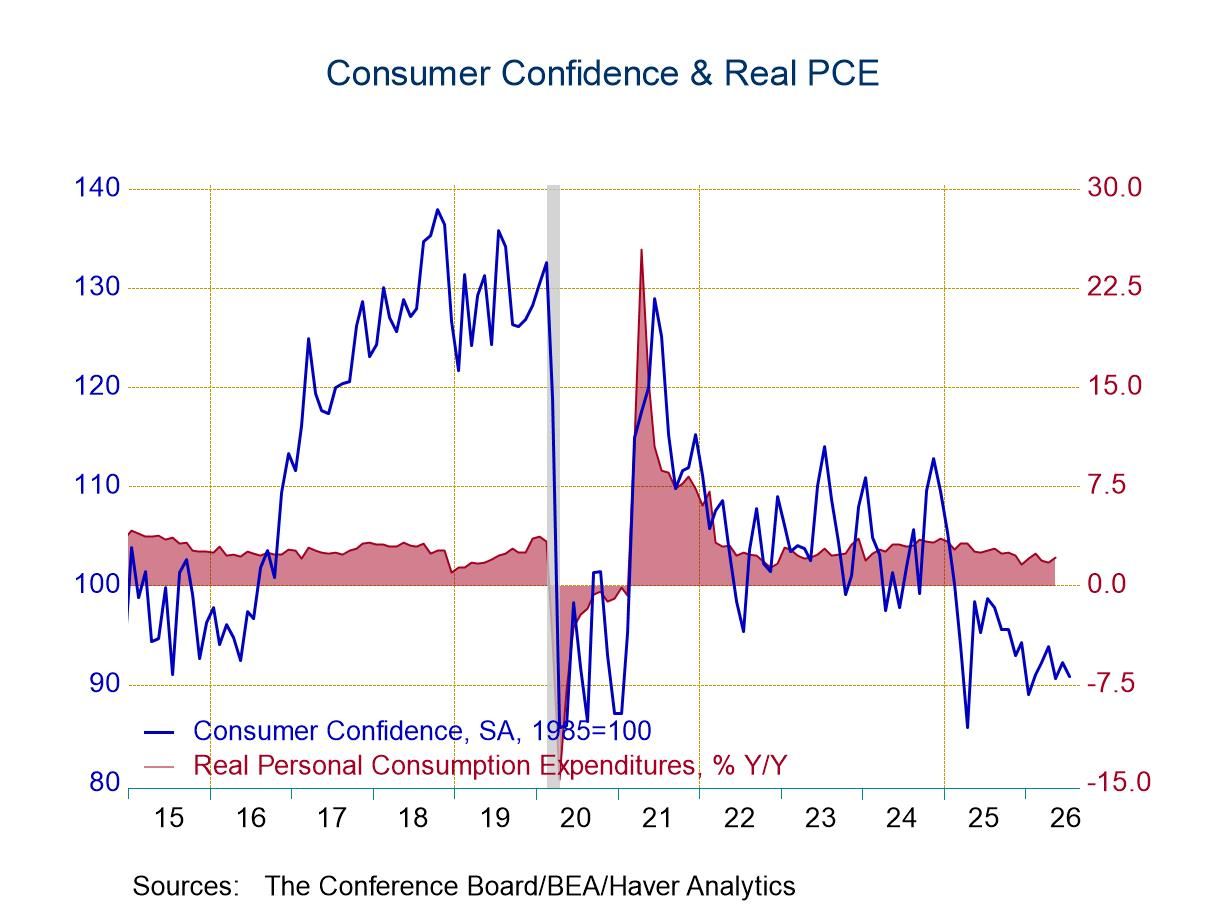
- The Conference Board’s measure of consumer confidence fell to 90.8 in July from 92.2 in June, continuing its downtrend since early last year.
- The Present Situation index fell to 114.9, its lowest reading since February 2021. The Expectations index was unchanged at 74.7.
- Inflation expectations one year ahead fell to 4.5% in July from 4.9%.
- The labor market differential fell to 3.1% in July, its lowest level since February 2021, from 3.8%, pointing to further softening of labor market conditions.
by:Sandy Batten
|in:Economy in Brief
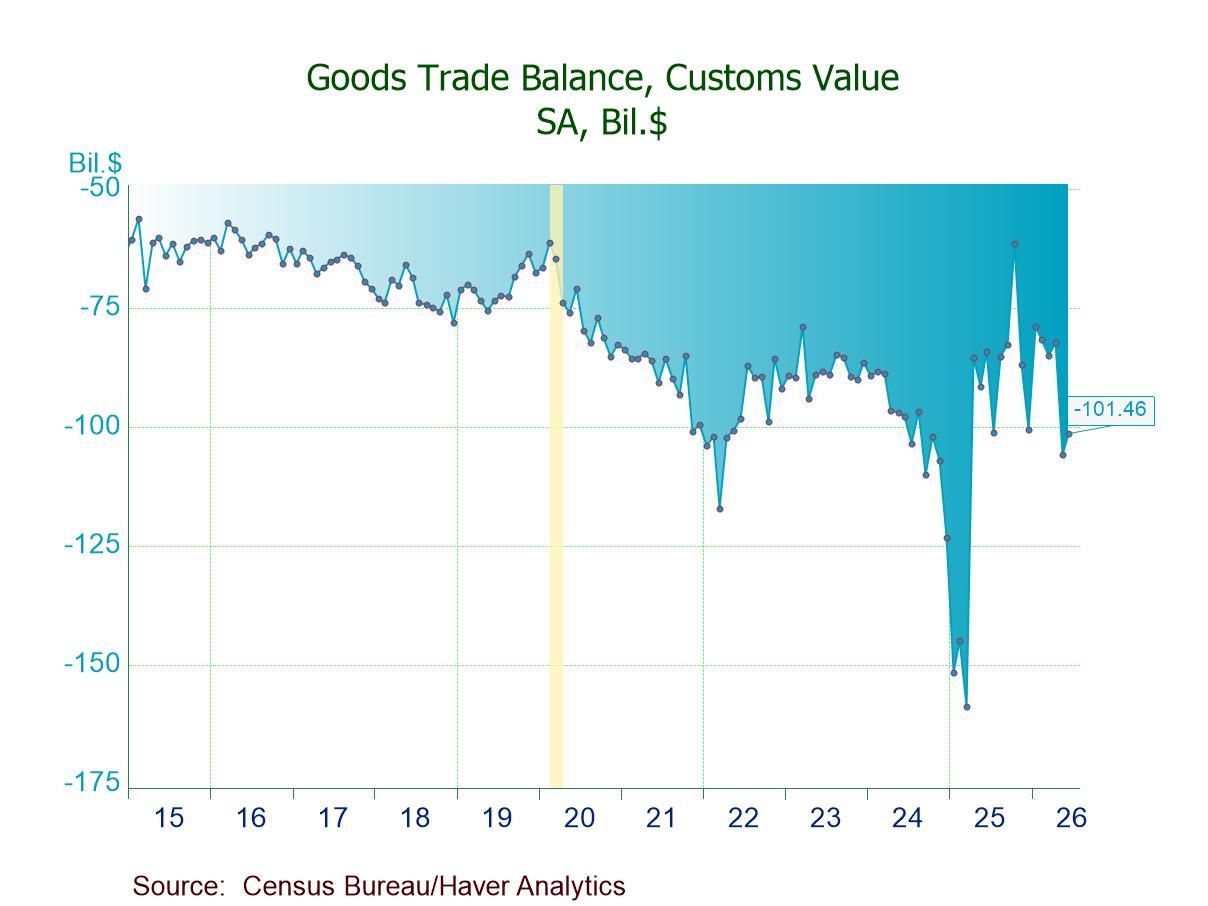
- Deficit: $101.46 bil. in June, down $4.43 bil. (-4.2%) from May’s $105.89 bil.
- Exports -1.8%, second straight m/m decline to a five-month low, driven by a 4.4% drop in exports of industrial supplies & materials.
- Imports -2.6%, first m/m decrease since Jan., w/ all end-use import categories down, led by drops of 6.3% in other goods and 3.8% in nonauto consumer goods.
 France| Jul 28 2026
French Household Confidence Improves
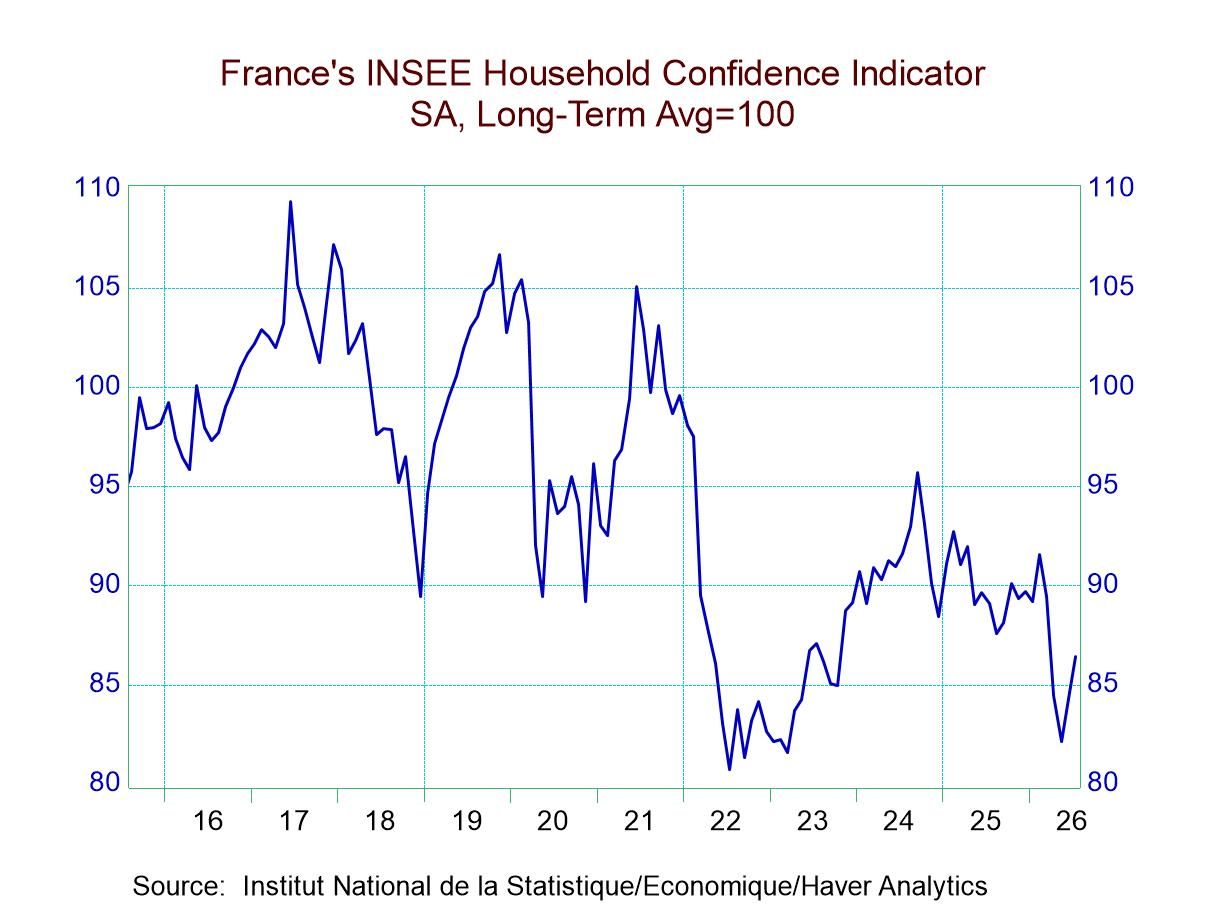
Household confidence in France improved in July, rising to 86.4 from 84.3 in June. Confidence was last higher in March, and the average for confidence over the last 12 months is 87.7. The July value, despite its climb, is still below that average; confidence is still weak in a historic context. According to data back to 2001, the current confidence metric in July has a 16.2 percentile ranking, an extremely weak reading. The mean of confidence readings back to 2001 is 95.1. The July reading is nearly nine points below that.
Weak but improved living standards readings: Living standards in July improved slightly compared to June. The assessment of the last 12 months is -79 compared to -81 previously. However, the 12-month average is a rating of -74; the July reading is still short of that. Looking to the next 12 months, living standards are expected to improve; the reading of -59 in July compares to -65 logged a month ago. It compares to a 12-month average of -61. The expectation for living standards over the next 12 months is higher than it has been on average for the last 12 months, although the reading itself is still quite weak. The standing in its 10th percentile for a current rating at -59 is below its full-period average of -38.
Fewer unemployment worries: Unemployment over the next 12 months is expected to be less of a concern, but the reading in July drops to 55 from 61 in June; however, the July reading is still above the 12-month average of 52. The ranking for unemployment concerns has a 72nd percentile standing, putting it in the top third of its historic range of readings.
Inflation fears drop, comparatively: Price developments show that over the past 12 months inflation has been a concern, with the July reading falling relative to June to 17 from 22, but this reading is much higher than its 12-month average of +2. However, looking to the next 12 months, the July reading is -33 compared to -15 in June, and it compares to -20 on average over the last 12 months. Inflation expectations are for conditions to show weaker inflation pressures. The ranking of the July reading is at its 44th percentile, below its historic median; the medians on rankings occur at a ranking of 50. Of course, all these readings will be dependent on how oil prices evolve.
Saving/spending: Both the favorability and the ability to save improved in July compared to June; both readings in July are above their respective 12-month averages. The rankings of these observations are around their high 90th percentiles; for the favorability to save, the reading is the highest in the whole period back to June 2001. The ability to save is often not a good reading but rather one that reflects consumer defensiveness, and we see that as we move to the next metric, the favorability to make a major purchase. In July, that reading improved to -36 from -38 in June, but it's weaker than its 12-month average of -31.8. In historic context, it's extremely weak and has an 8.3 percentile standing. So, the favorability to make a major purchase is in the lower 10th percentile of all monthly observations back to June 2001, indicating considerable consumer defensiveness.
Financial situation: The financial situations over the past 12 months and projected over the next 12 months show slightly improved readings compared to June. The past 12 months reading is weaker than its 12-month average, while the expectation for the next 12 months is the same as its 12-month average. The rankings of the two financial situations are just below their respective 40th percentiles, placing them about 10 percentile points below their historic medians.
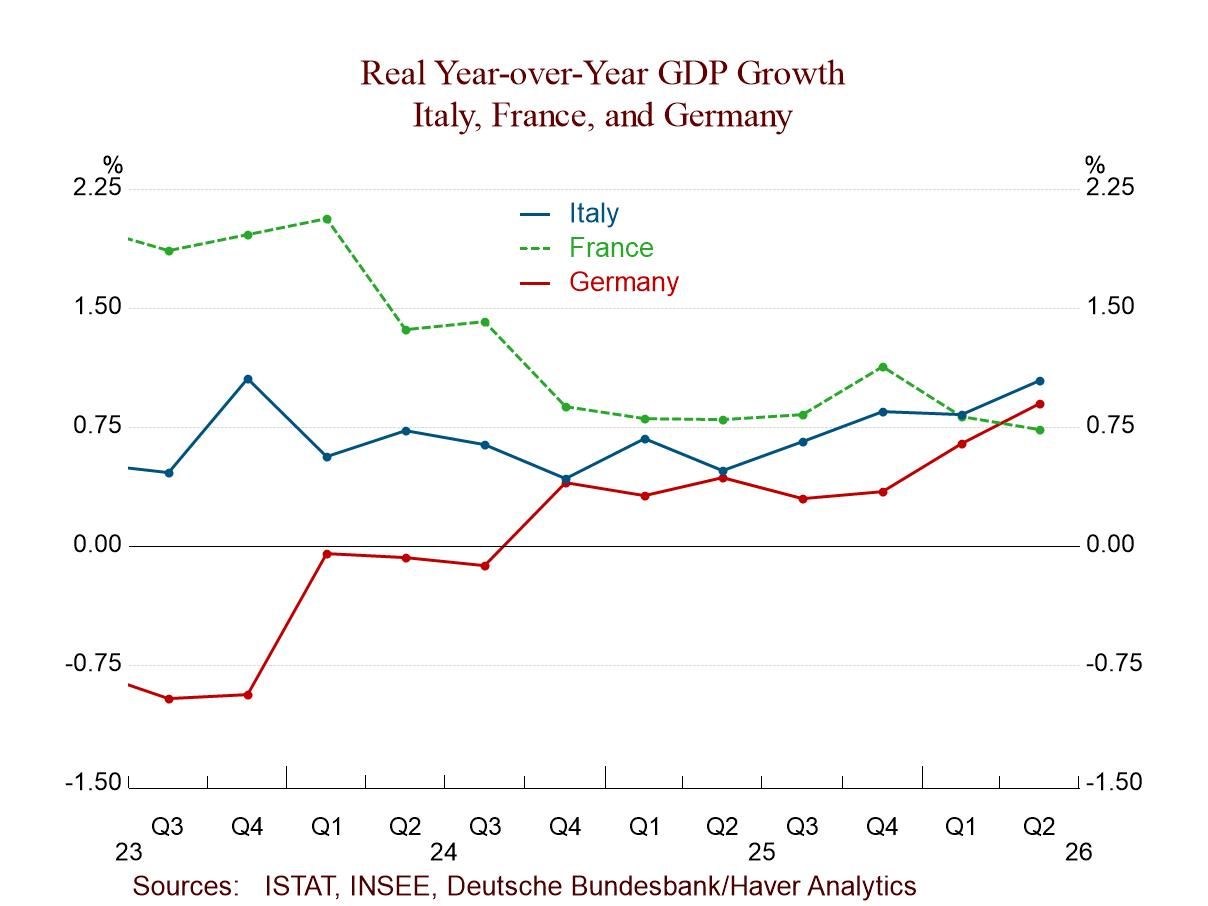
Summing up The consumer in France sees some improvement in July, and conditions remain mixed across these various components. But most of the rankings for the components are quite weak, with the exception being concerns about unemployment and the favorability to save, which was a defensive reading. The weighting scheme for this survey gives us a slightly more positive read on the month, but it's clear that the French consumers are still concerned about economic conditions and the future.
 USA| Jul 27 2026
U.S. Durable Goods Orders Rebound Less Than Expected in June
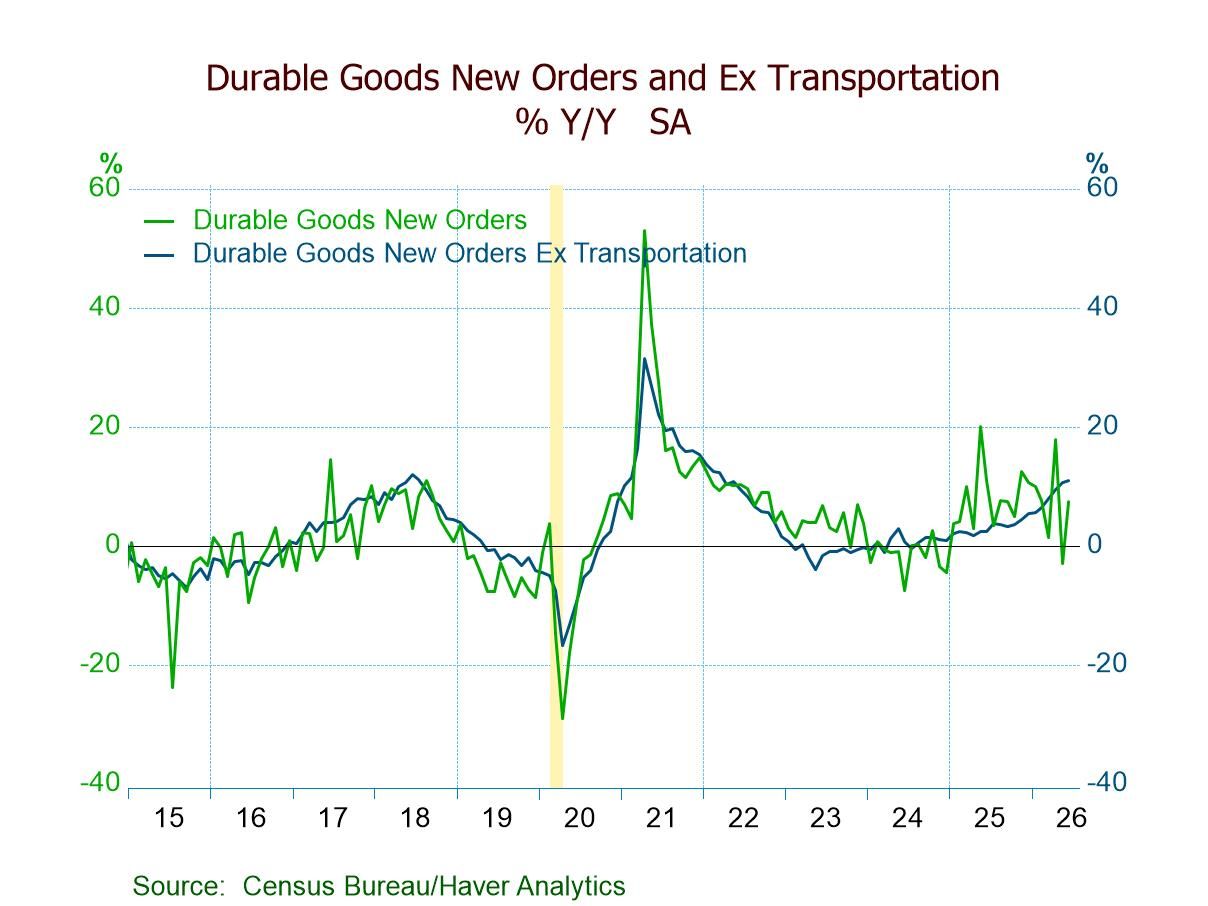
- June headline orders +0.3% m/m, third rise in four mths.; +7.4% y/y, positive since Jan. ’25 except for May (-3.0%).
- Nondefense aircraft & parts +3.7% m/m vs. May’s -51.1%; defense aircraft & parts -7.2% m/m, first drop since Jan.
- Transportation orders -0.2%, second consecutive m/m decline; orders ex transp. +0.6%, 14th straight m/m gain.
- Computers & electronic products +3.1%, ninth increase in 10 mths.
- Core capital goods shipments +1.9%, ninth gain in 10 mths., pointing to a moderate contribution to Q2’26 GDP from business equipt. spending.
- Durable goods shipments +0.7%; unfilled orders +0.6%; inventories +0.3%.
 Global| Jul 27 2026
An Update on Withering Money Growth Metrics
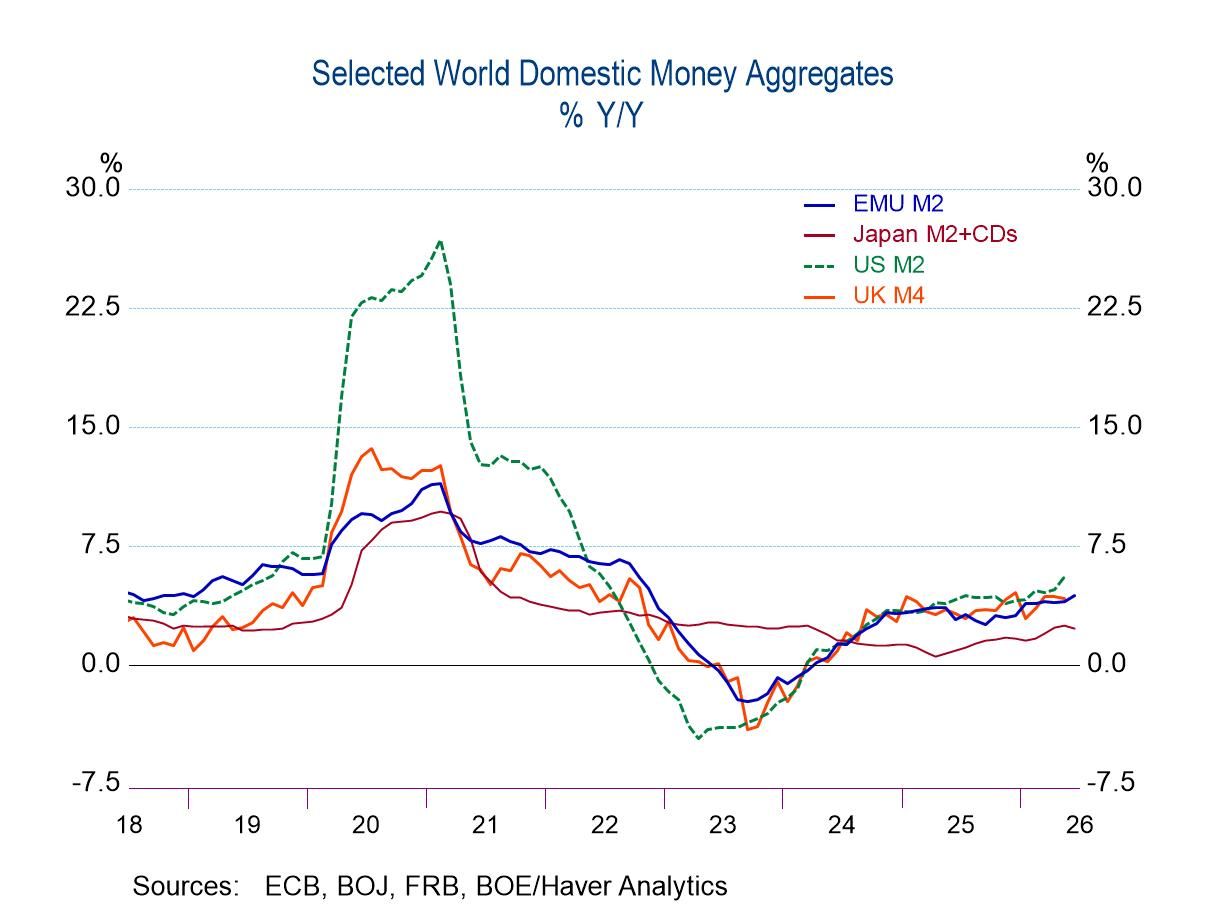
Money works with a lag but sometimes it’s reported with a lag too: U.S. and U.K. money supply data lag the results for the monetary union and for Japan by one month. Monetary trends currently based on the most up-to-date data, which are either May or June depending on the country we're looking at, show that three-month money supply growth, and credit growth in the case of the monetary union, have slowed compared to six months, except in the case of Japan. In Japan, for the six-month and three-month growth rates are identical at 1.9% overall; growth rates are lower over three months and six months compared to 12 months.
Real money balances: The growth rate of real money balances shows the step-down in growth in the monetary union from 1.6% over 12 months to a 1% annual rate over six months to a 0.6% annual rate over three months. Over the same sequence of dates, private credit in the monetary union has gone from 1.2% over 12 months to a pace of 1.4% over six months, and then down to 1.1% over three months. In the U.S., money growth over this period has decelerated from 2.5% over 12 months to 2% at an annual rate over six months to -0.4% over three months annualized. The U.K. shows a slightly different pattern for real money balances that grow 2.4% over 12 months, accelerate to 3.4% annually over six months, but then back down to a 1.6% annual rate over three months, showing a net deceleration from 12 months to three months but with an intervening bulge. In Japan, the money growth slowdown is monotonic, from 0.5% over 12 months to a 0.3% pace over six months to a -1.2% pace over three months.
Pattern reversal: Nominal money growth, which had shown some acceleration early in the year, is now beginning to show deceleration, and this is before central banks have generally begun to raise rates, although there have been ongoing rate increases of a slight amount in Japan and also the start of a tightening cycle in the European Monetary Union. In the U.S., there's a new head of the central bank and policies there are expected to shift, but the jury is out on what to expect, as is often the case with a new chairman. There are a variety of views on what he plans to do; he will most likely make his reputation by what he in fact does rather than by what he says about what he intends to do. On balance, growths in the U.S., the monetary union, and Japan are all showing deceleration with a slight exception from the U.K. But generally speaking, money supply no longer is showing a moderate disturbing acceleration pattern; in real terms, money growth has lost a great deal of steam, particularly in the U.S. and Japan, where three-month growth rates of real money balances are declining and show negative rates of growth.
Summing up These are new trends, and they are not much talked about in markets because markets don't speak the language of money supply growth much anymore. However, it's a good idea to continue to look at money supply and what it does. Just because central banks aren't targeting money doesn't mean that it isn't relevant anymore; it just means that central banks have put their attention someplace else. At present, central bankers seem to be arguing about where their attention should be. It could be a good time for us to keep close tabs on what money supply is doing.
 Asia| Jul 27 2026
Economic Letter from Asia: Triple Threat
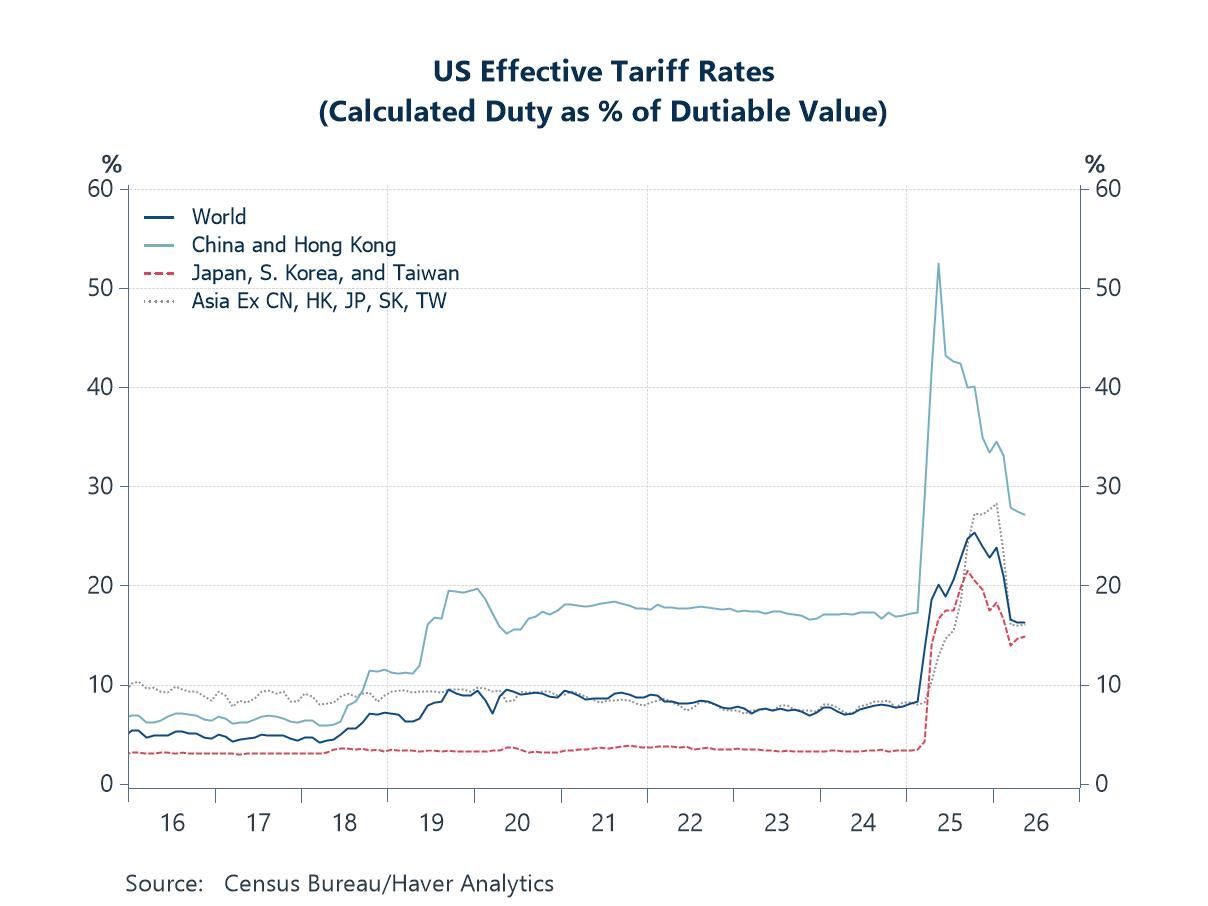
In this week's Letter, we trace three threats converging on Asia's inflation outlook. The first is renewed US tariffs, with the latest salvo of duties imposed over alleged forced labour issues. That move is widely seen as a replacement for the now-expired Section 122 tariffs, with only mild incremental effects from the new Section 301 duties. Set against that, the US effective tariff rate has pulled back from its 2025 highs in recent months (chart 1). The second is the Strait of Hormuz, where the re-escalation of US-Iran tensions has once again reduced shipping volumes to a trickle. Crude oil prices have been driven up as a result (chart 2). It could have been worse, were it not for China's sharply reduced crude imports over the period (chart 3). Arguably, though, at least part of that reduced intake simply reflected the absence of supply from the Strait. The third is the ongoing El Niño event, which several authorities have warned will likely be the largest on record (chart 4). It risks disrupting food crop yields, among other effects, channelling a price shock through food supply. Together these pressures threaten to upend the pullback in commodity inflation seen in recent months (chart 5), once again complicating policymaking. As an aside, we also explore economy-specific political developments that are brewing or could become an issue further down the road. One is the recent resignation of Indonesia's central bank governor, which came amid protracted rupiah weakness (chart 6) and concerns about fiscal health.
Tariff trouble Recent US forced labour tariffs have revived concerns, pushing the tariff theme back to the fore. The US imposed additional Section 301 duties of 10% or 12.5% on imports from 60 investigated economies, effective 24 July 2026. These followed USTR investigations into those economies' failure to impose and enforce prohibitions on goods produced with forced labour. They took effect the same day the temporary 10% Section 122 global surcharge expired by statute, and are seen as its replacement. Yet overall US effective tariff rates, calculated as duty as a percentage of the respective dutiable value, have pulled back significantly from their 2025 highs (chart 1). That retreat began with the numerous bilateral trade deals the US eventually struck with many of its trading partners. It went further in February, when the Supreme Court struck down President Trump's tariffs imposed under the International Emergency Economic Powers Act (IEEPA). That ruling dented the overall impact of US tariffs on its trading partners, with possible tariff refunds still in the works. Cutting the other way, the Section 122 surcharge had partially raised overall rates while it ran. Even so, some estimates suggest the new duties will only marginally increase US effective tariff rates on its trading partners.
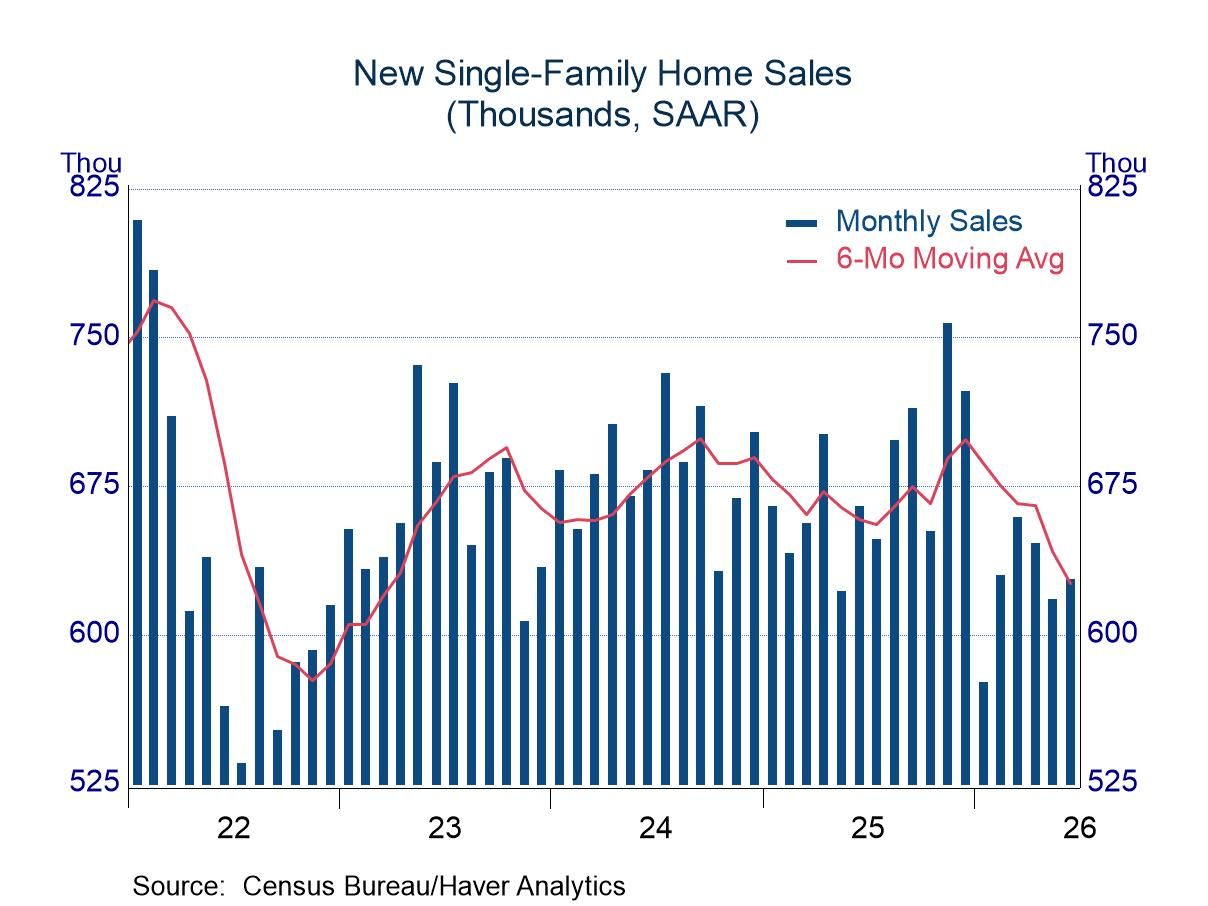
- Respectable advance in the latest month…
- …and net upward revisions in the prior three months
- …but still trailing results in the prior three months
- of2733Go to 1 page