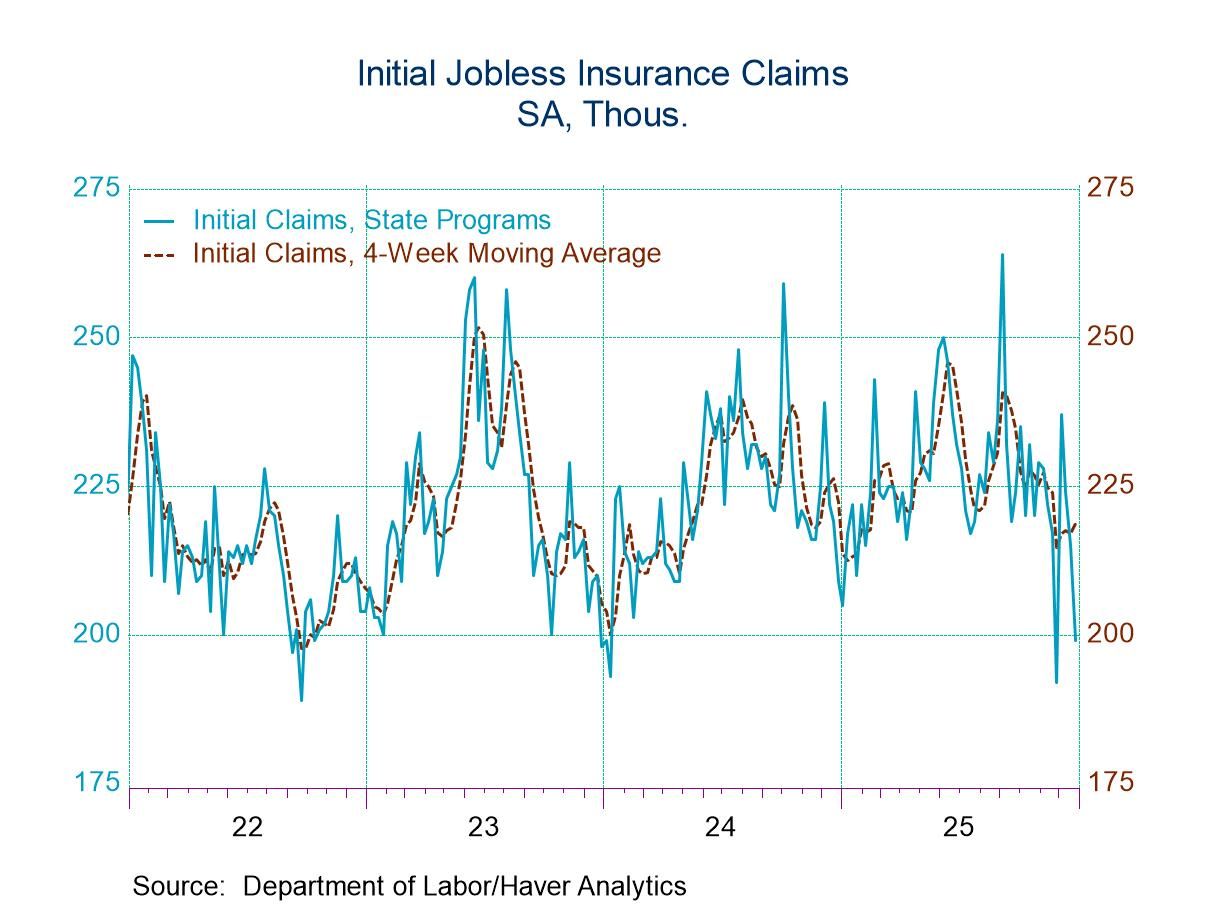
- Initial claims declined from the prior week.
- Continuing claims declined from the prior week.
- The insured unemployment rate was unchanged.
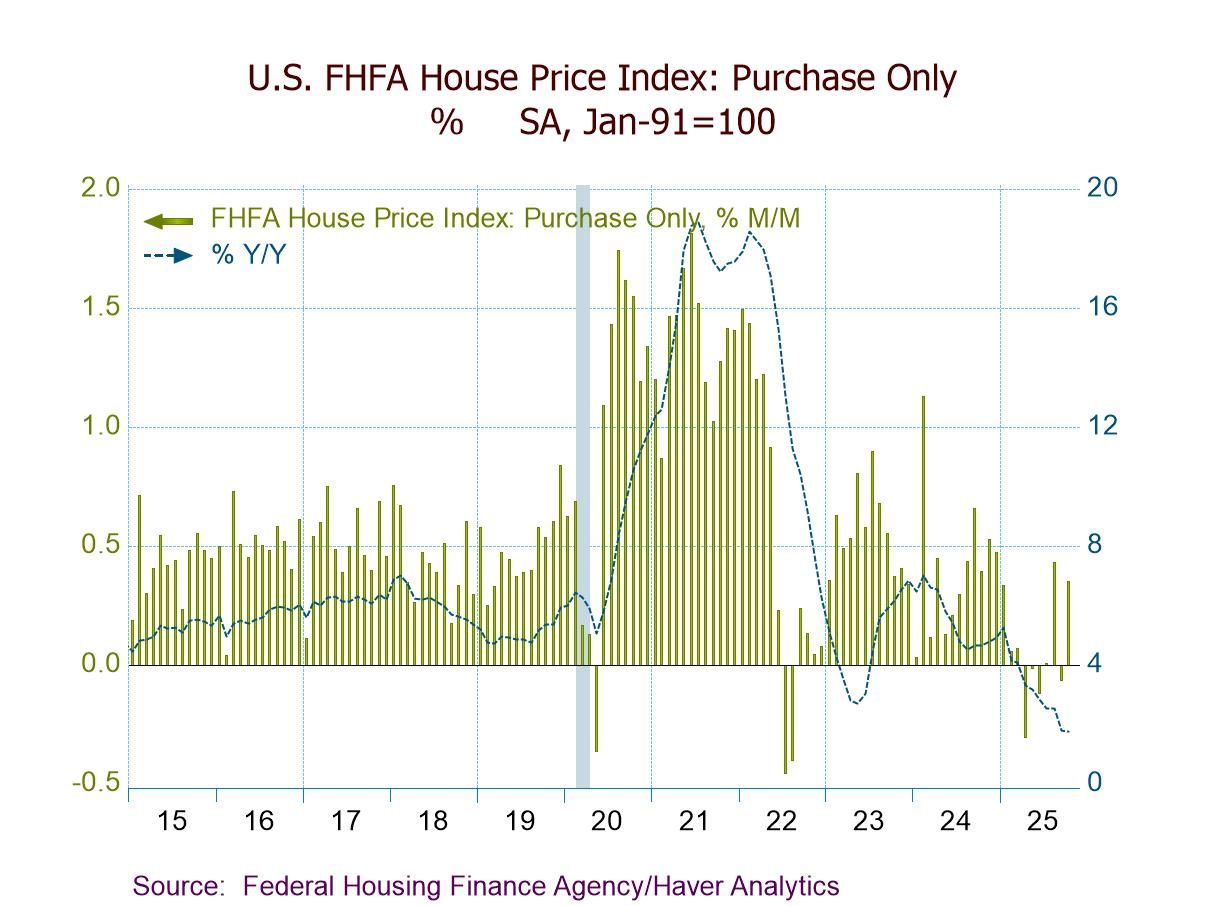
- FHFA HPI +0.4% m/m (+1.7% y/y) in Oct.; second m/m gain in three months.
- House prices up m/m in seven of nine census divisions but down in East South Central (-0.4%) and South Atlantic (-0.2%).
- House prices up y/y in seven of nine regions, led by Middle Atlantic (+5.3%), but down in West South Central (-0.7%) and South Atlantic (-0.5%).
 Spain| Dec 30 2025
Spanish Inflation Flares at Year-End
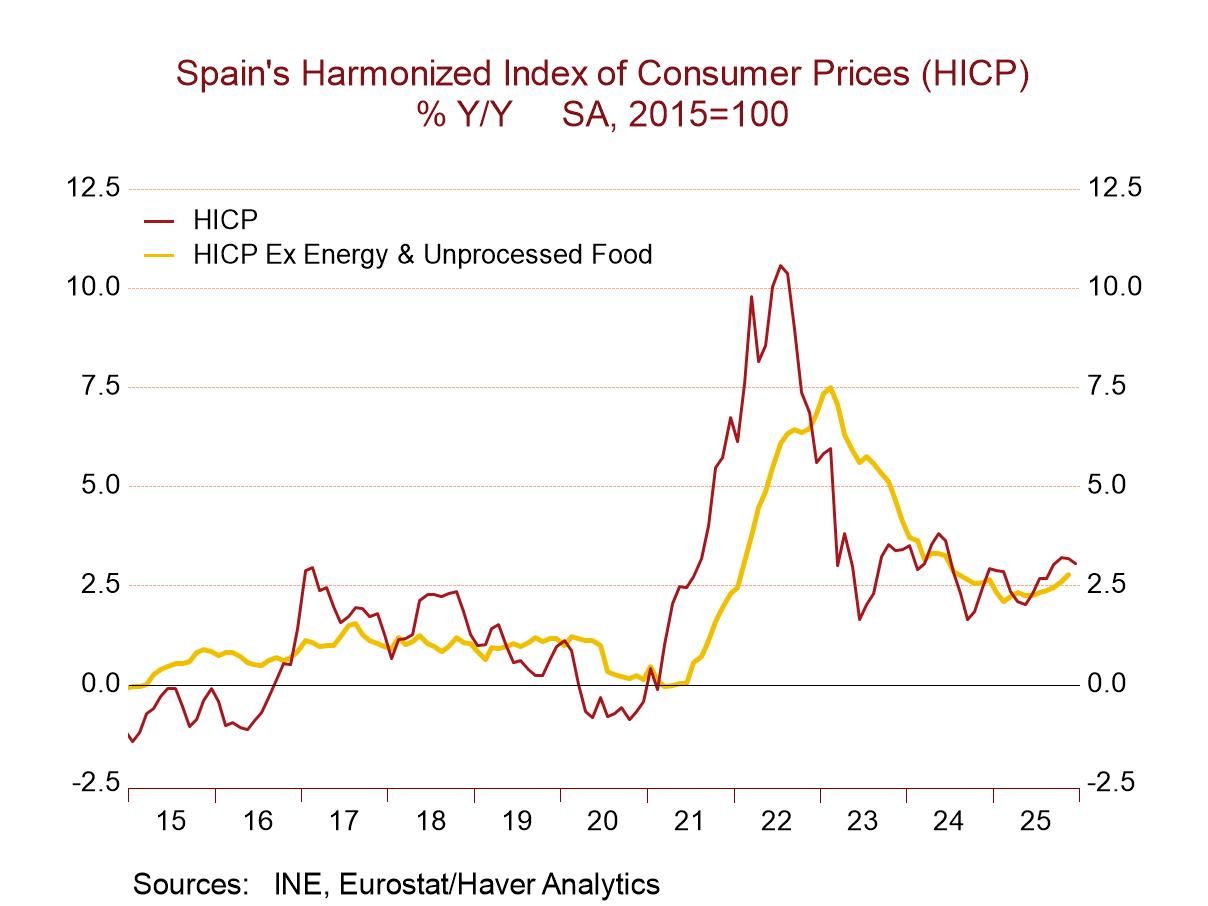
When inflation numbers come hot off the griddle, some part of them might stick to the pan. That's the case this month with Spain’s release of inflation in December. It provides us with the headline for the HICP measure, a headline to the domestic measure, and the domestic measure excluding energy. But it does not release the sector detail for the rest of the report.
However, based upon what's been released, it’s clear that inflation in Spain has picked up. The part of the core that we have in-hand, which is just the portion excluding energy, still appears to be fairly well behaved; however, its gain is still slightly excessive.
HICP trend Spain’s HICP measure in December rose 0.4% after rising by 0.5% in both October and November; those are hot numbers. That translates into a 5.7% annual rate over three months which is hotter than its pace of 4.5% over six months which in turn is hotter than the 12-month increase of 3%. The HCP headline for Spain has clearly been accelerating, the year-over-year rise is too-hot, and the shorter-term metrics are hotter still. This is not good news, and this is not a welcome progression.
Domestic inflation Looking at Spain’s domestic CPI conditions, we find that they are still on the hot side with December showing a headline gain of 0.3% but gains in October and November of 0.5% each, producing a three-month annual rate of 5.4%, which is hotter than its 4.2% over six months, which, in turn, is hotter than the year-over-year gain at 2.9%. And these patterns/results are very similar to the pattern and the readings for the HICP. The domestic inflation picture is too hot over 12 months and accelerating over the shorter periods.
Domestic inflation ex-energy: The CPI excluding energy is not as bloated as the HICP or the domestic headline, but it is still a reading on rough terrain. Over 12 months, inflation excluding energy rises at a 2.6% annual rate; that's above the 2% pace sought by the ECB for the community as a whole. Over six months, the reading ramps up to a 3.1% annual rate, again moving the wrong direction and a reading at 3.1% is simply too hot. Over three months, there's a slight deceleration compared to six months but still a rate that is too hot, at 2.9%, and stronger than the 12-month pace. Core inflation is better behaved than headline inflation and both the domestic and the HICP frameworks, but inflation is unruly overall and, for the most part, showing either acceleration or at least a 3-month pace stronger than its 12-month pace. None of this is what the ECB is looking for or trying to achieve.
Beyond the missing details The details of the Spanish report are missing for December because the data are too preliminary for the authorities to post. However, if we look at the sequential pace of inflation over 12 months, six months, and three months on a lagged basis, it is looking at data that are up-to-date through November rather than through December what's the numbers that are generally excessive and they show too much acceleration moving from 12-months to 6-months to 3-months. Over 12 months compared to a year ago, five of nine categories show inflation accelerating. Over 6 months compared to 12 months, four categories are accelerating. Over 3 months compared to 6 months, six of the nine categories are accelerating. These acceleration tendencies are worrisome.
In addition, over 12 months, six of nine categories have a pace above 2%. Over 6 months, six of nine categories have annualized gains above 2%, and over 3 months, the lagged data show six of nine categories with gains above 2%. Only apparel shows inflation tempered on all horizons (at or below 2%). Food, housing, transport, education and other all show above 2% inflation on all horizons.
 USA| Dec 29 2025
Texas General Business Activity Still Negative in December, But Expectations Remain Positive
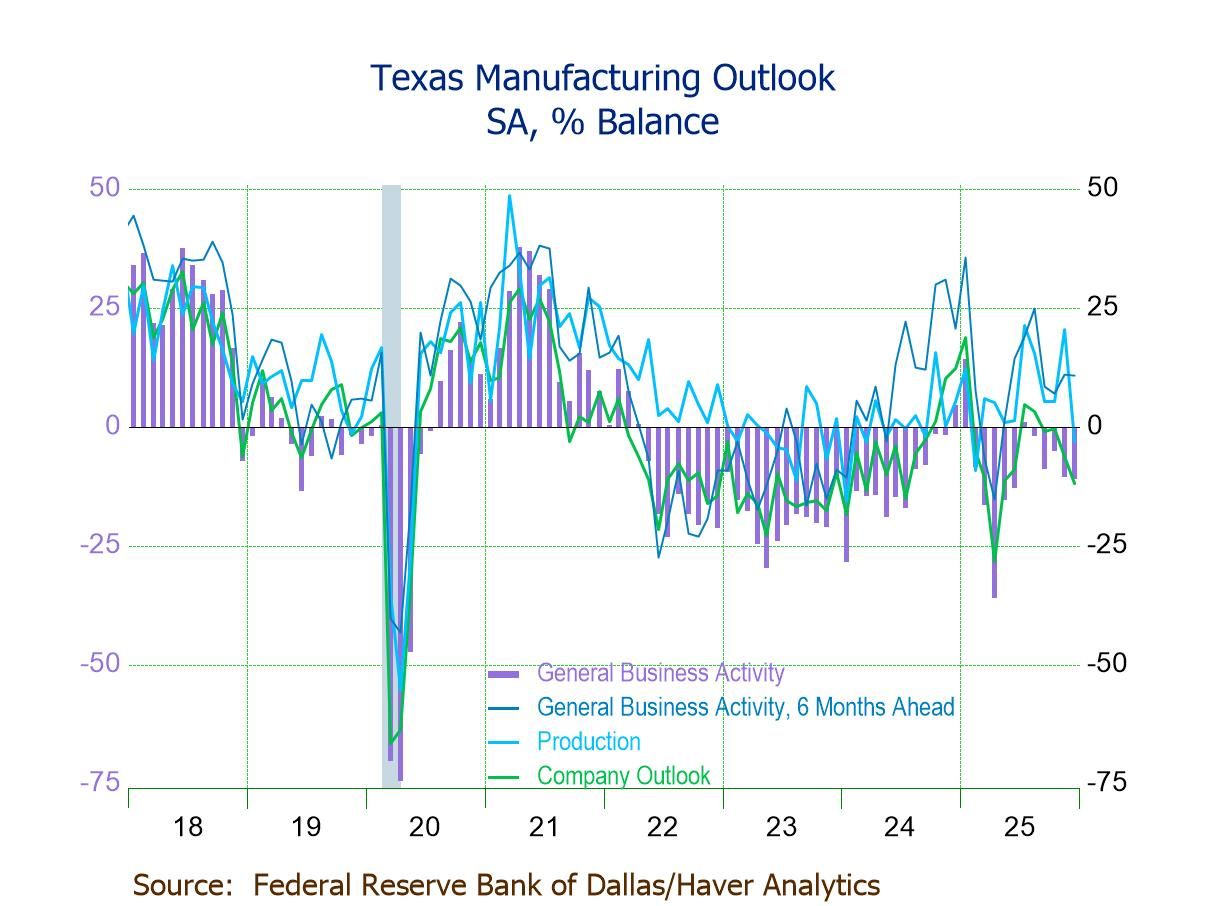
- General Business Activity down in Dec. to -10.9, lowest level since June.
- Company Outlook (-11.9) negative for the fourth straight mth. and at an eight-month low; Production (-3.2) negative for the first time since Feb.
- New Orders Growth (-16.0) and New Orders (-6.4) at a six-month low.
- Employment (-1.1) negative for the first time since Sept.
- Prices Received down 2.6 pts. to 8.2; Prices Paid up 0.7 pts. to a three-month-high 36.0.
- Future General Business Activity down to 10.8, still positive for the eighth consecutive mth.
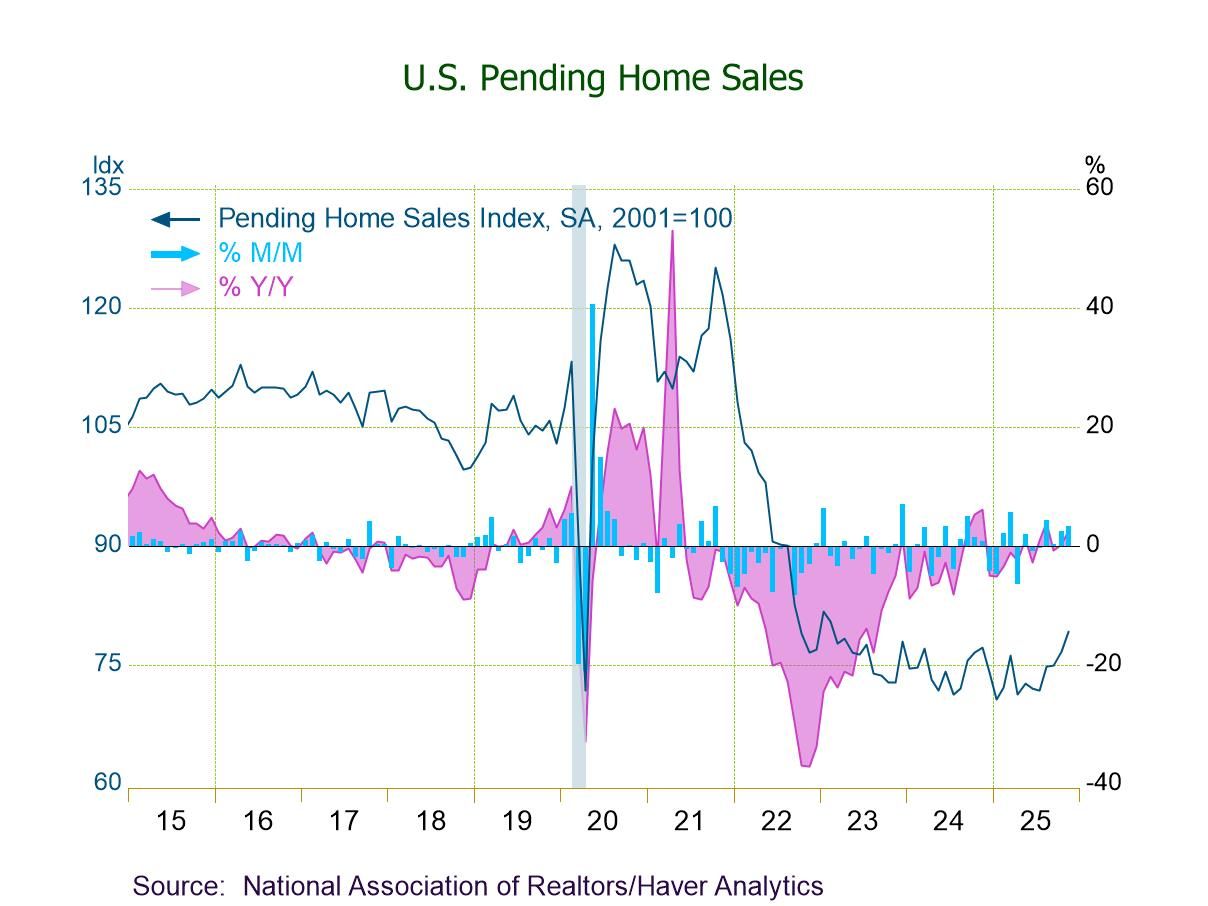
- PHSI +3.3% (+2.6% y/y) in Nov., driven by lower mortgage rates.
- Home sales m/m up in all four major regions, w/ the highest rate in the West (+9.2%).
- Home sales y/y up across all regions, w/ the highest rate in the South (+3.3%).
 Sweden| Dec 29 2025
Sweden’s Trade; Exports Surge as Imports Recede
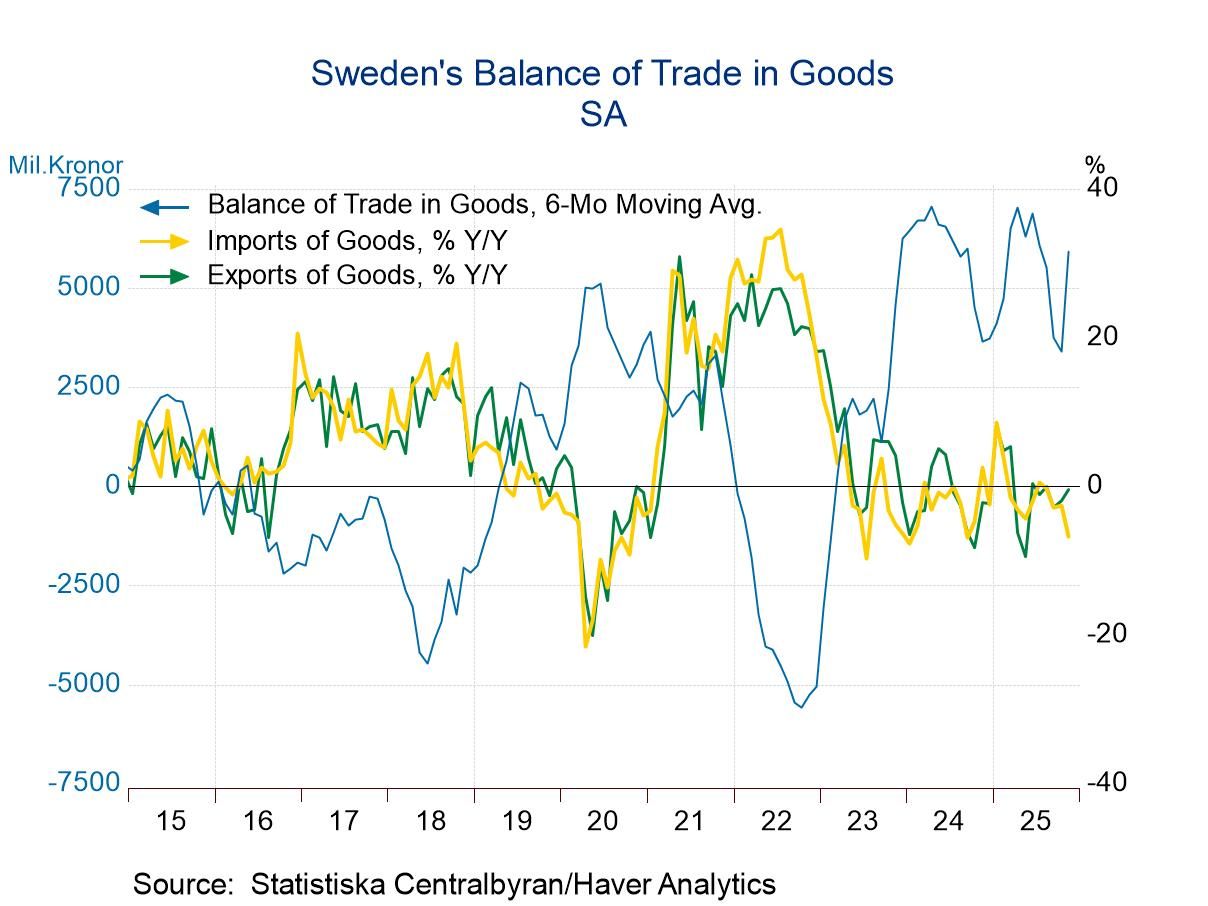
Swedish exports advanced month-to-month for the second month in a row while imports continued on a losing streak declining by 0.9% in November.
Exports have gradually been firming with exports falling by 6.1% over 12 months, rising at an annual rate of 4.8% over six months, and then rising at a 3.9% annual rate over three months. Exports are not on a steady acceleration path, but they have transitioned from a year-over-year growth rate that's negative to moderate positive short-term rates of growth.
Swedish imports, on the other hand, are weakening relatively sharply. Imports were down 4.4% over 12 months, down at a 1.2% annual rate over six months, and falling at a 17% annual rate over three months.
The global trade picture remains somewhat mixed. The Baltic Dry goods index, which is an indicator of global trade volume, has backed off of its highs but continues to post relatively steady volume indications. However, the S&P global manufacturing survey has been showing weakness; when manufacturing is weak, typically international trade is weak as well. Swedish trade may be picking up some of that weakness as well.
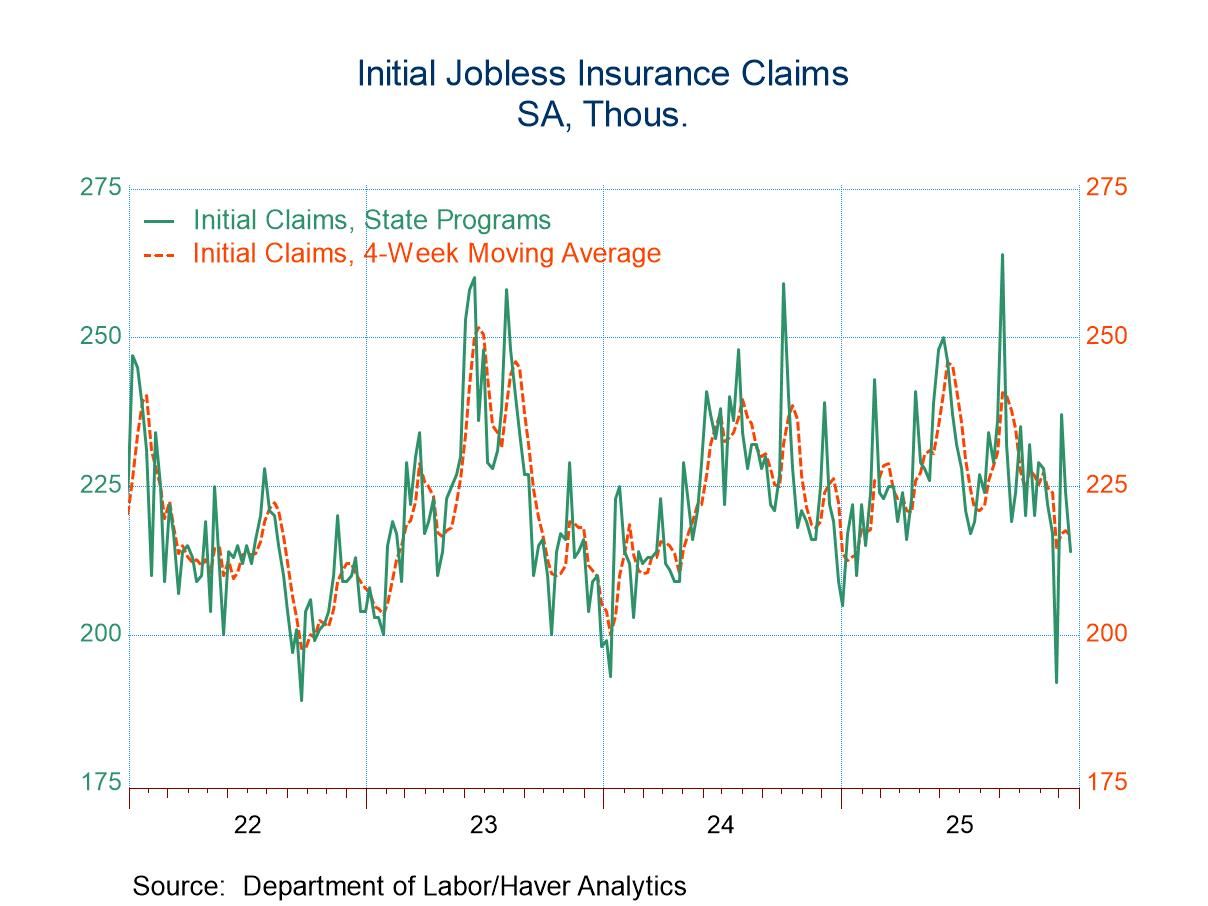
- Initial claims declined from the prior week.
- Continuing claims rose from the prior week.
- The insured unemployment rate edged up.
 USA| Dec 24 2025
U.S. Mortgage Applications Dropped in the Week of December 19
- Both purchase applications and refinancing loan applications fell in the latest week.
- Effective interest rate on 30-year fixed loans fell to 6.48%.
- Average loan size edged down.
- of103Go to 1 page