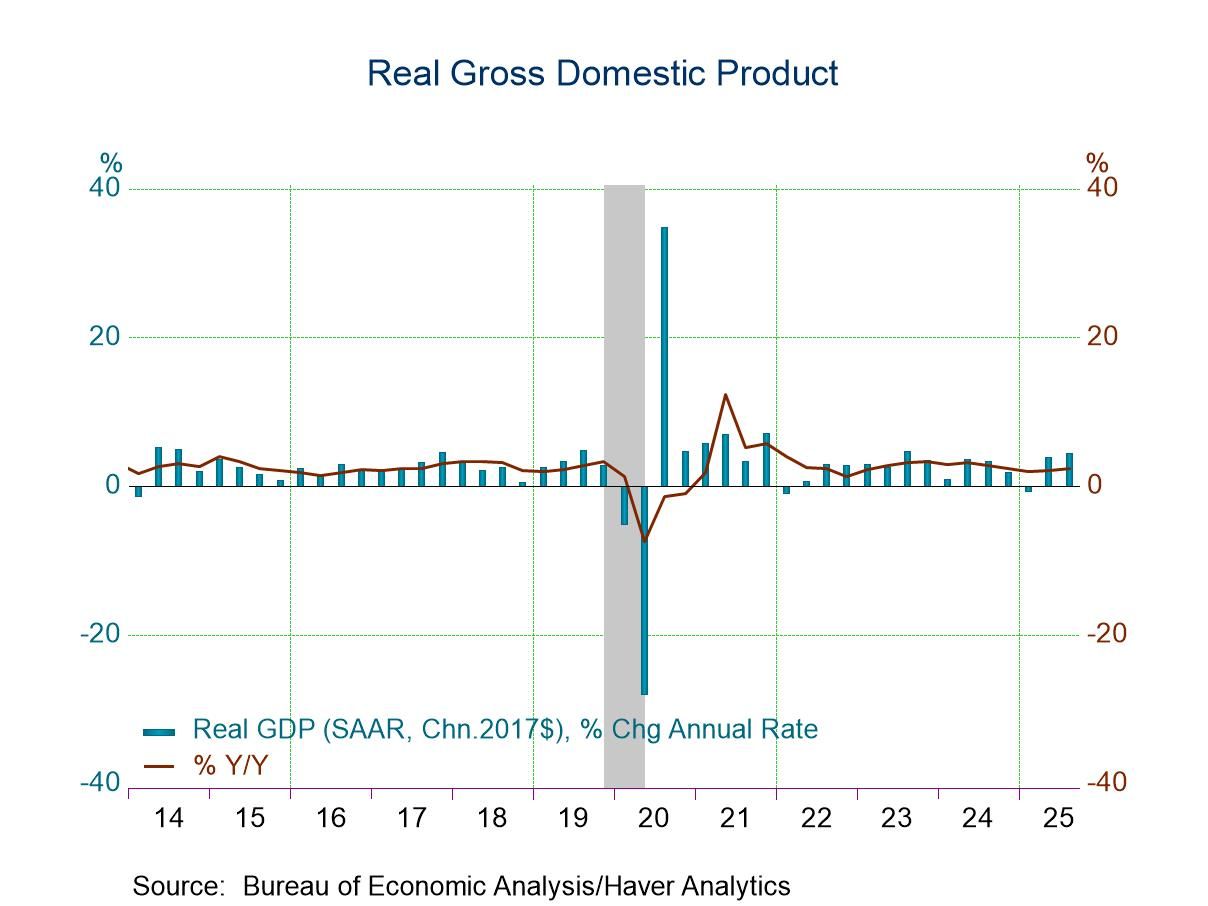
- Consumer spending strengthens; growth in business investment decelerates.
- Corporate profit growth led by earnings abroad.
- Rise in chain price index accelerates.
 USA| Dec 23 2025
U.S. GDP Growth Is Strong in Q3; Profits Jump
by:Tom Moeller
|in:Economy in Brief
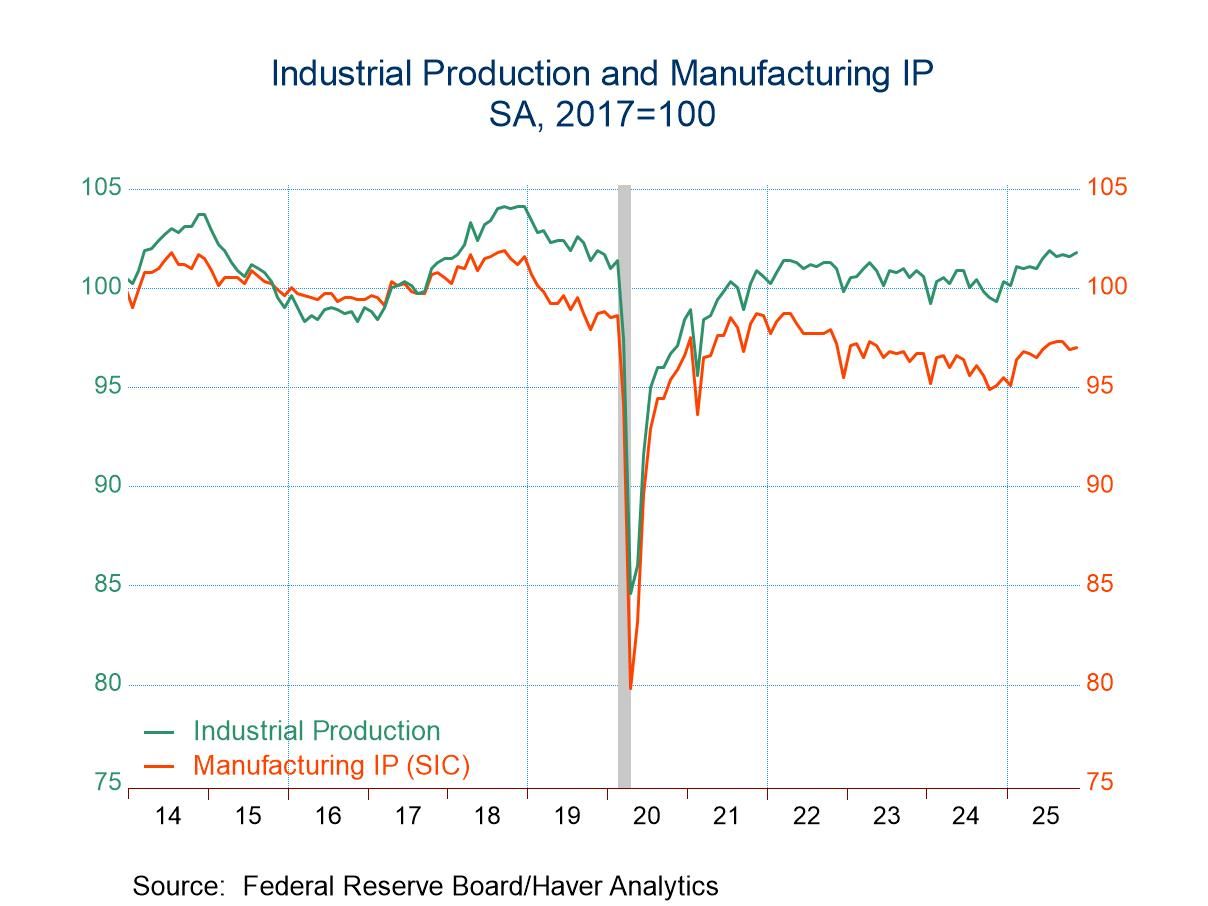
- Today’s release contained figures for both October and November that had been delayed by the federal government shutdown.
- IP fell in October but recovered in November.
- Manufacturing output was tepid, falling in October and unchanged in November.
- A surge in utilities output in October prevented a larger decline in total production.
- A jump in mining output in November accounted for all of the increase in total production.
by:Sandy Batten
|in:Economy in Brief
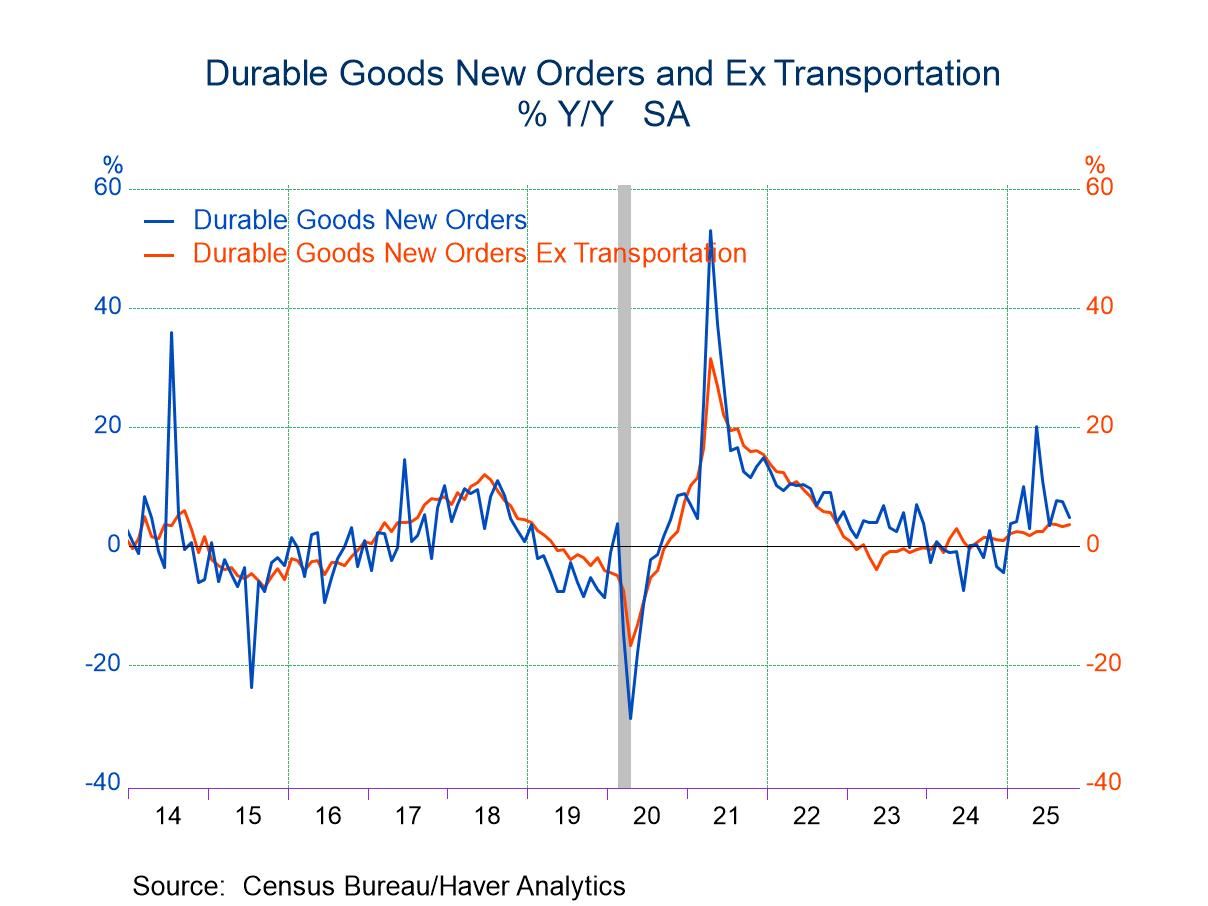
- New orders for durable goods slumped 2.2% m/m in October following increases in both August and September
- A 24% monthly drop in aircraft orders drove the overall decline
- Orders excluding aircraft rose 0.2% m/m in October
- Core capital goods shipments and orders continued to rise in October with small upward revisions to September
by:Sandy Batten
|in:Economy in Brief
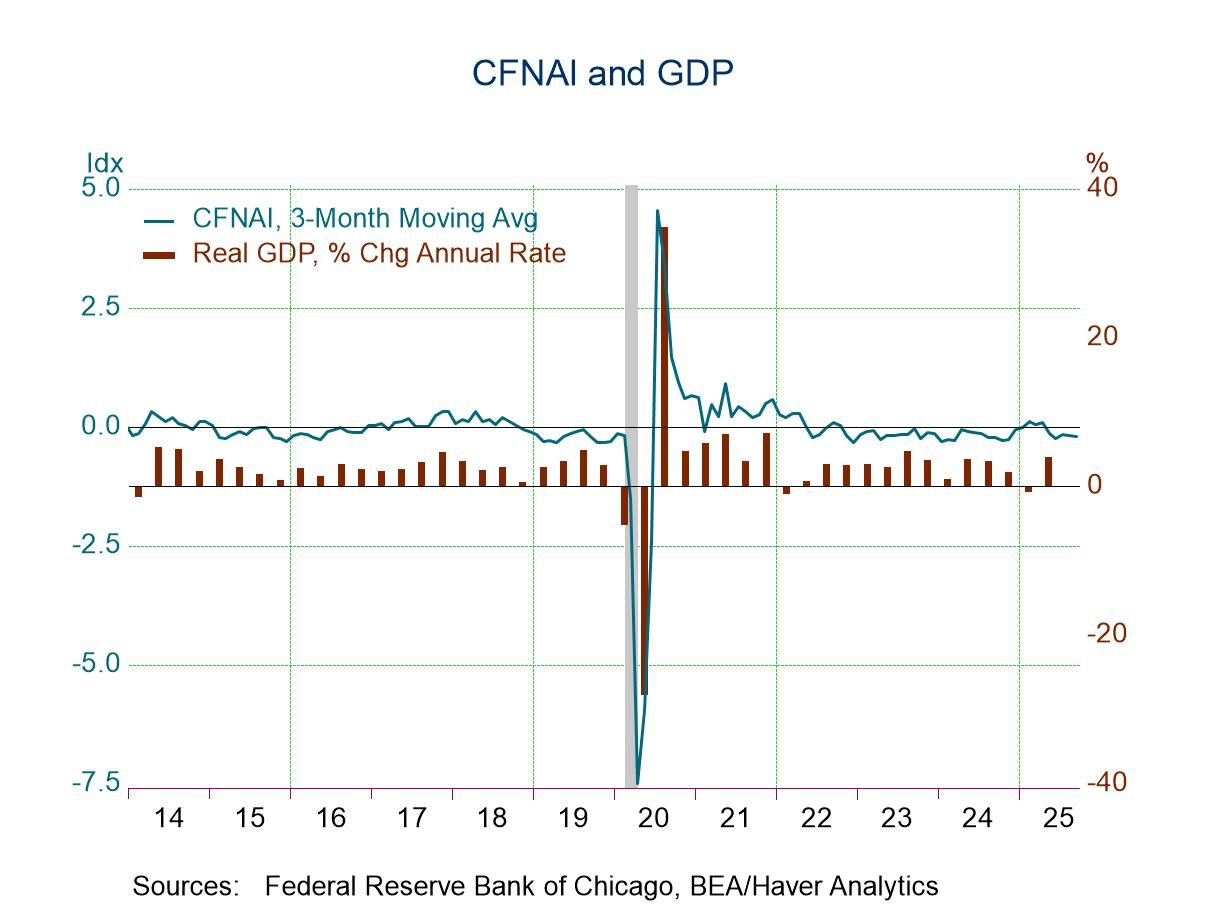
- The CFNAI is negative for sixth straight month.
- Three of four index components remain negative
- Improvement in labor market reading leads m/m gain.
The Federal Reserve Bank of Chicago indicated that the December 22, 2025, release of the CFNAI was originally scheduled to cover data through November 2025. However, because of the delay in data releases from government statistical agencies due to the federal government shutdown, this CFNAI release will instead only cover data through September 2025.
by:Tom Moeller
|in:Economy in Brief
 USA| Dec 22 2025
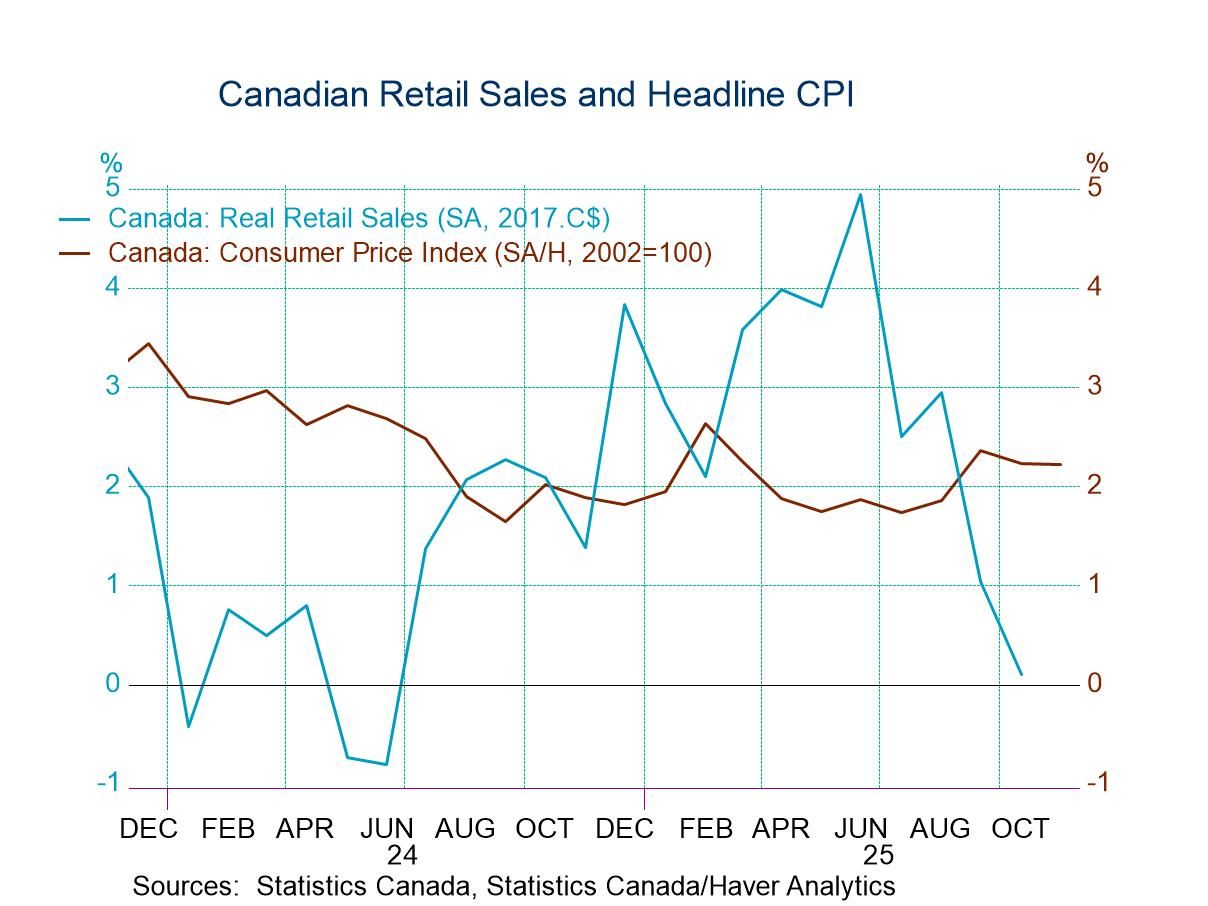
Canadian Retail Sales Drop and Growth Falters
Canadian retail sales and other growth metrics appear to be weakening as the year draws to a close. Inflation has firmed up as well. Retail sales in October saw a month-to-month drop of 0.2% as supermarket sales fell 0.7%, month-to-month, clothing store sales fell 1.2%, and retail excluding motor vehicle sales fell by 0.6%. Overall real retail sales fell by 0.6% in October from September. This is the second consecutive month in which total nominal retail sales and retail sales in real terms both dropped month-to-month. Total retail sales and real retail sales both are declining over three months. Total retail sales at a -0.6% annual rate real retail sales-3.2% annual rate. Real retail sales are decelerating from a 2% growth rate over 12 months to a -1.7% annual rate over six months to a - 0.6% annual rate over three months. Real retail sales show more severe deceleration, growing by merely 0.1% over 12-months shrinking at a 3.8% annual rate over six-months and declining at a 3.2% annual rate over three-months.
Other indicators weaken Over three months housing starts show a sharp contraction, falling at a 60.6% annual rate, a clear ongoing deceleration from a -5.2% drop over 12-months. However other metrics show slightly more upbeat results: employment, for example, yields job growth still at 1.2% at an annual rate over three-months although it slowed from a 1.4% year-over-year gain. The all-encompassing leading economic index shows an actual step up to a pace of 2.9% over 3 months from 2.6% over 6-months and 1.9% over 12-months. Manufacturing and mining output also show gains and a sharp acceleration from their year ago pace; for manufacturing output fell 1.4% year-over-year then rose at a 12.1% annual rate over the three-months ended in September; mining and oil production speeded up from a 4.7 percent 12-month gain to an 8.1% annual rate over three-months. The manufacturing and mining statistics lag by one-month. Another positive sign for the economy is unemployment as the number of unemployed declines at a 0.7% annual rate over three months even though it rises by 5.5% over 12 months.
Ranking metrics We can also vet these various sector results by looking at the growth rates year over year and comparing that pace to what has happened historically back to 2014. These individual category ranking statistics provide better relative comparisons across components. On that basis, the weak sector is retailing with real retail sales having 11.3 percentile standing and overall nominal retail sales having a 22.5 percentile standing. The next lowest year-over-year ranking is from manufacturing at a 22.7 percentile standing, that compares to a 26.1 percentile standing for housing starts. The performance of employment fares relatively better at a 38.7 percentile standing, but that's still below the 50% mark, putting job growth below its median for the period. The number unemployed, however, has a 67.6 percentile standing which is above its median and, of course, not a good result because here we would prefer to see leaner numbers on unemployment changes. The year-over-year growth rate for unemployment is solid, in the top one-third of all of the growth rates of the employed that we've seen since January of 2014. For unemployment, at least the sequential growth rates show that the process of unemployment creation is not accelerating. On the positive side the leading economic index has a 78.9 percentile standing which is quite strong and the mining and oil production have a 61.7 percentile standing which is above their median for the period.
Further context? And, when we consider the ranking of these growth rates, we can also look at the progression of growth in the table, such as the mention I made above for unemployment. For example, housing starts have a weak year-over-year standing but they have a much weaker growth rate over three months Compared to 12-months…on the other hand, manufacturing has a weak year-over-year standing but over three months manufacturing output has stepped up growth considerably. No one statistic can create a profile of these industries which live in the real world and have multiple dimensions and where the trends may be dynamic, in flux, and hard to singularly characterize.
Got inflation? As of October, Canadian inflation had picked up to some extent, inflation in Canada had dipped below the 2% mark from April through August of 2025. In September and October, the year-over-year growth of headline inflation was in the 2.3 to 2.2% region. The CPIx which didn't get quite that low, that recently got down to 1.5% and 1.6% in late 2024 and was as low as 2.2% and 2.5% from March to May of 2025 has moved up. September and October price growth rate is up to the 2.8 to 2.9% pace with the core rate running in the neighborhood of 2.6% toward the end of the year after reaching a low just below 2% in November of last year.
Nothing dramatic but a tilt to more of what Canada wants less of Oh no there's nothing dramatic going on in Canada, the economy appears to be weakening to some extent, the retail sales numbers show the largest deceleration. Of course, Canada and the US continue to have a spat over tariffs, and their two leaders still appear to be somewhat antagonistic about how that process is unfolding. Some Canadian stores have even taken the action of removing form the shelves some goods from the US, particularly US alcoholic products. The step up of inflation is something to watch and does not pair well with the weakening in economic activity.
 USA| Dec 19 2025
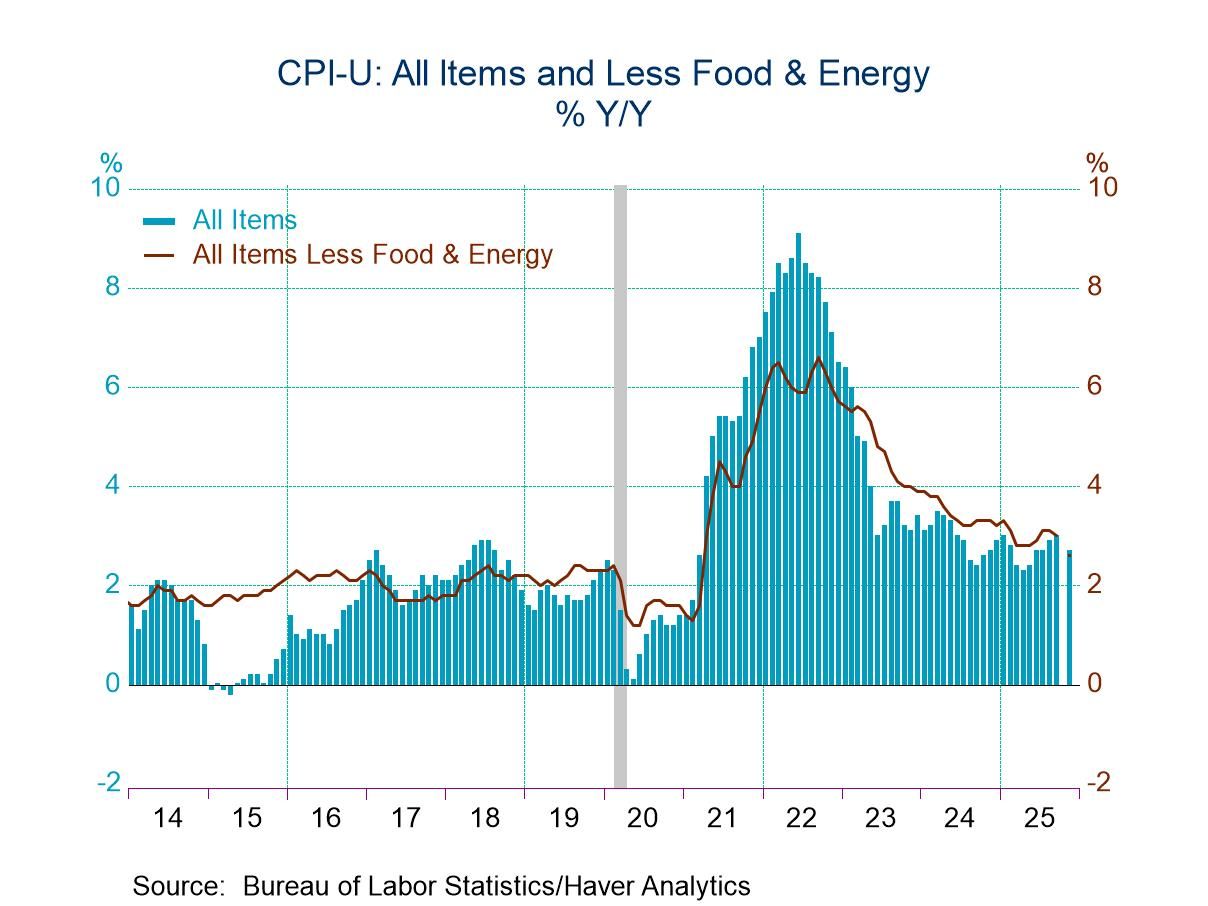
U.S. Consumer Price Inflation Moderates in November
- Year-to-year comparison is slowest in four months.
- Core price gain exhibits weakest y/y increase since 2021.
- Services price inflation tumbles y/y; core goods price gain is stable.
by:Tom Moeller
|in:Economy in Brief
 USA| Dec 19 2025
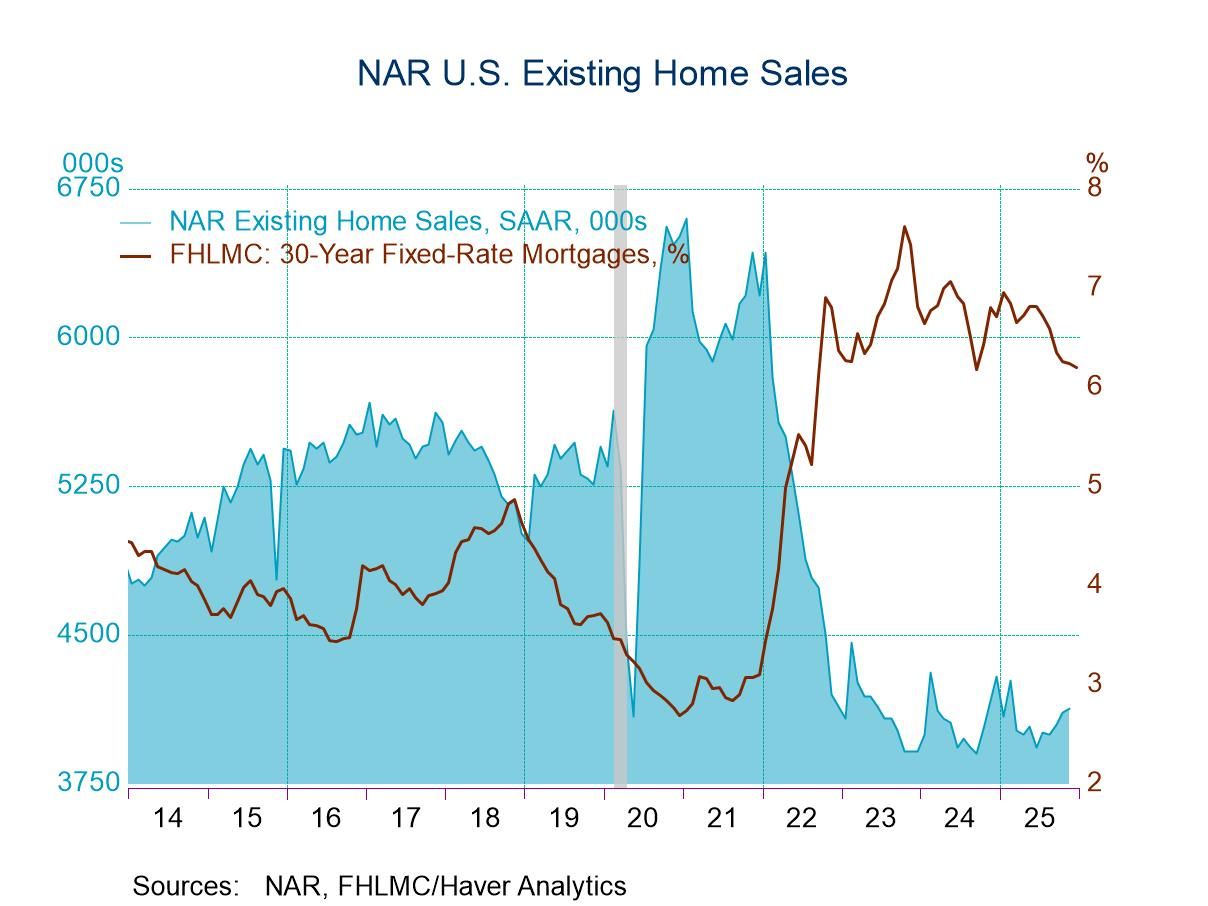
U.S. Existing Home Sales Edged Up in November
- Existing home sales increased 0.5% m/m in November, the third consecutive monthly gain.
- Month-over-month sales increased in the Northeast and South, were unchanged in the West, and fell in the Midwest.
- Year-over-year sales were unchanged in the Northeast and South and decreased in the Midwest and West.
by:Sandy Batten
|in:Economy in Brief
 United Kingdom| Dec 19 2025
CBI’s Distributive Trades Survey Weakens Sharply in December
The new UK Confederation of British Industry (CBI) survey on the distributive trades sector shows a sharp weakening of an already weak survey for December and for the outlook into January of 2026.
The month-to-month deterioration from November was widespread across metrics for retailing as well as for wholesaling for the current month as well as for the outlook. The monthly degradation is without exception across the board - omitting the inventory metric which is a different animal in any event since inventory building is sometimes involuntary.
The Retail survey Current conditions: In December, the retail survey for sales compared to a year ago, orders compared to year ago, and sales for the time of year (a seasonal adjustment metric), all worsened month-to-month. The November readings were weak and in December sales compared to a year-ago worsened by 12 points, Orders compared to a year ago worsened by 17 points month-to-month and sales for the time of year worsened by 11 points. These metrics for December are below their respective 12-month average by 6 to 13 points, as well for these categories. The rankings tell a stark story, year-on-year sales have been lower only 5.3% of the time, Year-on-year orders have been weaker only 5.6% of the time, while time of the year sales have been lower only 13% of the time. These are all extremely low-ranking metrics.
Expected Conditions: In January expected conditions have weakened month-to-month by amounts ranging from 33 points to 16 points depending on the metric. And sales and orders compared to a year ago as well as sales for the time of year each are weaker than their respective 12-month average readings by amounts ranging from 4 points to 23 points. The rankings on expectations are even worse than for the current metrics. Expected sales compared to a year ago rank lower less than 1% of the time, the same is true of orders. While sales for the time of year have been weaker 7.7 percent of the time.
Wholesale survey The rankings for wholesaling are even lower than for retailing across the current and expected metrics. The month-to-month degradation for the current readings ranges from 7 points to 17 points weaker while the reading degradation monthly ranges from 5 points to 16 points. Wholesale sales and orders compared to a year ago and sales for the time of year each rank below the 5% mark. The expectations for January shows expectations for the three categories each are at a 2.5 percentile standing or lower.
Summing up The distributive trades survey has all but crashed and burned in December. Over the last 26 years the average of the three current metrics’ rankings has been lower only 18 times. The average outlook ranking for the month ahead has been weaker only 5 times in the last 26 years (over 313 months). On a relative basis the expected sales/orders performance is more depressed than the Current results for January. The pooled rankings show current ranking over the past 26-years weaker only 5.8 percent of the time with expectations lower only 1.6 percent of the time. These are very weak metrics. It is surprising that the BOE is walking on eggshells to cut rates with mixed support for rate cuts amid such weakness. There is already a GDP decline in the monthly data for October. UK and inflation is still too high, but it is breaking lower at a relatively fast pace. Will the UK be the first economy down after Covid?
- of103Go to 2 page