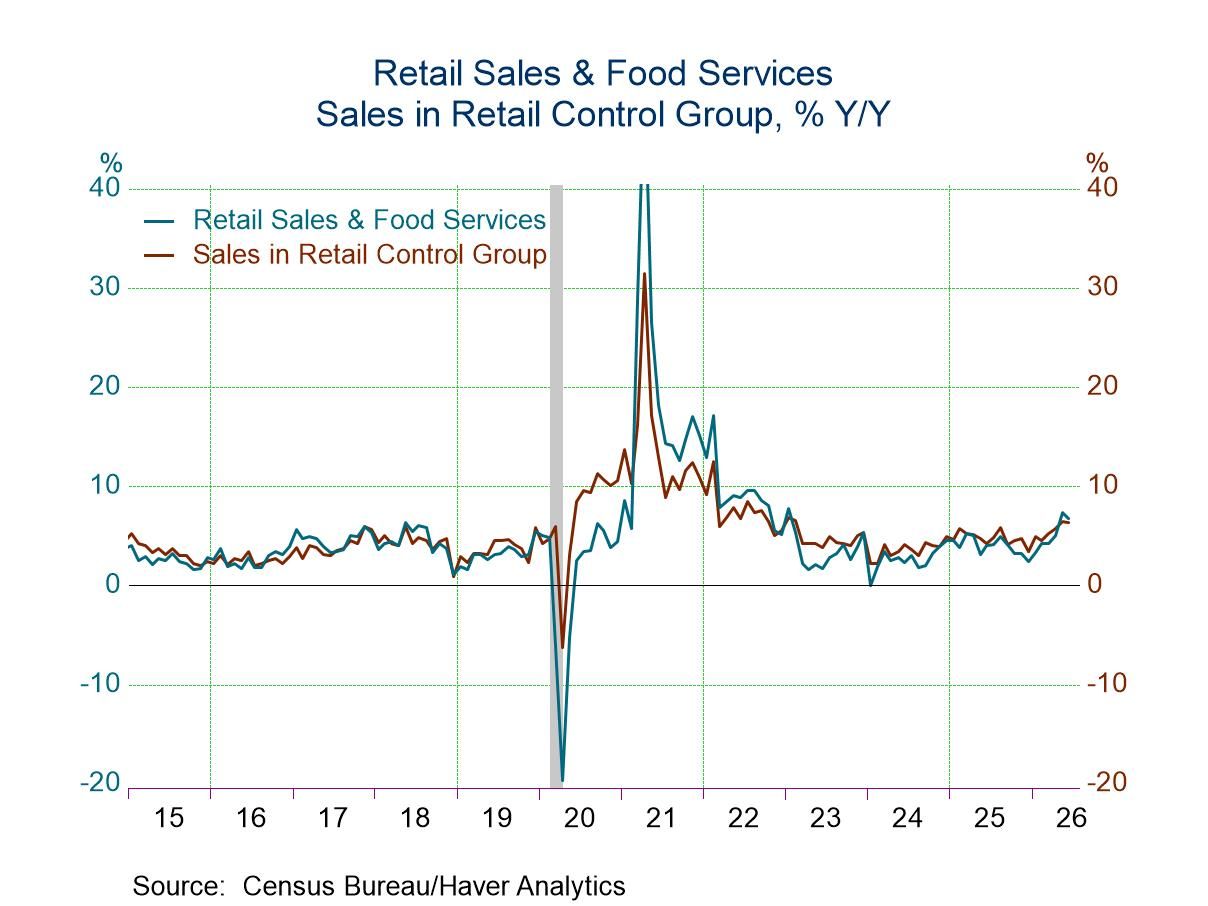
- Total sales increased 0.2% m/m in June, slightly below expectations, with an upward revision to May.
- Gasoline sales plunged 5.3% m/m, reflecting lower prices.
- Excluding gasoline sales, remaining sales rose a solid 0.7% m/m in June after a 0.9% monthly gain in May.
- Sales of the retail control group that is used to construct PCE rose 0.5% m/m in June and were up 9.2% at an annual rate in Q2 from Q1.
Introducing
Sandy Batten
in:Our Authors
Sandy Batten has more than 30 years of experience analyzing industrial economies and financial markets and a wide range of experience across the financial services sector, government, and academia. Before joining Haver Analytics, Sandy was a Vice President and Senior Economist at Citibank; Senior Credit Market Analyst at CDC Investment Management, Managing Director at Bear Stearns, and Executive Director at JPMorgan. In 2008, Sandy was named the most accurate US forecaster by the National Association for Business Economics. He is a member of the New York Forecasters Club, NABE, and the American Economic Association. Prior to his time in the financial services sector, Sandy was a Research Officer at the Federal Reserve Bank of St. Louis, Senior Staff Economist on the President’s Council of Economic Advisors, Deputy Assistant Secretary for Economic Policy at the US Treasury, and Economist at the International Monetary Fund. Sandy has taught economics at St. Louis University, Denison University, and Muskingun College. He has published numerous peer-reviewed articles in a wide range of academic publications. He has a B.A. in economics from the University of Richmond and a M.A. and Ph.D. in economics from The Ohio State University.

Publications by Sandy Batten
 USA| Jul 16 2026
U.S. Retail Sales in June Slowed by Drop in Gasoline Sales
by:Sandy Batten
|in:Economy in Brief
 USA| Jul 16 2026
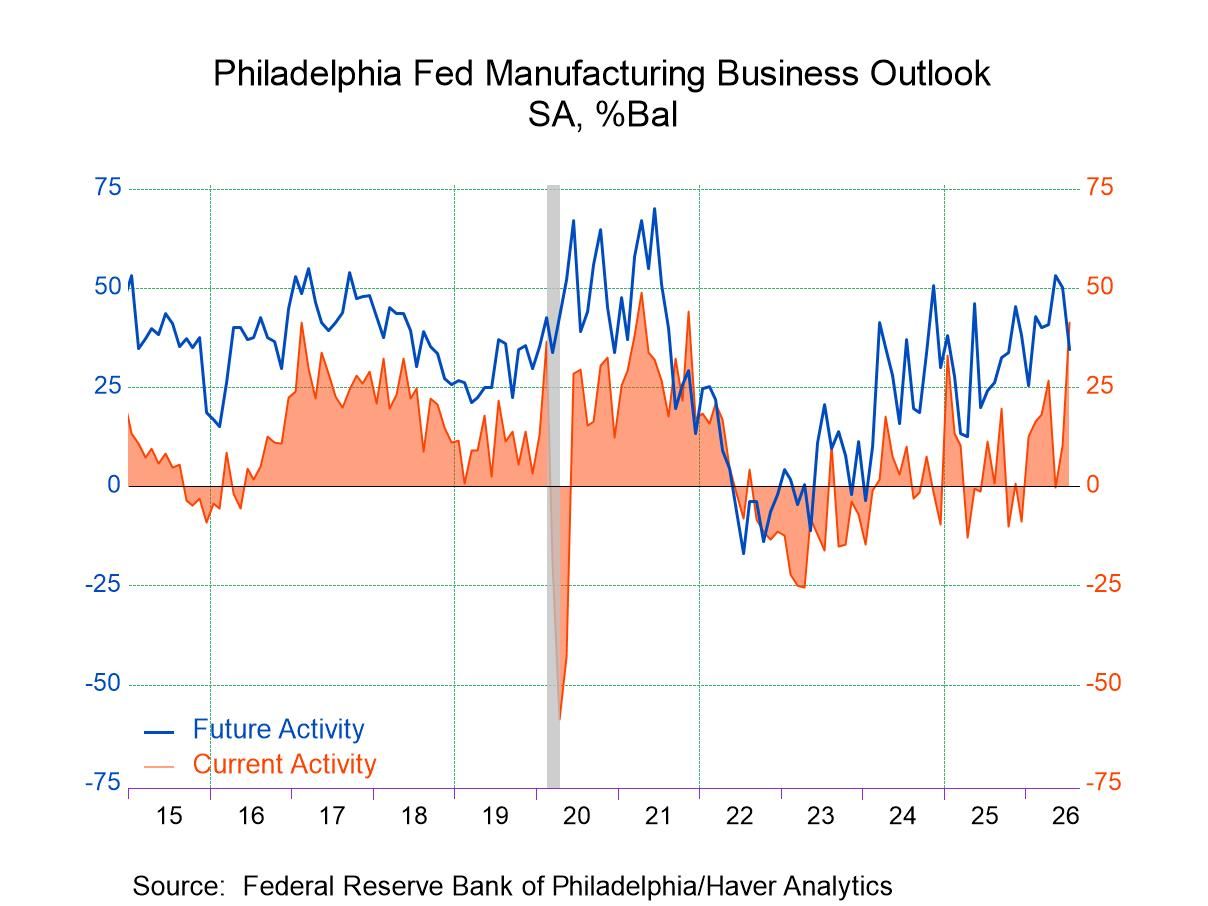
U.S. Philly Fed Manufacturing Index Jumps in July
- The headline index jumped to 41.4 in July, much larger than expected and the highest reading since November 2021.
- The outsized increase was widespread across components with the ISM-adjusted index rising to 58.1, its highest reading since January 2025.
- Prices remained elevated but were little changed in July from June.
- Delivery times lengthened meaningfully, indicating some incipient supply chain problems.
- The survey’s broad indicators for future activity continued to suggest expectations for growth over the next six months, although most readings fell meaningfully.
by:Sandy Batten
|in:Economy in Brief
 USA| Jul 15 2026
U.S. Producer Prices Fell in June
- Led by a 6.4% m/m decline in energy prices, the PPI for final demand fell 0.3% m/m in June.
- Goods prices fell 1.4% m/m, the first monthly decline since January, while services prices rose 0.2% m/m.
- Excluding food, energy and trade margins, the new core measure edged up 0.1% m/m while the old core (excluding just food and energy) rose 0.2% m/m in June.
by:Sandy Batten
|in:Economy in Brief
 USA| Jul 07 2026
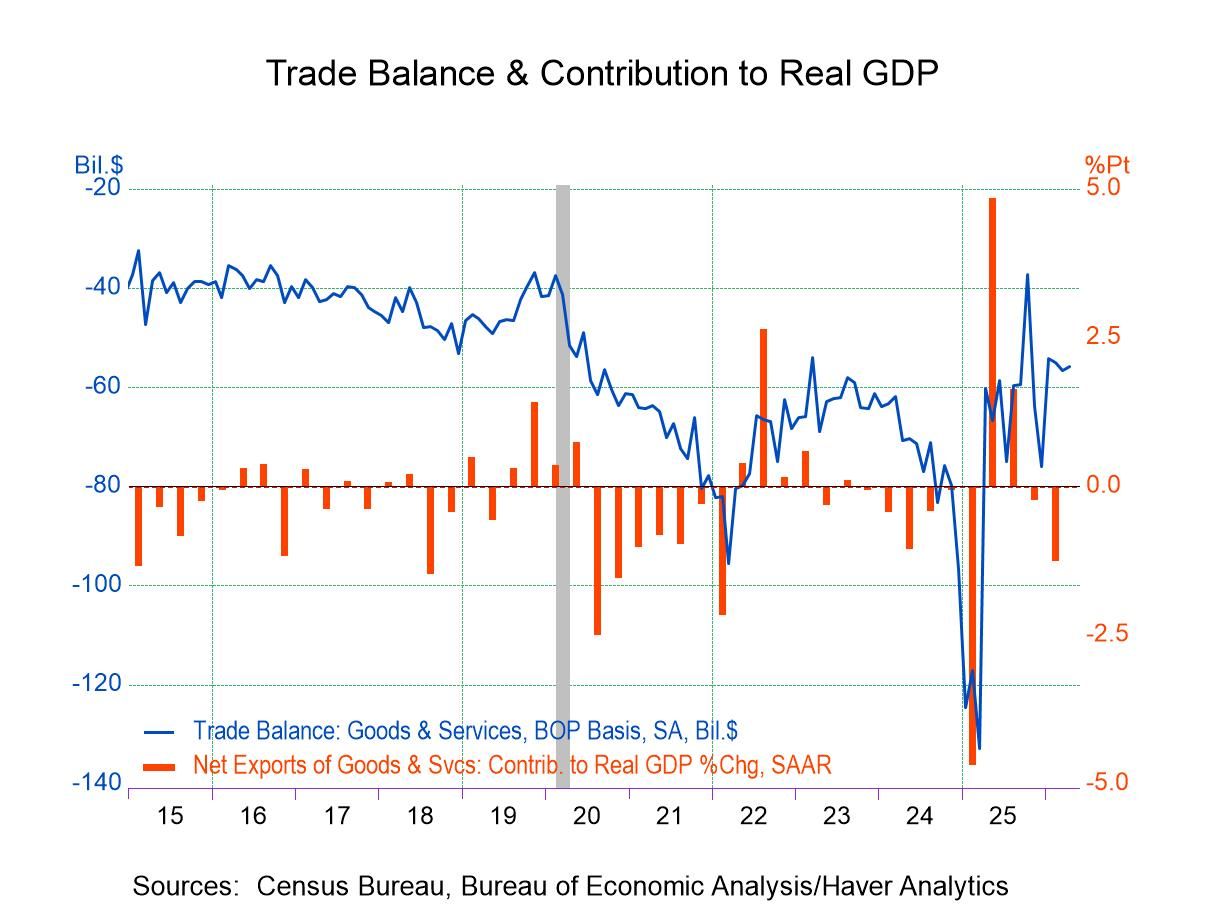
U.S. Trade Deficit Widened Markedly in May
- The deficit in goods and services widened to $77.6 billion in May from $54.6 billion in April.
- Exports slumped 3.2% m/m, led by an outsized fall in exports of nonmonetary gold and other precious metals.
- Imports increased by 3.3% m/m with increases in each major end-use category.
- The goods deficit widened to $106.5 billion, while the services surplus widened to $28.9 billion.
by:Sandy Batten
|in:Economy in Brief
 USA| Jul 02 2026
U.S. Payroll Employment Gains Smaller than Expected in June
- U.S. nonfarm payrolls increased 57,000 in June with meaningful downward revisions to both April and May.
- The market consensus looked for a 115,000 increase.
- The unemployment rate edged down to 4.2% from 4.3%, due mostly to a large decrease in the labor force.
- Average hourly earnings rose 0.3% m/m (3.5% y/y), in line with expectations.
by:Sandy Batten
|in:Economy in Brief
 USA| Jun 30 2026
U.S. JOLTS: Openings and Hiring Little Changed in May
- Openings edged up 9,000 but to the highest level since May 2024.
- However, hiring fell 45,000 for the third monthly decline in the past four months.
- Separations rose 63,000 with increases in both quits and layoffs.
by:Sandy Batten
|in:Economy in Brief

- Q1 GDP growth was unexpectedly revised up to 2.1% q/q saar in the third estimate, up from 1.6% in the second estimate and inching past the 2.0% advance estimate.
- A meaningful downward revision to imports was the primary factor behind the upward revision, leading to a much smaller subtraction from net exports.
- Personal consumption expenditures growth was revised down to 0.5% q/q saar, the slowest pace since Q1 2022, due mostly to a downward revision to household spending on financial services and insurance.
- With the downward revision to import demand and PCE, domestic demand growth was revised down meaningfully to 1.7% q/q from 2.4%.
by:Sandy Batten
|in:Economy in Brief
 USA| Jun 17 2026
U.S. Retail Sales Jumped More than Expected in May
- Total sales increased 0.9% m/m in May, nearly twice expectations.
- Auto sales rebounded, rising 1.2% m/m in May, more than reversing a 0.9% monthly decline in April.
- Gasoline sales rose 3.4% m/m in May.
- Excluding auto and gasoline sales, remaining sales increased by a solid 0.5% m/m in May, the same monthly increase as in April.
- Sales of the retail control group that is used to construct PCE rose 0.7% m/m in May and are 8.6% annualized above the Q1 average.
by:Sandy Batten
|in:Economy in Brief
 USA| Jun 16 2026
U.S. Housing Starts Plunged in May
- Housing starts plunged 15.4% m/m in May to the lowest level since May 2020 with a significant downward revision to the previously reported April decline.
- Single family starts fell 1.9% m/m while multi-family starts plummeted 40.2% m/m to their lowest level since November 2024.
- Less volatile permits slid 0.7% m/m in May with a slight rise (+0.6% m/m) in single-family permits and a 2.8% monthly drop in multi-family permits.
by:Sandy Batten
|in:Economy in Brief
 USA| Jun 09 2026
U.S. Trade Deficit Narrowed in April
- The deficit in goods and services narrowed to $55.9 billion in April from a downwardly revised $56.6 billion in March.
- Exports rose 2.6% m/m, led by a 33% monthly jump in petroleum exports.
- Imports increased by 2.0% m/m, led by a 5.8% m/m rise in capital goods imports.
- The goods deficit narrowed to $83.7 billion, and the services surplus narrowed to $27.8 billion.
by:Sandy Batten
|in:Economy in Brief
 USA| Jun 04 2026
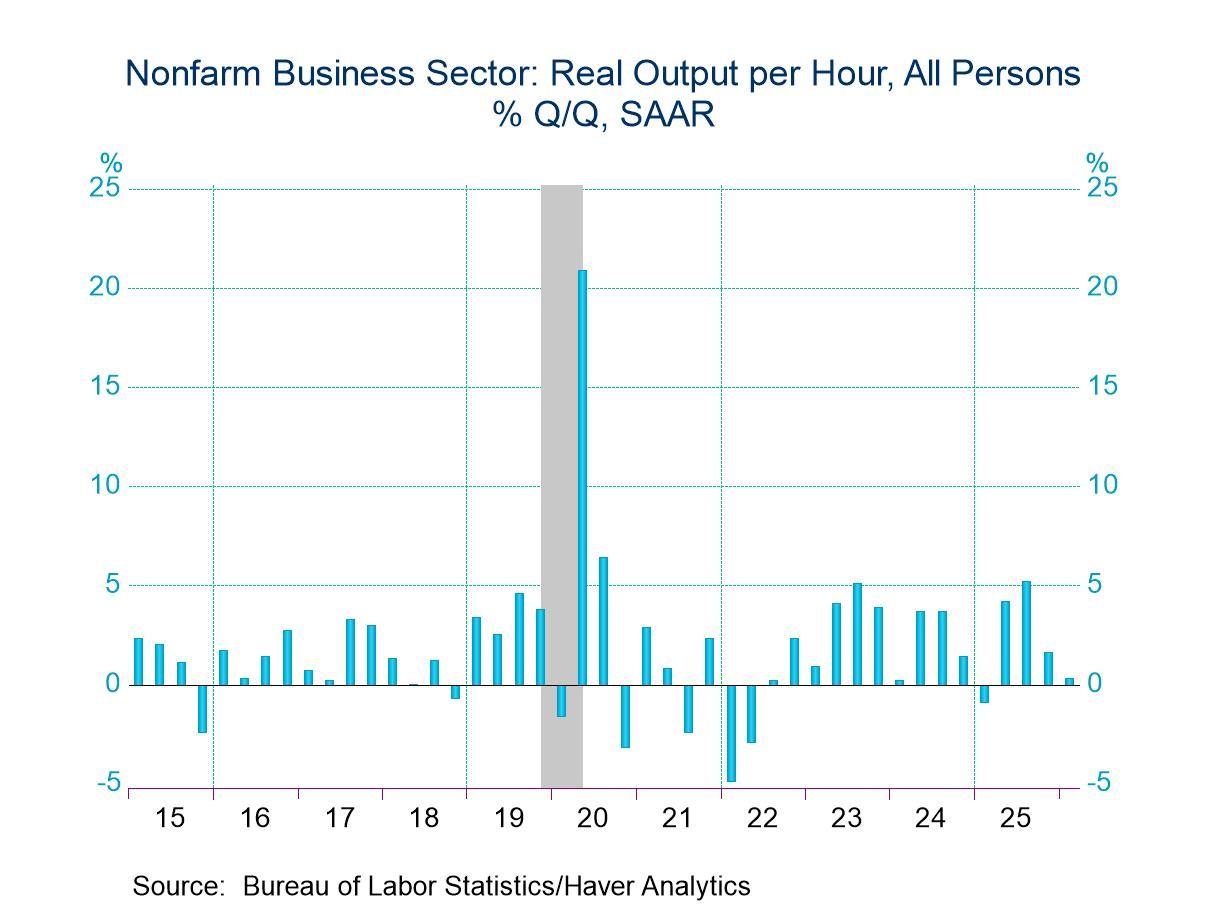
U.S. Q1 Productivity and Unit Labor Cost Growth Revised Down
- Q1 output per hour growth was revised down to 0.3% q/q saar in the second estimate from 0.8% in the first, reflecting a downward revision to output.
- However, longer-term productivity growth remained solidly well above trend.
- Compensation growth was revised down meaningfully, resulting in a downward revision to unit labor cost growth to 1.8% from 2.3% previously.
by:Sandy Batten
|in:Economy in Brief
 USA| Jun 04 2026
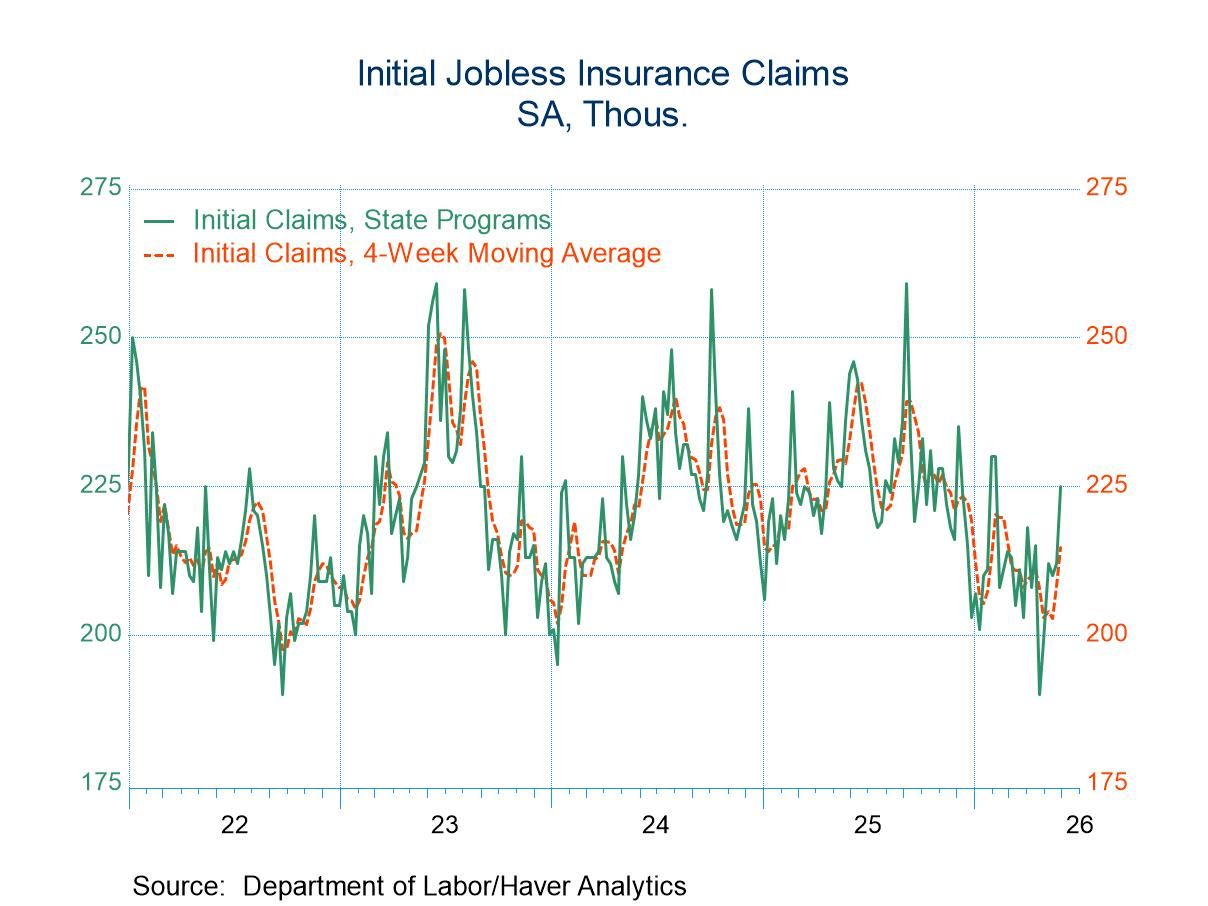
U.S. Initial Unemployment Claims Jumped in Latest Week
- Initial claims rose more than expected to 225k in the week ending May 30.
- This is the largest weekly claims figure since February 7.
- However, continuing claims continued to trend down, falling to 1.777 million in the week ending May 23 from 1.785 million in the previous week.
by:Sandy Batten
|in:Economy in Brief
- of60Go to 1 page