Growth of U.S. Employment Cost Index Unchanged in Q2
by:Sandy Batten
|in:Economy in Brief
Summary
- Compensation grew 0.9 q/q in Q2, the same pace as in both Q1 and Q4 2024.
- Wage growth picked up to 1.0% q/q while benefits slowed to 0.7% q/q after Q1 surge.
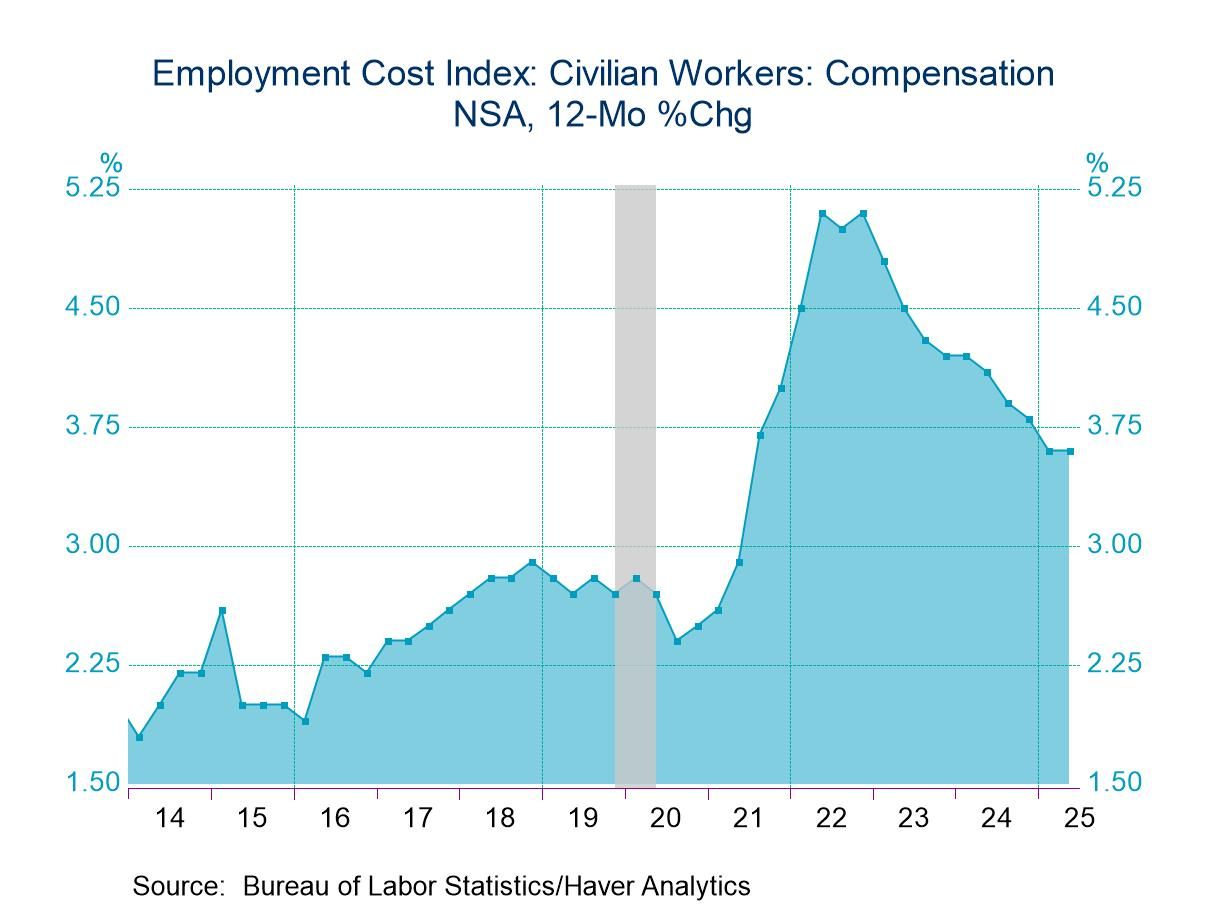
The employment cost index (ECI) for civilian workers, arguably the most accurate measure of labor compensation in the United States, rose 0.9% q/q (3.6% y/y) in Q2, the same quarterly increase as in Q1 and in last year’s Q4, according to the Bureau of Labor Statistics. The quarterly gains have fluctuated between 0.8% and 1.0% for the past seven quarters. The Action Economics Forecast Survey had expected a 0.8% q/q increase and a 3.5% y/y gain.
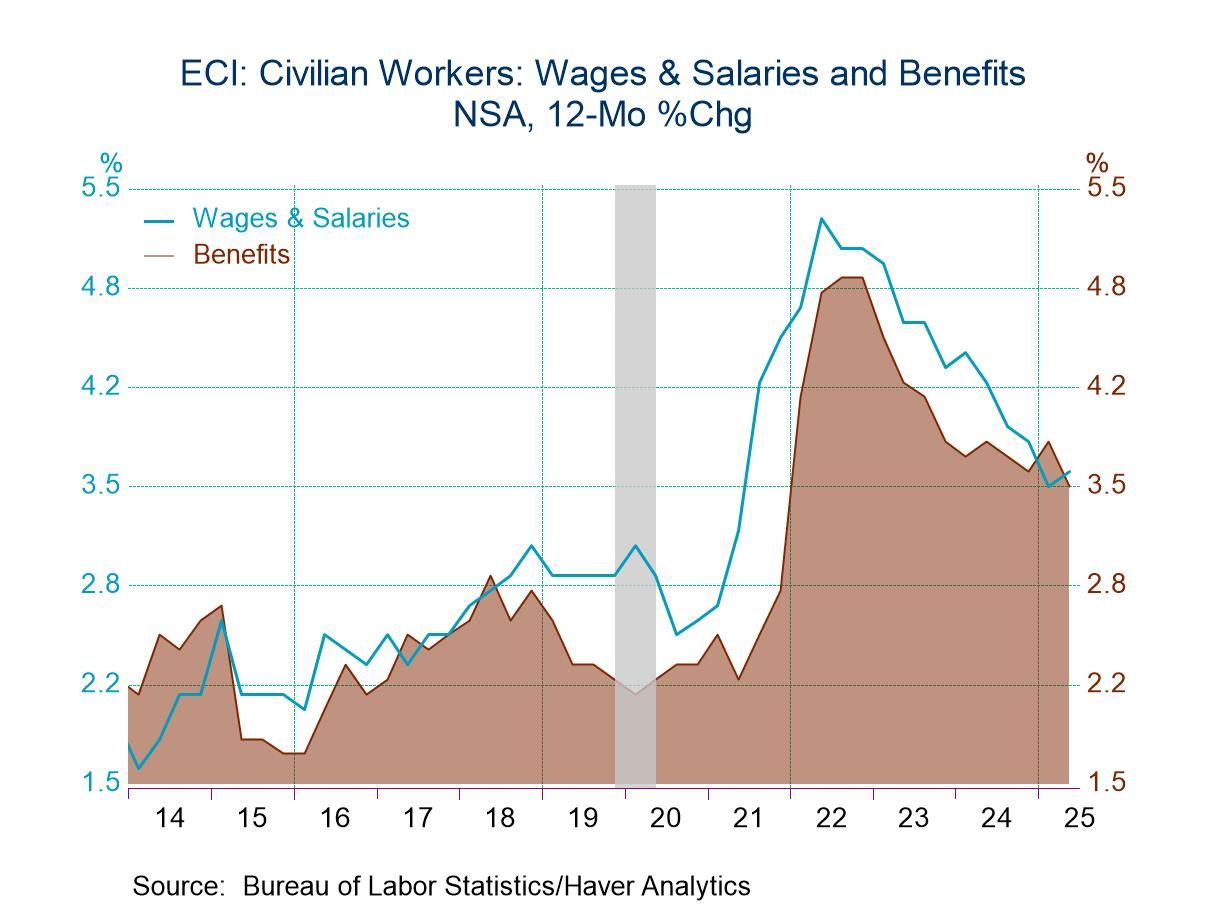
Wages and salaries for civilian workers rose 1.0% q/q (3.6% y/y) in Q2, up from a 0.8% q/q (3.5% y/y) gain in Q1. Benefits growth retreated to 0.7% q/q (3.6% y/y) following a 1.2% q/q (3.9% y/y) surge in Q1. In general, employment cost gains remain above the pace observed prior to the pandemic and are not yet consistent with the Fed’s 2% inflation target.
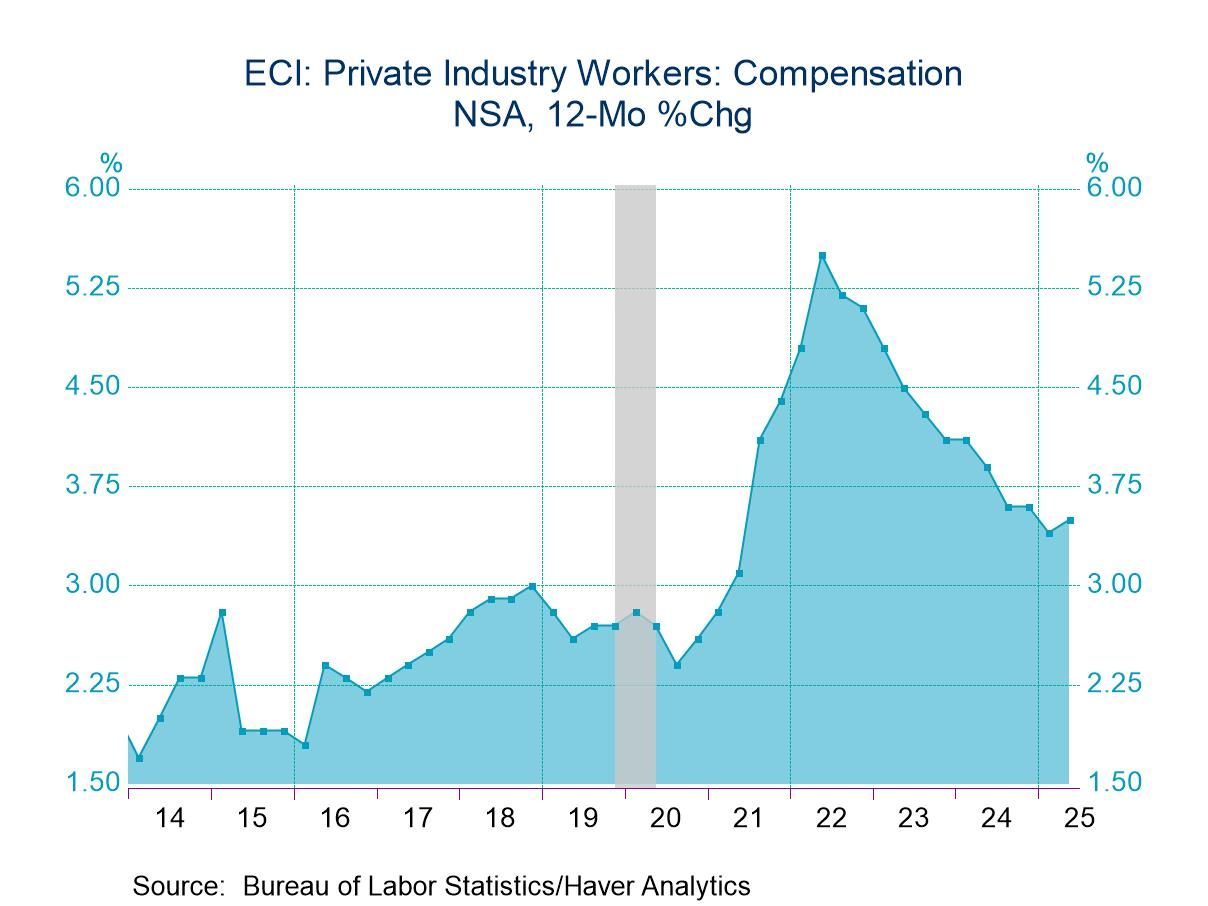
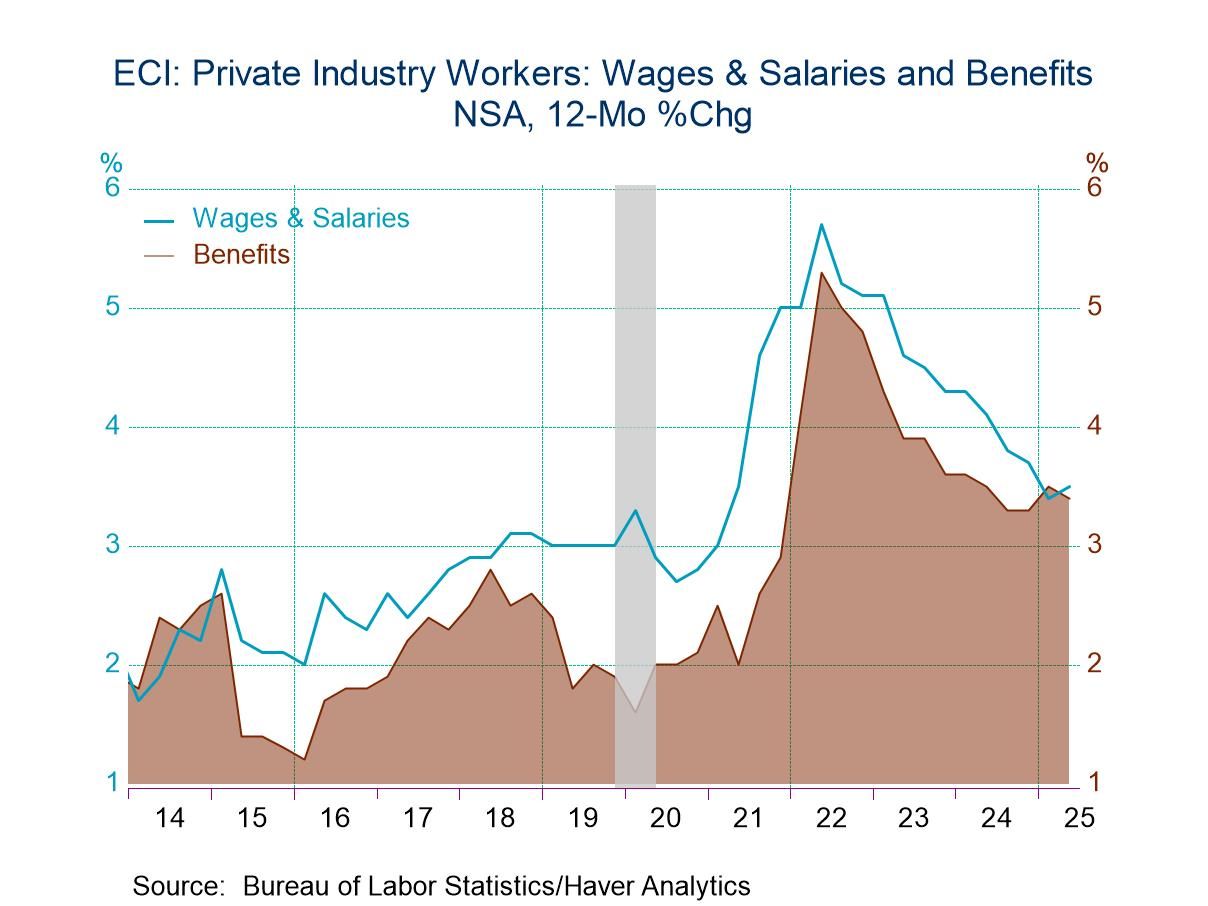
Private industry workers’ compensation rose 1.0% q/q (3.5% y/y), up from 0.8% q/q (3.4% y/y) in Q1. The quarterly gain in Q2 was the largest since Q1 2024. Wages and salaries for private industry workers also increased 1.0% q/q (3.6% y/y) in Q2 versus 0.8% q/q (3.4% y/y) in Q1. Benefits for private industry workers slowed to 0.7% q/q (3.4% y/y) in Q2 after having jumped 1.2% q/q (3.6% y/y) in Q1, which was the largest quarterly gain since Q2 2022.
Compensation in private goods-producing industries increased 0.9% q/q (3.6% y/y) in Q2 versus a 1.0% q/q (3.2% y/y) increase in Q1. The y/y increase in Q2 was the largest since Q1 2024. Manufacturing compensation rose 1.0% q/q, the largest quarterly gain since Q1 2024. Construction compensation slowed to a 0.8% q/q increase in Q2 following a 1.3% q/q jump in Q1. Compensation in private service-producing industries gained 1.0% q/q (3.5% y/y) in Q2, up from 0.8% q/q increase in Q1. The Q2 rise in compensation in service-producing sectors was led by a 1.4% q/q increase in information compensation, the largest quarterly increase since Q2 2022, and a 1.1% q/q gain in healthcare and social assistance compensation. In contrast, leisure compensation edged up 0.4% q/q, its smallest quarterly gain since Q3 2015.
The employment cost index measures the change in the cost of labor, free from the influence of employment shifts across occupations and industries. It is provided by the Bureau of Labor Statistics and is available in Haver’s USECON database. Consensus estimates from the Action Economics Forecast Survey are in Haver’s AS1REPNA database.

Sandy Batten
AuthorMore in Author Profile »Sandy Batten has more than 30 years of experience analyzing industrial economies and financial markets and a wide range of experience across the financial services sector, government, and academia. Before joining Haver Analytics, Sandy was a Vice President and Senior Economist at Citibank; Senior Credit Market Analyst at CDC Investment Management, Managing Director at Bear Stearns, and Executive Director at JPMorgan. In 2008, Sandy was named the most accurate US forecaster by the National Association for Business Economics. He is a member of the New York Forecasters Club, NABE, and the American Economic Association. Prior to his time in the financial services sector, Sandy was a Research Officer at the Federal Reserve Bank of St. Louis, Senior Staff Economist on the President’s Council of Economic Advisors, Deputy Assistant Secretary for Economic Policy at the US Treasury, and Economist at the International Monetary Fund. Sandy has taught economics at St. Louis University, Denison University, and Muskingun College. He has published numerous peer-reviewed articles in a wide range of academic publications. He has a B.A. in economics from the University of Richmond and a M.A. and Ph.D. in economics from The Ohio State University.
More Economy in Brief
 Asia
Asia

