- May IP +0.1% (+1.7% y/y), third m/m increase in four months, led by a 1.3% gain in mining.
- Manufacturing unchanged (+1.4% y/y), w/ durables +0.8% and nondurables -0.9%.
- Selected high-tech +1.8%, third straight m/m rise; motor vehicles +1.2%, fifth gain in six mths.
- Utilities -0.4%, led by a 1.7% drop in electric utilities output.
- Key categories in market groups mostly up.
- Capacity utilization up to a 10-month-high 76.2%; mfg. capacity utilization steady at 75.7%.


 Global

More Commentaries
 Europe| Jun 11 2026
EMU Inflation and An ECB Rate Hike
Channeling ‘The Who,’ the ECB implemented its 'We Won’t Get Fooled Again' rate hike. During COVID, inflation spiked around the world as central bankers were late with rate hikes. Arguably, too many of them followed the lead of the U.S. Federal Reserve. The ECB leaned against that by hiking its key deposit rate by 25bp today.
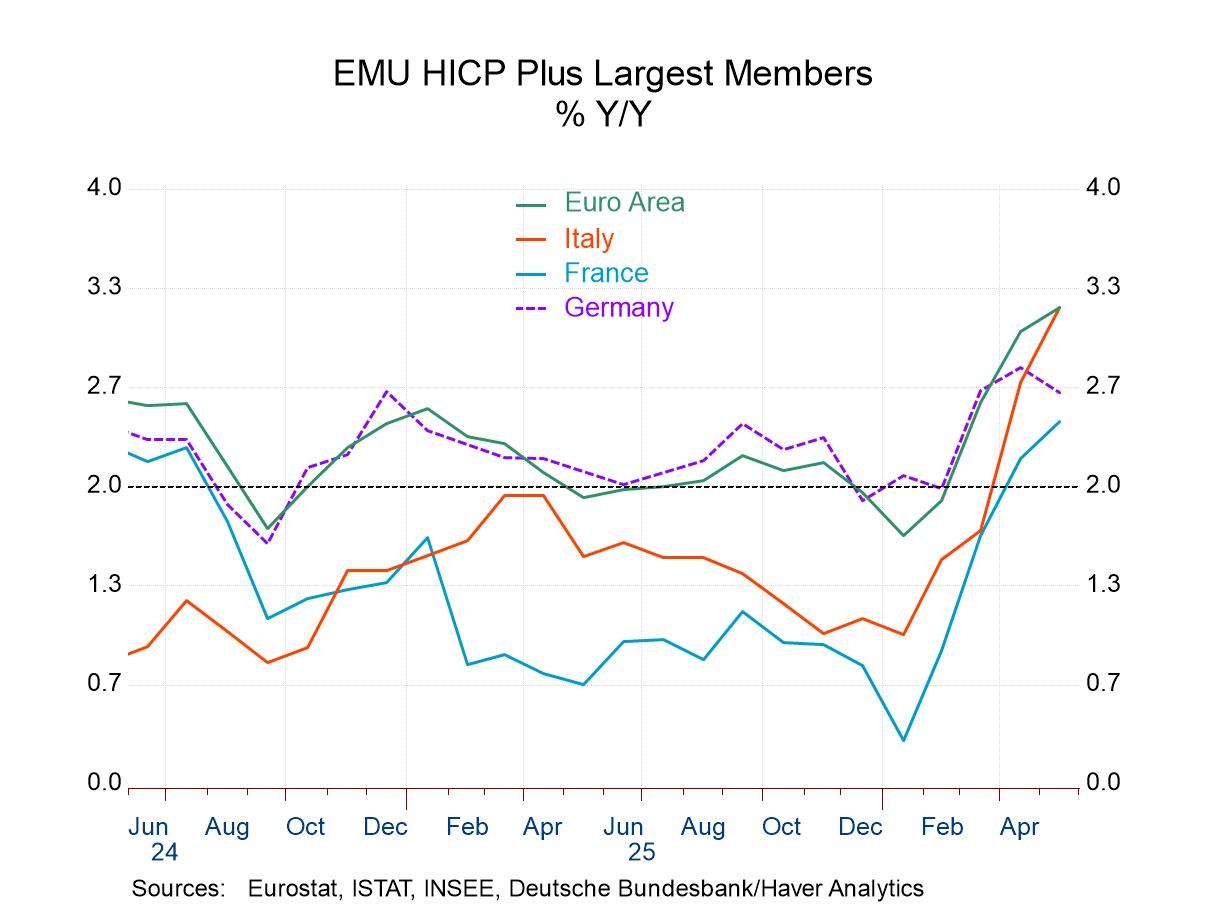
Both the chart and the table show how inflation has recently soared sharply in the countries of the European Monetary Union. However, the price gains are concentrated in the headlines and driven by oil prices. Still, oil price gains this large and persistent—and potentially long-lasting—will permeate the pricing of most goods since there will be knock-on effects through transportation costs. The ECB has therefore taken a step to keep in line with the increase in energy prices.
If there are further impacts from energy prices, the ECB has the door open to move again. But if price pressures wane, the ECB will be under no pressure to act again.
For now, we can see that headline inflation across the European economic area is generally accelerating strongly and somewhat uniformly. The three-month annualized HICP rose at a 6.3% annual rate. With three-month inflation among these 11 long-lived EMU members, the highest three-month pace is 13.5% in Luxembourg. Germany has the lowest inflation over three months, at a 4% pace.
The 12-month inflation pace is better contained, of course, with a top gain of 4.5% in Greece compared to the slowest pace at 2.5% in France and Germany. Over three months and 12 months, headline inflation shows deceleration occurring in none of these countries on these two timelines. So, the ECB action is timely.
The median gain for the group over three months is 6.5%, close to the overall EMU weighted result. The 12-month median is at 3.2%, also close to the 12-month EMU pace.
By comparison, I calculate the median for the core at 2.2% over three months and 2.0% over 12 months—right on the ECB’s inflation objective. Core inflation is never the central bank’s target, but it does strip out the volatility. So, we can understand the ECB’s move as an effort to keep up with what might be a changed trend. And if it is not a changed trend, then the ECB can peel its rate hike back. But for now, it is going to stay close to the short-term impact on the inflation rate to be sure that it will control inflation developments in the future. This is a good way to not repeat past mistakes.
 USA| Jun 10 2026
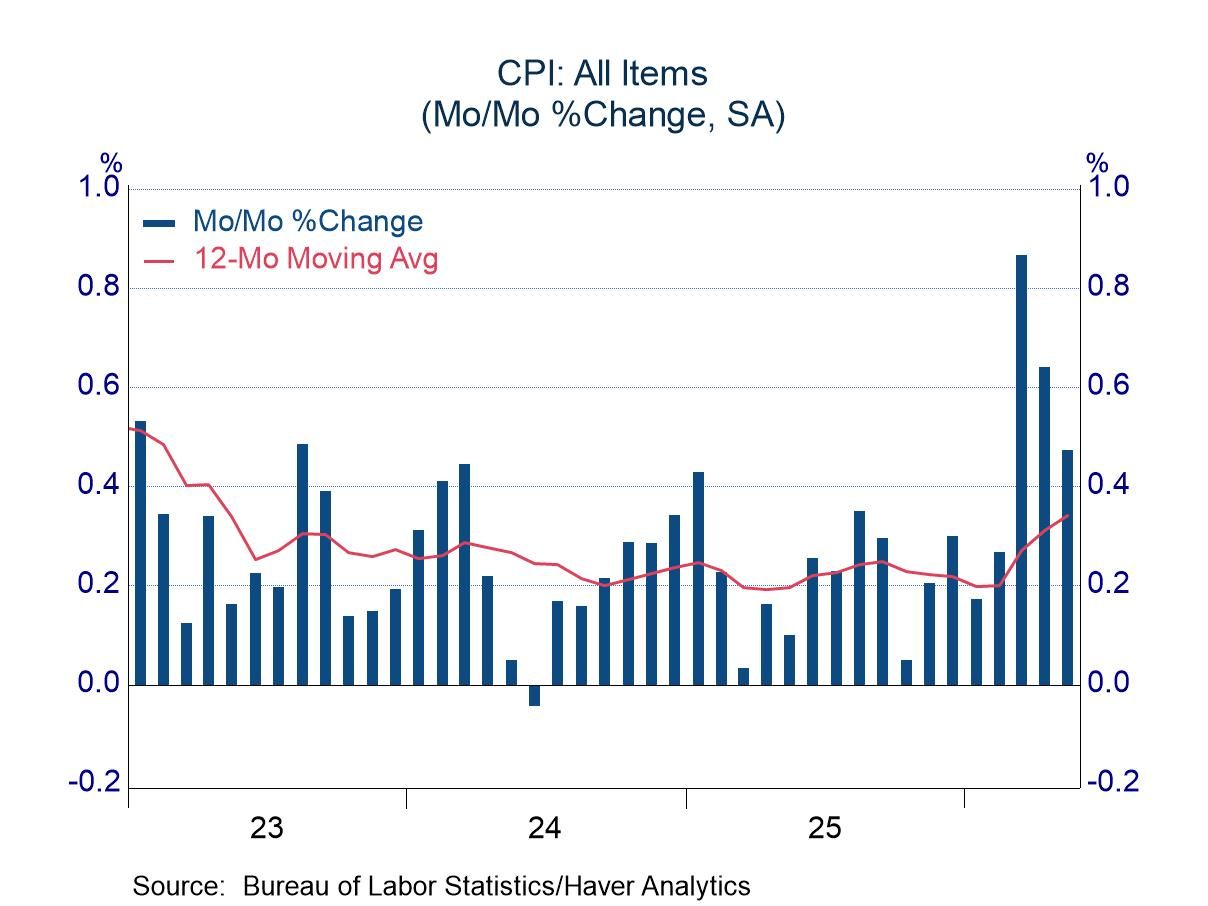
May CPI: Another Jump in Energy Prices; Core Contained
- Gasoline prices drove the energy component higher again, but June might bring some relief.
- Little apparent pass through from energy to core.
 USA| Jun 10 2026
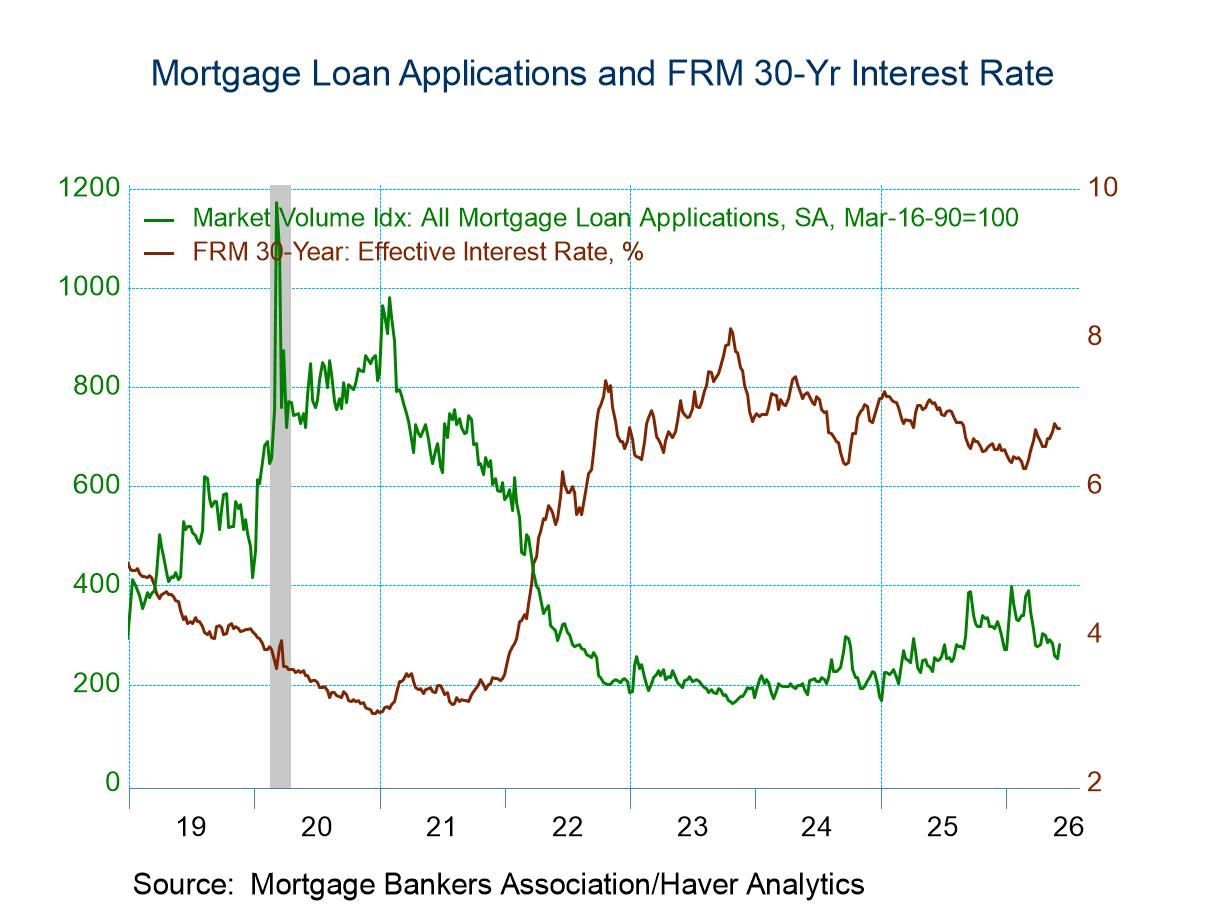
U.S. Mortgage Applications Jumped in the June 5 Week
- Both applications for loans to purchase and applications for loan refinancing rose in the latest week.
- Interest rate on 30-year fixed-rate loans rose 1bp to 6.78%.
- Average loan size edged up.
 Japan| Jun 10 2026
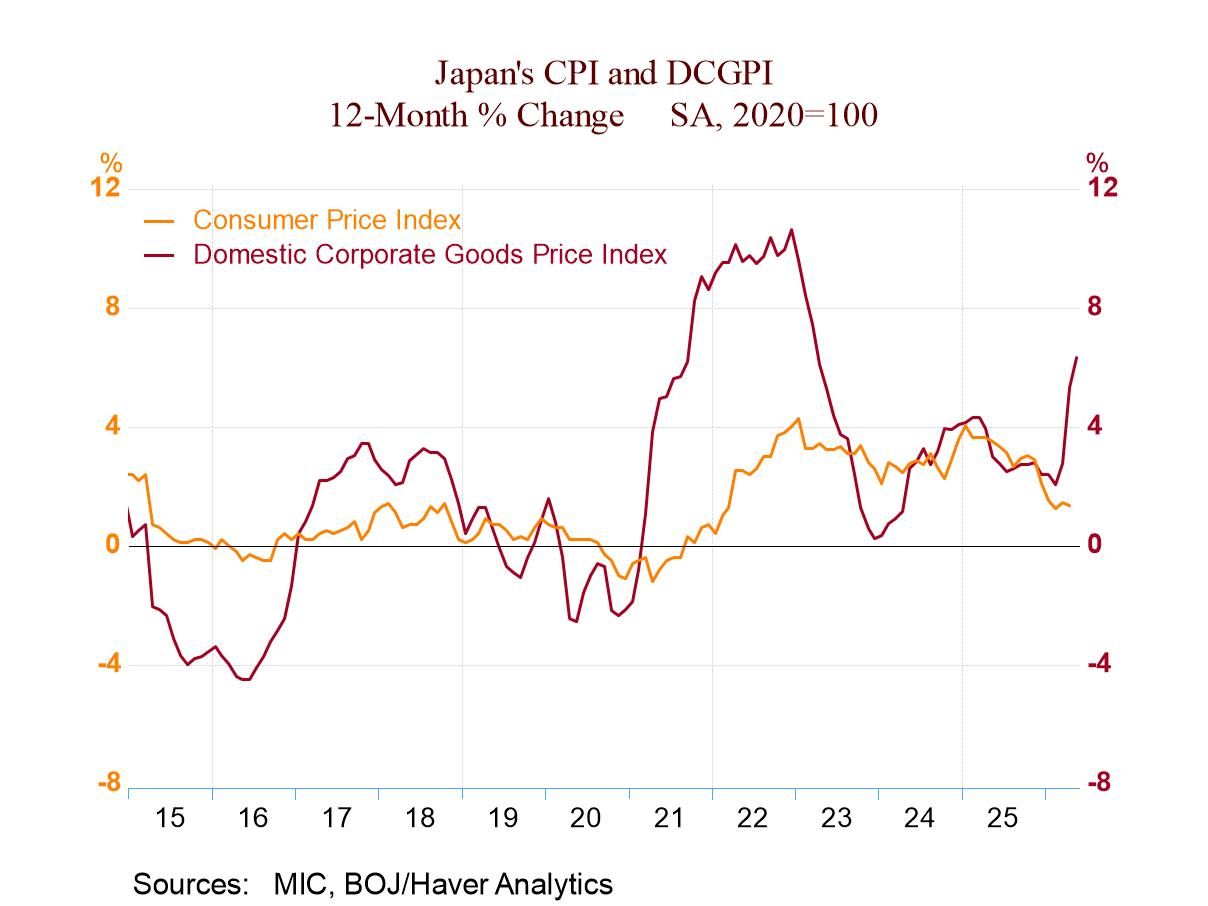
Japan’s PPI—The PPI Is Not the CPI
Once again, we are seeing Japan’s PPI creating a separation from the CPI. Both the CPI and PPI were trending lower before the attack on Iran. The CPI has better maintained its downtrend, but the PPI has been blasted higher. In 2021, there was also a huge spike in the PPI that the CPI did not follow immediately, although the CPI eventually responds, rising in a much more muted way.
These behaviors caution us from thinking that the CPI is going surge in step with the PPI but also warn us not to expect this gain to be ignored by the CPI. There will be a lagged response.
The PPI explosion is really strong, with the three-month annualized increase in the PPI and manufacturing prices both approaching 20%. Both measures are up at a much more muted 6% to 6.5% over 12 months, so the acceleration has been strong and sudden.
The table also shows lagged data that re-express the PPI trend to put it on the same timeline as Japan’s CPI and the U.S. and EMU PPIs. The PPI in the EMU has surged in line with the gains seen in Japan. However, in the U.S., the PPI has accelerated from a gain of 2.4% over 12 months to an annual rate rise of just 7.8% over three months.
But in Japan, the CPI and core CPI gauges have continued to temper their rises, using data through April and looking at sequential growth pressures on Japan’s CPI. It’s quite amazing!
Japan imports its oil and so would seem quite vulnerable to oil price spikes. However, because it is vulnerable, Japan takes steps to assure its supply and control its oil costs by arranging long-term contracts. That has helped to contain the impetus of surging global oil prices. Globally, oil (Brent, in dollars) is off sharply in May after turning slightly lower in April. Sequentially, Brent prices are up 44.4% over 12 months, up at a 110.2% annual rate over six months, and still up at 187.6% annualized rate over three months.
The table also shows some simple correlations with Brent prices. It demonstrates that the correlation between PPI prices of various sorts and Brent ranges from 0.4 to 0.5. But the correlation to Japan’s CPI price metrics is negative. So far, Japan’s CPI has been true to those results.
The Bank of Japan continues to struggle with its own view of the inflation risk. It is wary of damaging the economy but also concerned about allowing the door open to inflation because of its massive debt-to-GDP ratio. The BOJ is going to remain on inflation watch for some time.
 USA| Jun 09 2026
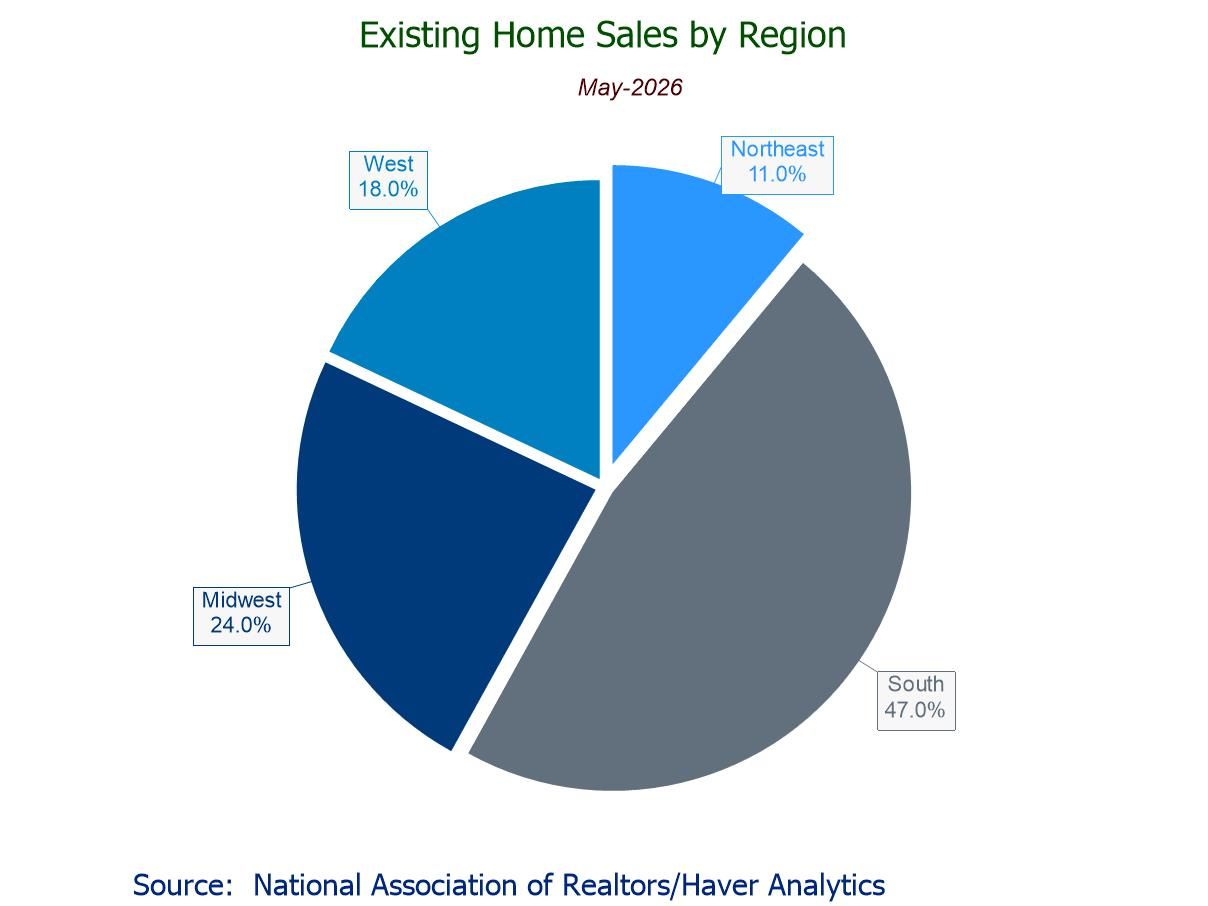
U.S. Existing Home Sales Reach a Five-Month High in May, Third M/M Gain in Four Months
- May sales +3.2% m/m to higher-than-expected 4.17 mil.; +3.2% y/y, second straight y/y rise.
- Sales m/m up in the Midwest (+6.4%), South (+3.2%), and Northeast (+2.2%), flat in the West; sales y/y up in all regions except the Northeast (-8.0%).
- Median sales price +2.8% (+1.3% y/y) to $429,300, highest since June ’25.
- Unsold inventory +3.3% (+0.6% y/y) to 10-month-high 1.55 mil. units; 4.5 months' supply.
 USA| Jun 09 2026
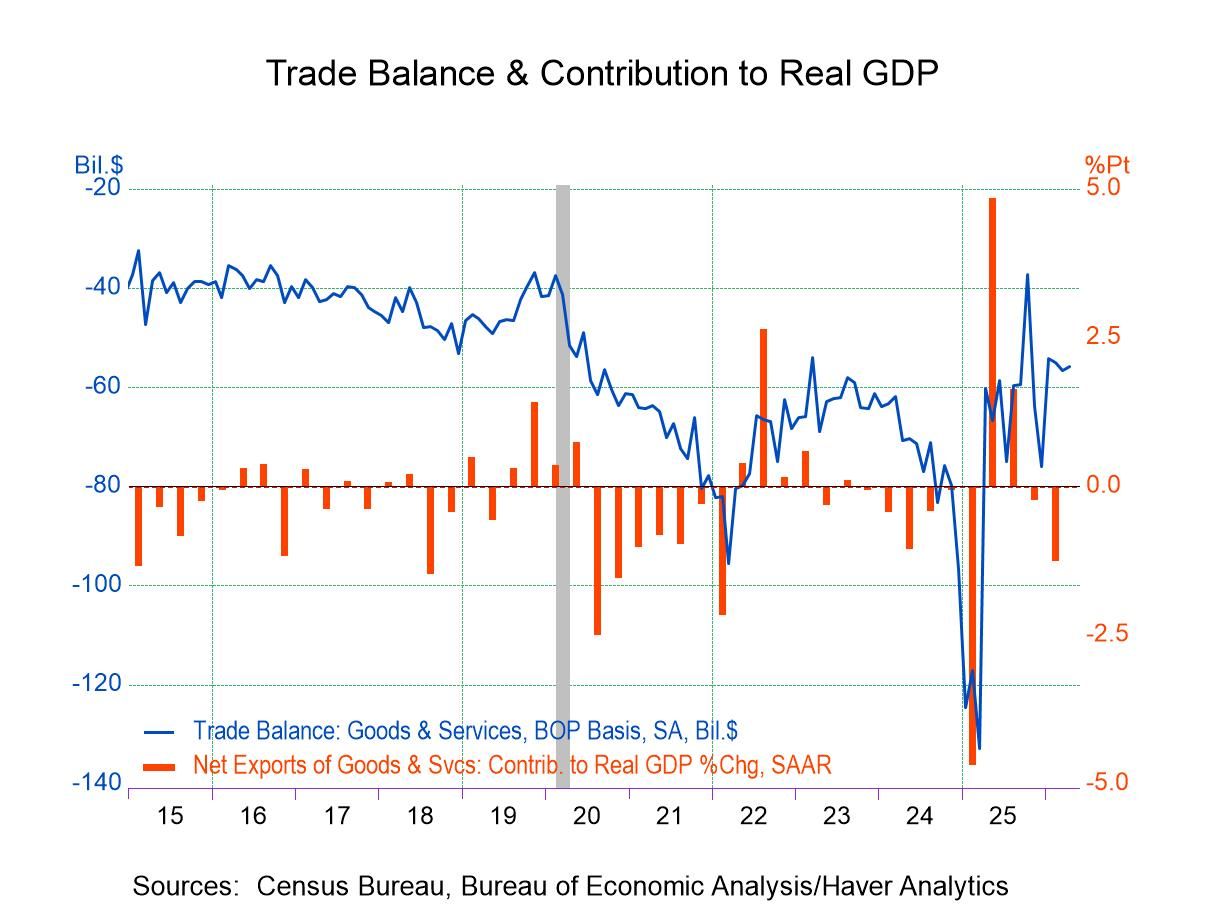
U.S. Trade Deficit Narrowed in April
- The deficit in goods and services narrowed to $55.9 billion in April from a downwardly revised $56.6 billion in March.
- Exports rose 2.6% m/m, led by a 33% monthly jump in petroleum exports.
- Imports increased by 2.0% m/m, led by a 5.8% m/m rise in capital goods imports.
- The goods deficit narrowed to $83.7 billion, and the services surplus narrowed to $27.8 billion.
by:Sandy Batten
|in:Economy in Brief
 Germany| Jun 09 2026
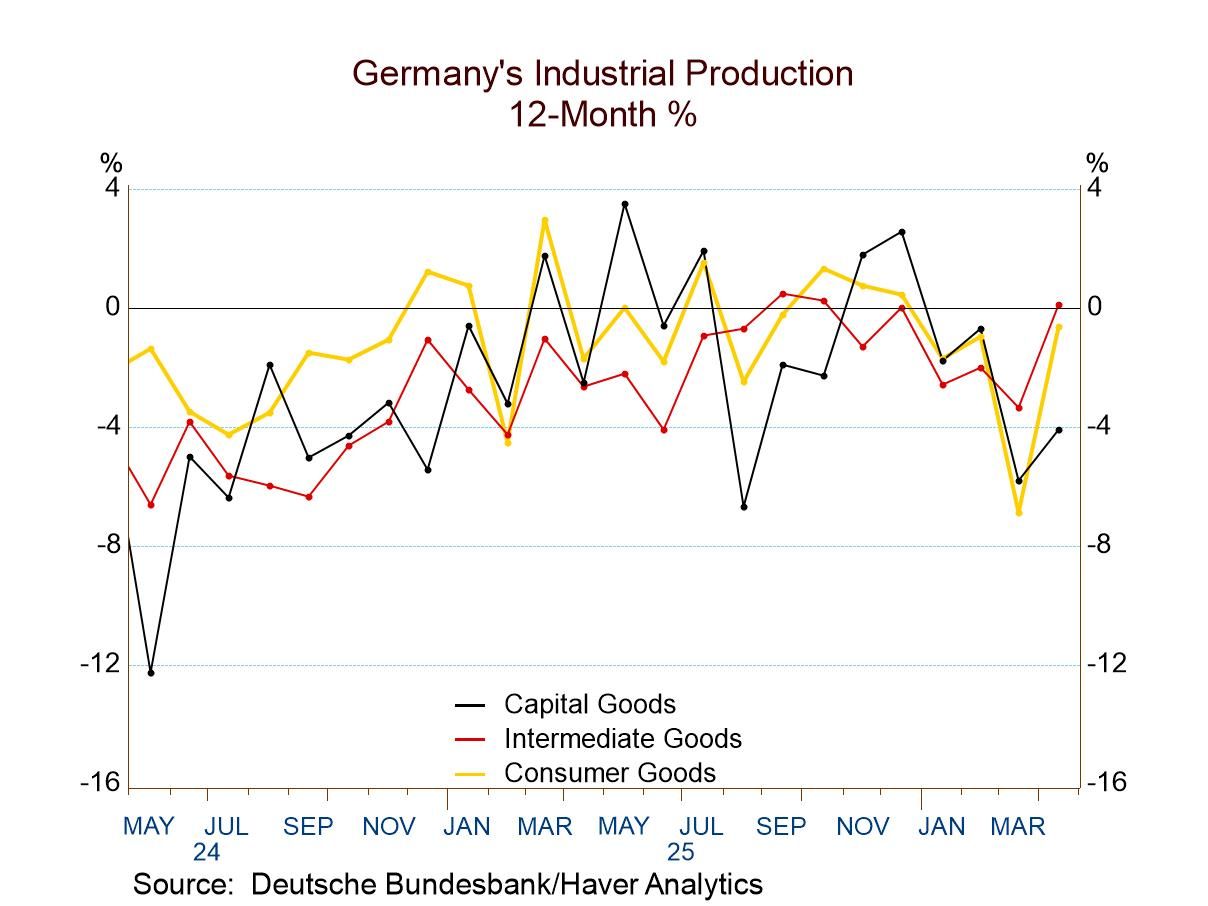
German IP Rebounds in April
In the wake of a mixed in somewhat complex orders report from Germany yesterday, today Germany released its industrial production report. It shows output up by 0.4% in April after several months of declines. There was a strong gain of 1.9% month-to-month in consumer goods output and another strong gain of 1.4% in intermediate goods output. However, capital goods output continues to be weak, falling 1.5% month-to-month and continuing a string of five months in a row when manufacturing output for capital goods has declined.
Sequentially, overall output is showing strengthening growth rates from 12 months to six months to three months. The tendency to strengthen is driven by intermediate goods that have the exact same pattern in play. However, capital goods are showing increasing weakness from 12 months to six months to three months, culminating in a three-month annualized growth rate of -10.5%. The growth rate in consumer goods is weaker over three months and over 12 months but isn't intact progressively over all three periods. The chart is helpful here as it shows recent weakness and a more recent rebound that still leaves year-over-year growth rates declining.
Manufacturing output shows declines over each of these three periods without a clear trend tendency for speeding up or cooling down. Real manufacturing orders are close to accelerating over this same sequence of dates, while retail sector sales in manufacturing show increases in two of the periods, with a decline over three months at the end of the sequence and without a clear trend in place.
Other German industrial indicators are showing consistent weakness and deterioration from 12 months to six months to three months. That holds for the ZEW current index, the IFO manufacturing index, the IFO expectations index for manufacturing, and the European Commission’s index of industrial activity.
As for other early-reporting European economies, we have France, Spain, Portugal, and Norway to compare. France is showing acceleration from 12 months to three months. Spain comes close to showing consistent acceleration and finishes with a massive 60% annual rate of increase over three months. Portugal fails to show consistent signs but ends with strong output growth over three months as well. Norway also fails to show a consistent pattern and has a solid 2.3% growth rate over three months. The results from France and Spain are the most impressive among these—France because it shows consistent acceleration, and Spain because it is so very strong over the last three months.
In the quarter to date (QTD)—with one month of data in hand for the second quarter—all German sectors are showing expansion except for capital goods and manufacturing overall. The indicators for Germany show weakened conditions as we step into the new quarter, except for the EU Commission index. The four European countries we chronicled earlier, all show gains in the quarter to date, with France and Spain showing the most pickup.
The final column of the table ranks year-over-year growth rates on data back to 2006. On this basis, only the German intermediate goods sector has a year-over-year growth rate that ranks above its median for the period. Real manufacturing orders are close to their median with a 49.2 percentile standing, whereas the median occurs at a ranking of 50%. For the other industrial indicators, we compare them to historic index levels, and all four of the indicators are substantially below their historic marks since 2006. Meanwhile, for the four countries in Europe, three of the four are showing industrial output results that rank above their historic medians: Spain shows a 79th percentile ranking, France has a 77th percentile ranking, and Portugal has a 53rd percentile ranking. Only Norway has a subpar (below-median) 25th percentile ranking.
 Germany| Jun 08 2026
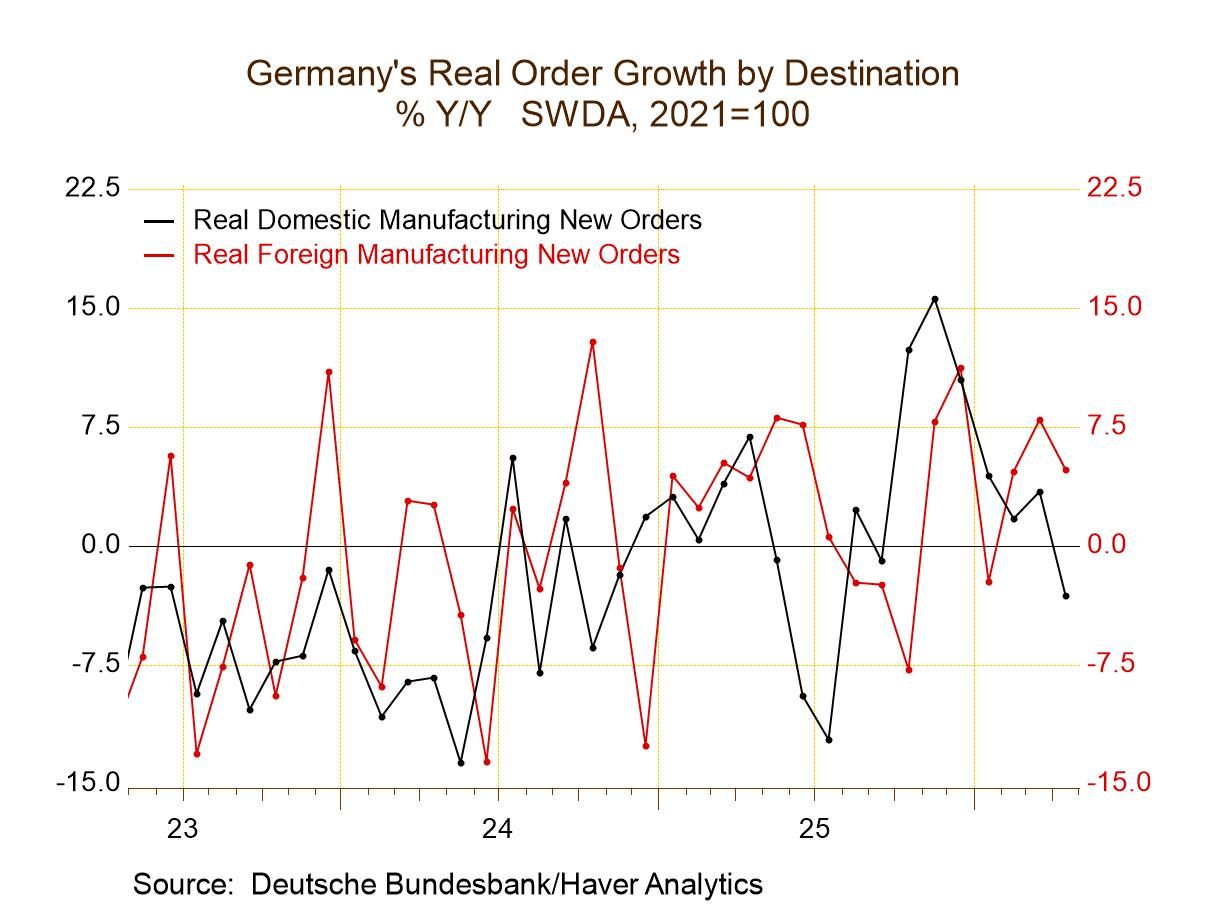
German Orders Drop, But Trend Offers Hope
German orders, now available for April, show both domestic and foreign orders are sketching a herky-jerky path higher. The volatility is such that we can't be sure the momentum will remain higher, but for the time being, the present orders are oscillating around an upward trend. There is a particularly striking downward movement in domestic orders, with three sizeable month-to-month drops in the last four months. The drop in foreign orders, at 4.2% month-to-month, is sharp, but that follows two months of very strong gains—although they follow one month of a substantial drop. German orders are simply sketching out a very dissonant path—very hard to discern a trend.
German orders show systemic sequential declines in domestic orders, an event that is offset by systematic sequential acceleration in foreign orders. The net result of total orders is an order slowdown over six months and four months that gives way to a sharp rise over three months.
Sector sales, expressed also in real trend, show consumer durable goods sales and intermediate good sales both engaged in alternating behavior.
Early in Q2, German orders show declines overall an in domestic orders that are only partly blunted by a sizeable rise in foreign orders. Sector sales show a real gain in manufacturing, pushed ahead by consumer durables and intermediate goods, against weakness in nondurables and in capital goods. The broad ranking of annual growth rates for sales and orders show abject ranking weakness for orders and all sales, with the sole exception of orders by foreigners—that series has a ranking above its median at the 60.7 percentile mark.
To compare German industry with other key European sectors, we use the EU industrial confidence gauges. This shows Spain as the only country among Spain, Italy, Germany, and France, with an industrial sector ranking above the 50th percentile mark (above its median reading). All of the manufacturing readings have negative values in April; however, only Germany shows an advance in progression from 12 months to six months to three months.
The industrial order report for April is weak, but there are undercurrents of uptrends embedded in the report. The month’s results and trends may be better than the current month’s topical readings suggest.
- of2723Go to 1 page