Initial U.S. Unemployment Claims Little Changed in Most Recent Week
by:Sandy Batten
|in:Economy in Brief
Summary
- New claims edged down to 224,000 from 227,000 in the previous week.
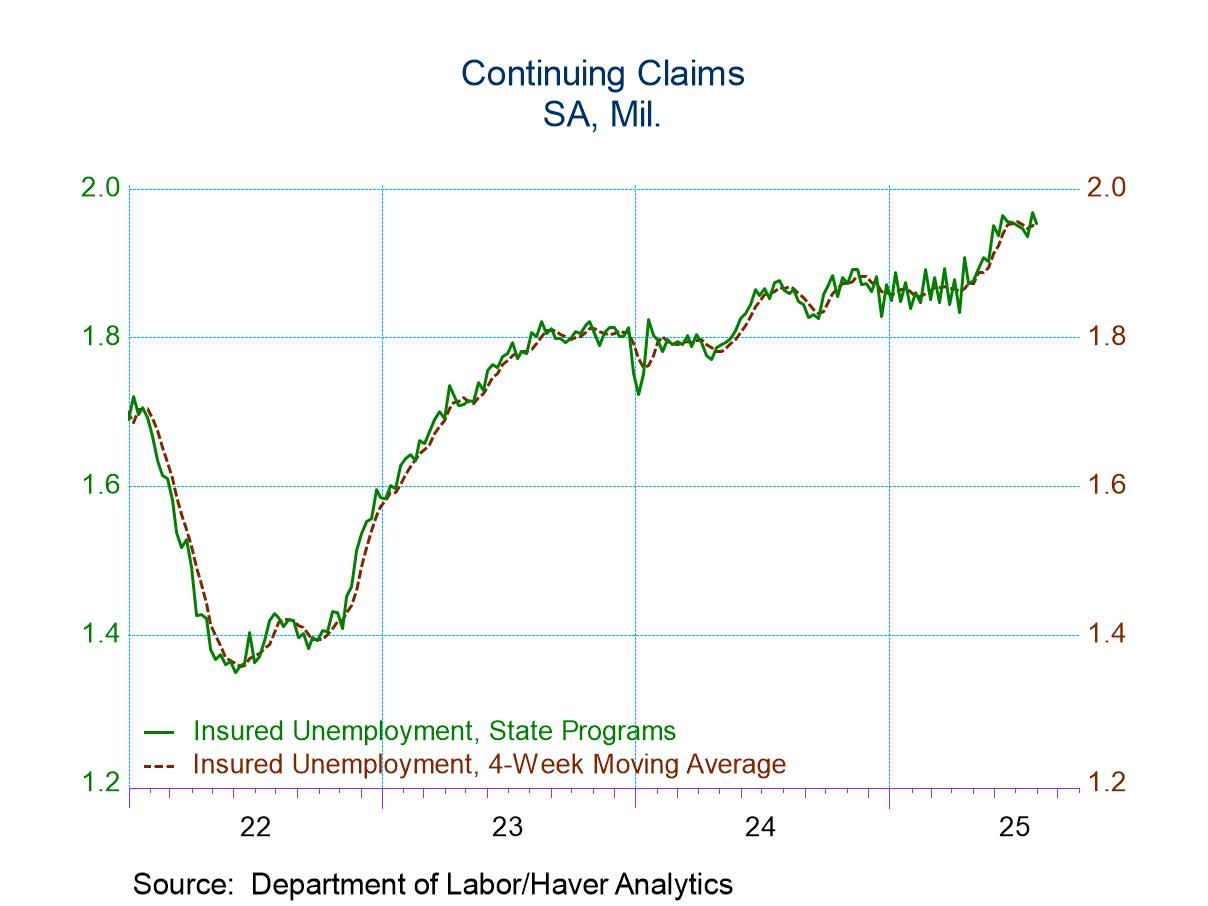
- Continuing claims fell to 1.953 million from 1.968 million.
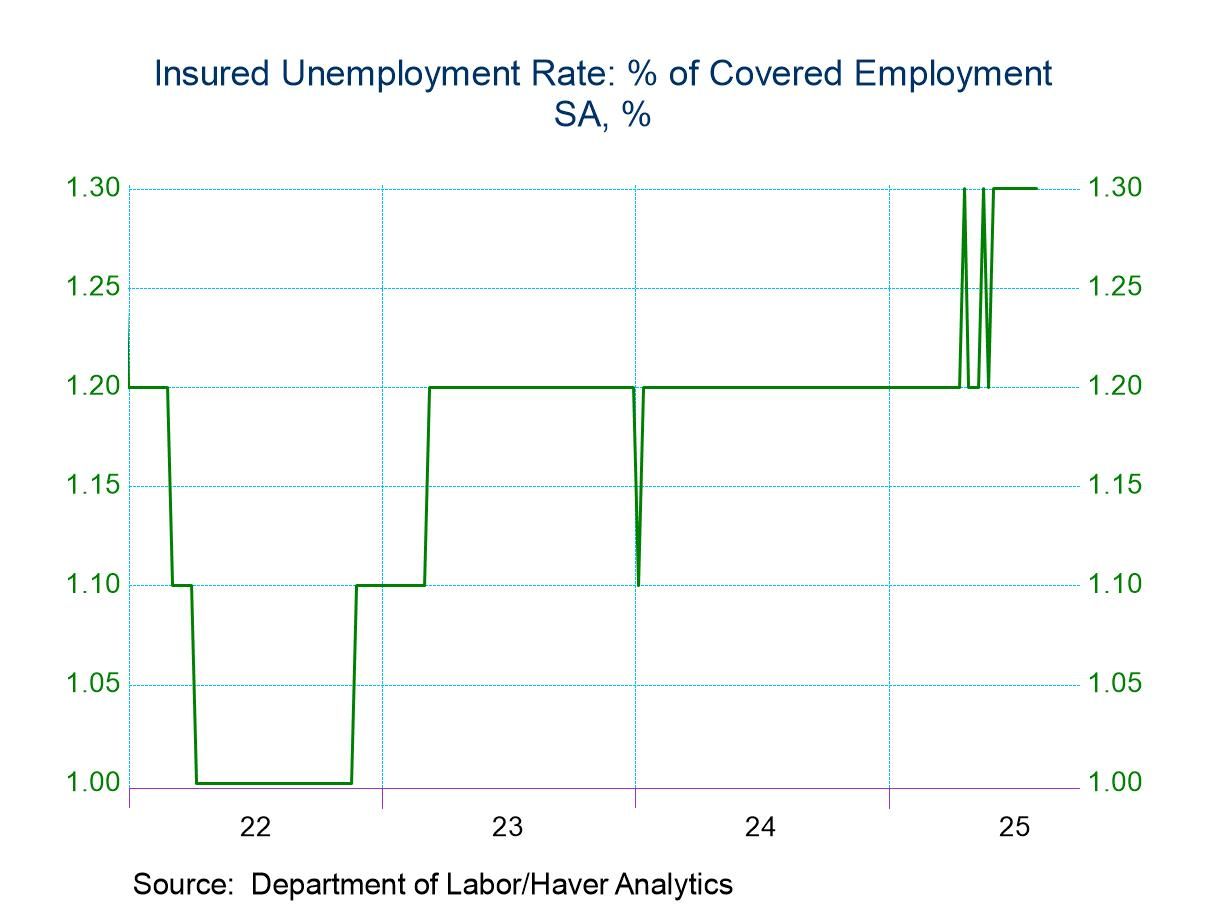
- The insured unemployment rate was unchanged at 1.3%.
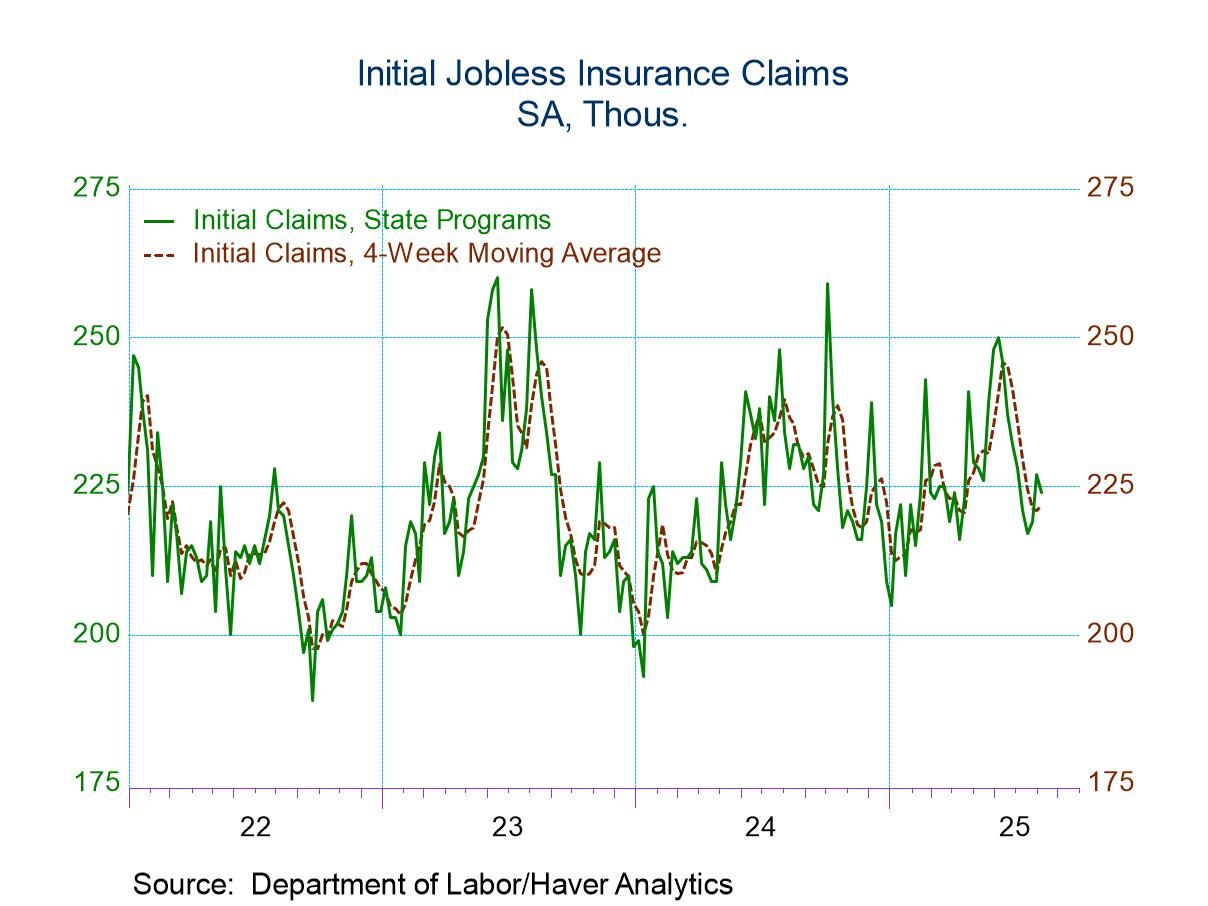
Initial claims for unemployment insurance edged down to 224,000 (-1.8% y/y) in the week ended August 9 from a slightly upwardly revised 227,000 in the prior week (previously 226,000). The Action Economics Forecast Survey expected 226,000 initial claims for last week. The four-week moving average of initial claims edged higher to 221,750 from 221,000.
In the week ended August 2, the total number of unemployment insurance beneficiaries – also known as “continuing claims” – was 1.953 million (+4.8% y/y), down slightly from a downwardly revised 1.968 million in the prior week (previously 1.974 million). The four-week moving average was little changed at 1.951 million. While new claims have been well contained recently, continuing claims have taken a marked step up since April, indicating that while the pace of layoffs has not increased meaningfully, hiring has slowed. Consequently, those unemployed are having more difficulty finding new jobs and hence are receiving unemployment benefits for longer.
In the week ending August 2, the insured rate of unemployment (the number of beneficiaries as a percent of covered employment) was 1.3% for the tenth straight week. It has increased from 1.2% in early 2023 and a low of 1.0% last reached in November 2022.
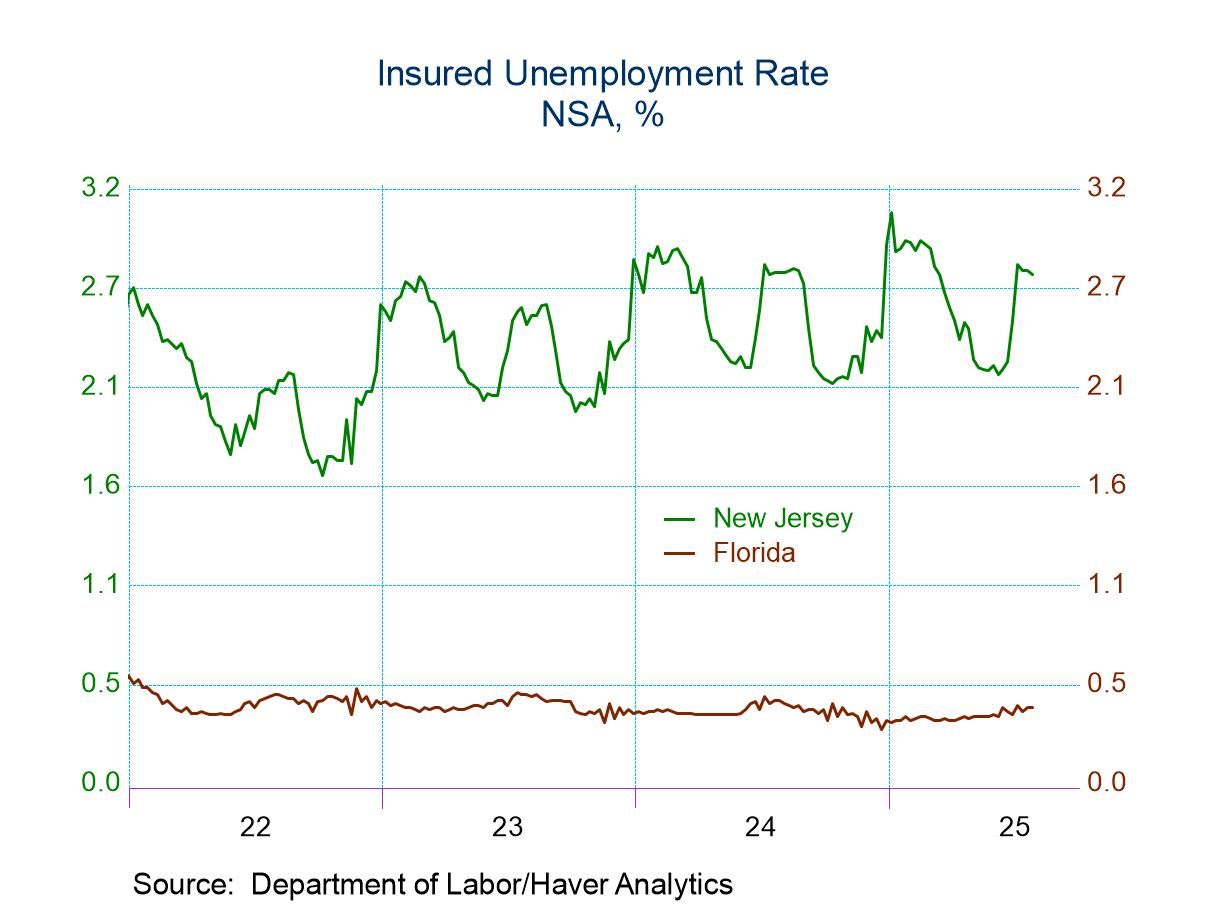
The insured unemployment rate varied greatly across individual states and territories. In the week ended July 26, the highest unemployment rates were in New Jersey (2.74%), Puerto Rico (2.61%), Rhode Island (2.52%), California (2.21%), Minnesota (2.17%) and Massachusetts (2.15%). The lowest were in South Dakota (0.31%), Florida (0.41%), North Carolina (0.48%), Alabama (0.50%), Kentucky (0.54%) and Virginia (0.55%). Rates in other notable states include Pennsylvania (1.90%), Illinois (1.77%), New York (1.73%), Texas (1.28%), Michigan (1.17%) and Ohio (0.92%). These state data are not seasonally adjusted.
Data on weekly unemployment claims are from the Department of Labor itself, not the Bureau of Labor Statistics. They begin in 1967 and are contained in Haver’s WEEKLY database and summarized monthly in USECON. Data for individual states are in REGIONW back to December 1986. The expectations figure is from the Action Economics Forecast Survey in the AS1REPNA database.

Sandy Batten
AuthorMore in Author Profile »Sandy Batten has more than 30 years of experience analyzing industrial economies and financial markets and a wide range of experience across the financial services sector, government, and academia. Before joining Haver Analytics, Sandy was a Vice President and Senior Economist at Citibank; Senior Credit Market Analyst at CDC Investment Management, Managing Director at Bear Stearns, and Executive Director at JPMorgan. In 2008, Sandy was named the most accurate US forecaster by the National Association for Business Economics. He is a member of the New York Forecasters Club, NABE, and the American Economic Association. Prior to his time in the financial services sector, Sandy was a Research Officer at the Federal Reserve Bank of St. Louis, Senior Staff Economist on the President’s Council of Economic Advisors, Deputy Assistant Secretary for Economic Policy at the US Treasury, and Economist at the International Monetary Fund. Sandy has taught economics at St. Louis University, Denison University, and Muskingun College. He has published numerous peer-reviewed articles in a wide range of academic publications. He has a B.A. in economics from the University of Richmond and a M.A. and Ph.D. in economics from The Ohio State University.
More Economy in Brief
 Asia
Asia

