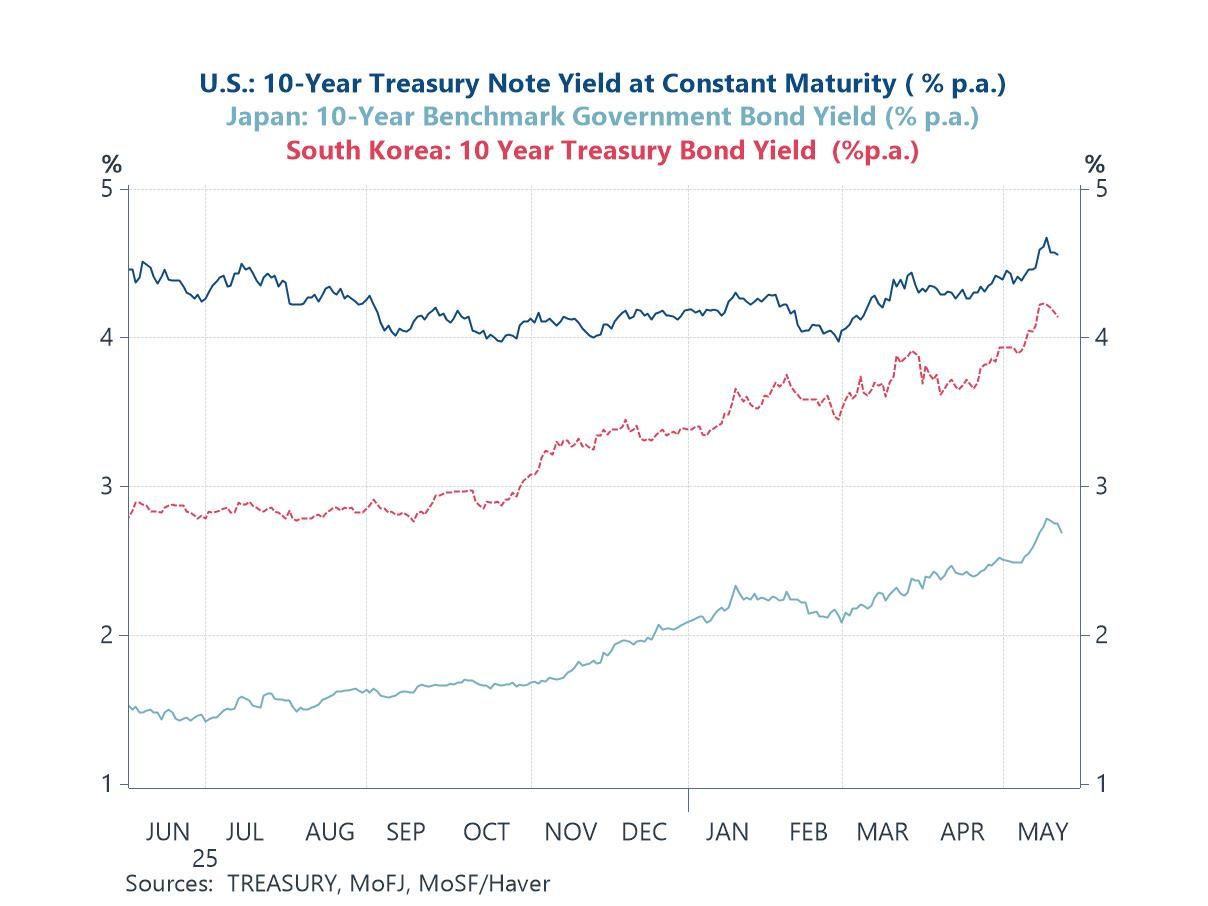
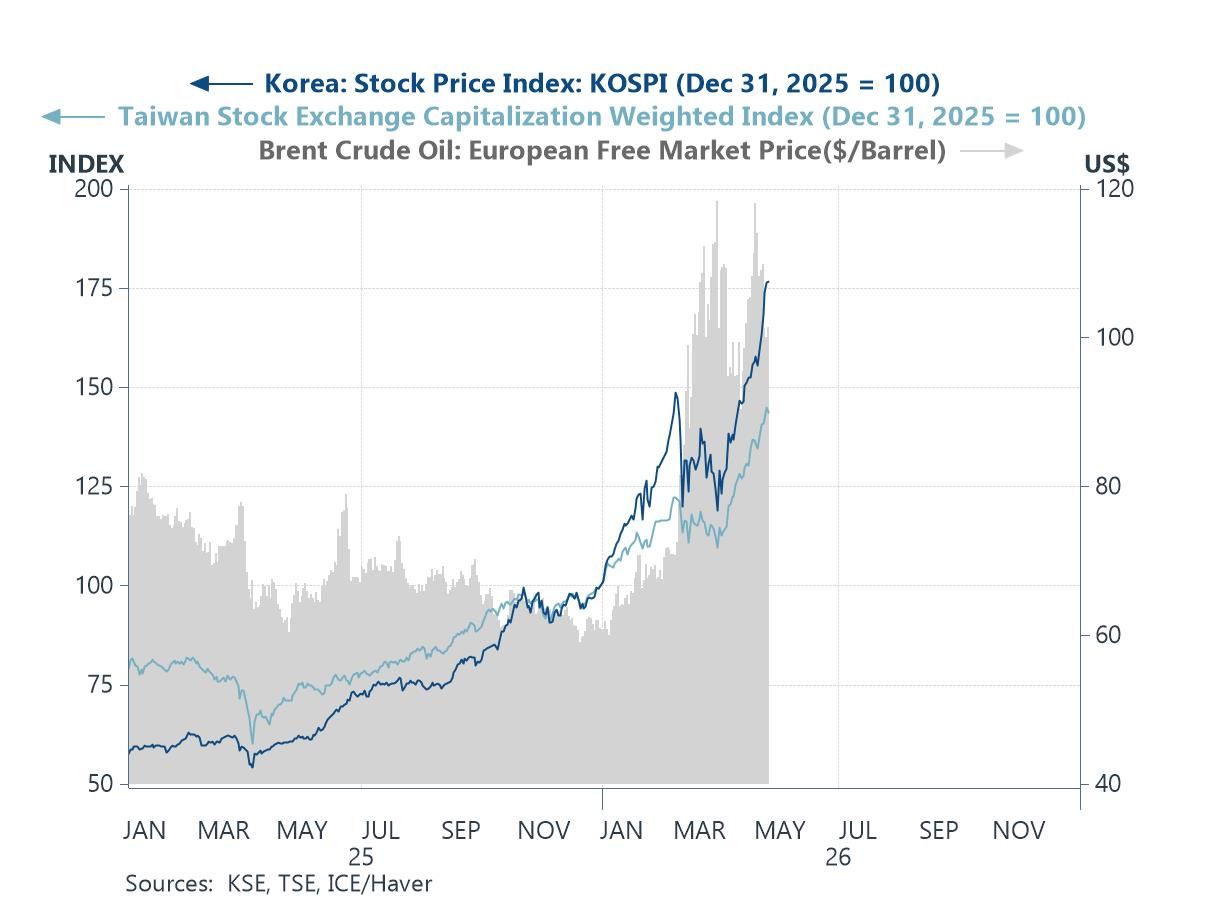
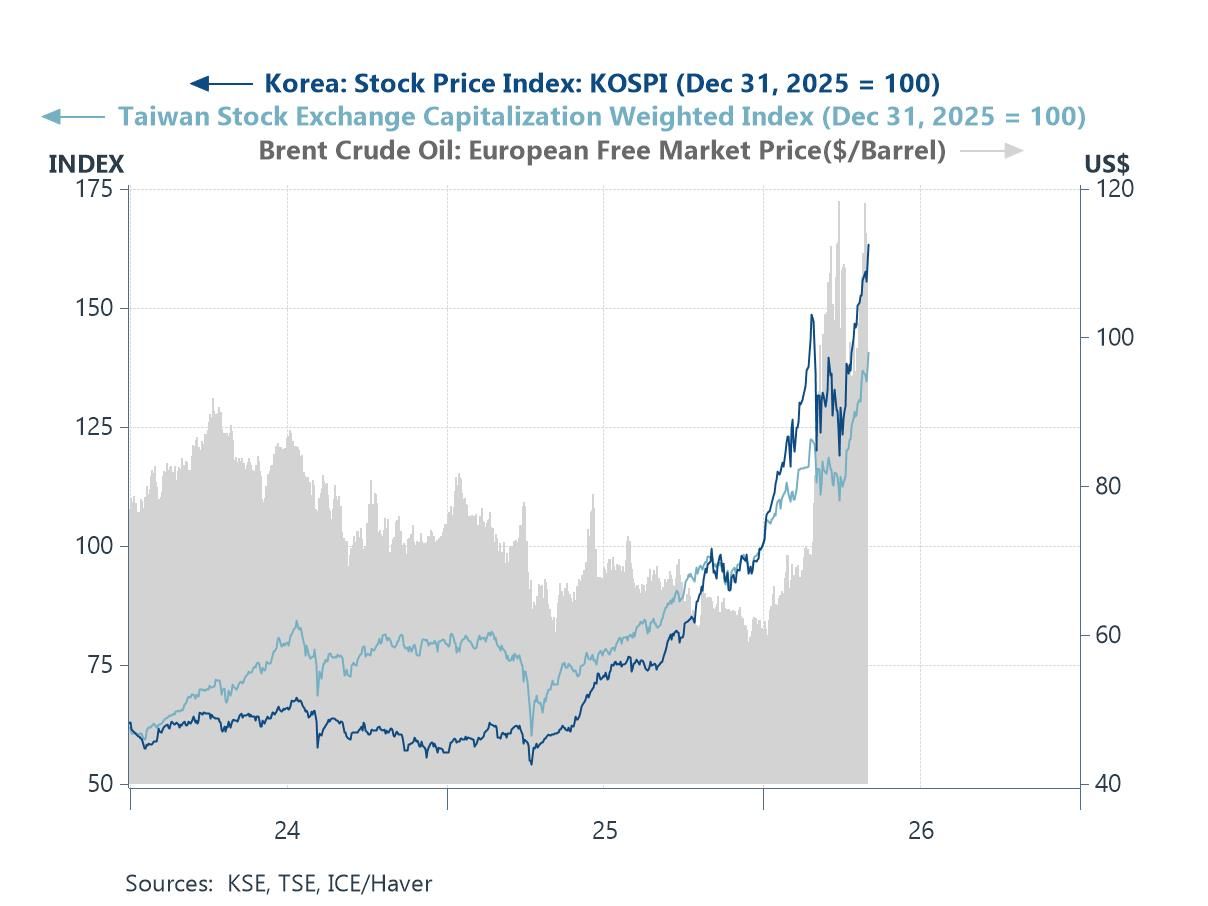
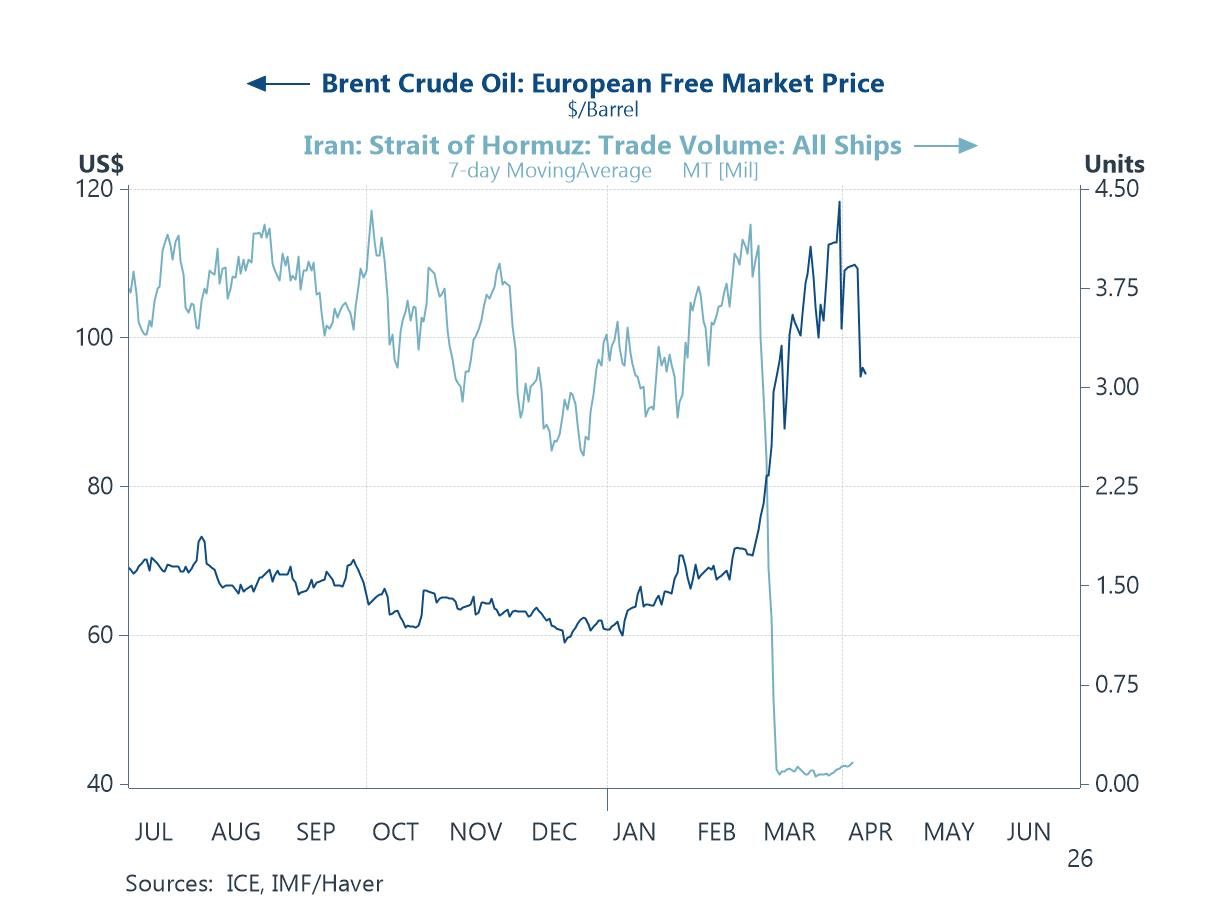
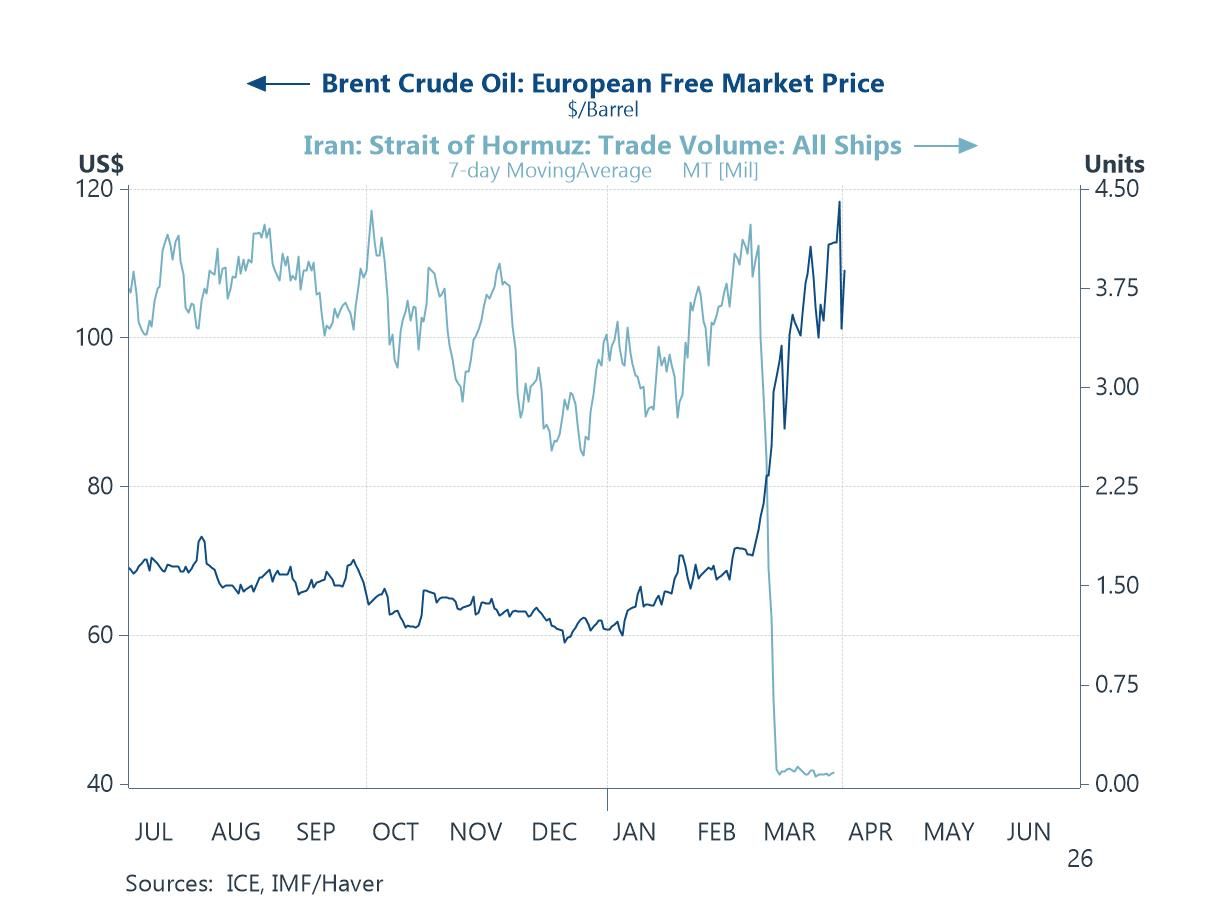
Haver Analytics
Haver Analytics

Introducing

Tian Yong Woon

Tian Yong joined Haver Analytics as an Economist in 2023. Previously, Tian Yong worked as an Economist with Deutsche Bank, covering Emerging Asian economies while also writing on thematic issues within the broader Asia region. Prior to his work with Deutsche Bank, he worked as an Economic Analyst with the International Monetary Fund, where he contributed to Article IV consultations with Singapore and Malaysia, and to the regular surveillance of financial stability issues in the Asia Pacific region.

Tian Yong holds a Master of Science in Quantitative Finance from the Singapore Management University, and a Bachelor of Science in Banking and Finance from the University of London.

Publications by Tian Yong Woon

  • This week, we look at key economic and trade developments across Asia amid persistent geopolitical tensions and shifting policies. US-India trade talks, once expected to produce a quick deal, have stalled. India now faces up to 50% additional US tariffs—half from revised reciprocal rates and half linked to its continued imports of Russian oil, which make up about 35% of its crude supply (chart 1). Around 20% of India’s exports go to the US, leaving its economy exposed to the impact of these measures. In China, a flurry of economic data releases for July will provide a comprehensive update. Despite resilient numbers of late, doubts persist about the sustainability of growth. Recent retail sales gains have been partly fuelled by a government subsidy program, which is likely a one-off, while the property market continues its multi-year decline. Export growth has endured (chart 2), but largely supported by importers’ front-loading ahead of tariffs,an effect that’s likely to be temporary. The US-China tariff pause may be extended, though talks remain ongoing, and risks of renewed tensions persist. Meanwhile, China’s trade surplus continues to expand as exports shift toward Africa, Southeast Asia, and Europe (chart 3).

    On the region’s growth backdrop, Japan’s preliminary Q2 GDP reading and final Q2 figures from Taiwan, Hong Kong, and Malaysia are due. Taiwan’s preliminary Q2 GDP shined, boosted by AI-driven exports (chart 4), while Hong Kong and Malaysia have been treading water. Japan has faced export headwinds from US tariffs, particularly in autos, though recent US-Japan and US-Korea deals reducing auto tariffs may support future growth (chart 5). Monetary policy watchers will focus on the Reserve Bank of Australia, expected to cut rates but signal an end to easing, and the Bank of Thailand, likely to cut rates amid deflation risks (chart 6).

    The US-India furore The trajectory of US-India trade talks has not unfolded as initially expected. At one point, these negotiations were considered among the most likely to yield an early deal. However, that has not materialized. In fact, India now appears to be in a potentially worse position than it was around its Liberation Day period, as it faces the prospect of up to 50% in additional US tariffs. Of that, 25% stems from the revised reciprocal tariff rate from the US, while the remaining 25% is linked to India’s continued purchases of Russian oil. India has thus found itself in a bind: on the one hand, it is under pressure to reduce imports of Russian oil—which have grown about 35% of its total crude oil imports, as shown in chart 1—while on the other, its exports to the US, which now make up roughly 20% of its total exports, could be seriously harmed by US tariff measures.

  • This week, we examine the latest wave of trade developments across Asia as the US unveiled a full list of its modified reciprocal tariff rates, set to take effect on August 7. As anticipated, many of the updated rates are now lower than the original tariffs, with Cambodia and Vietnam seeing the sharpest reductions (chart 1). However, from peak tariff levels, China stands out—continuing to benefit from a 10% pause rate, down from triple-digit highs.

    South Korea secured a deal just before the deadline, lowering its tariff from 25% to 15%. The new rate also applies to auto exports, offering relief to Korean automakers (chart 2). Thailand and Cambodia followed with US trade agreements after agreeing to an unconditional ceasefire following earlier military clashes. Their US-imposed tariffs dropped from 36% to 19%, highlighting how US trade policy can intersect with geopolitical interests and, in this case, may help reduce trade uncertainty (chart 3).

    Malaysia, a key mediator in the ceasefire, also finalized a trade deal, reducing its tariff rate to 19% and gaining exemptions on key exports such as semiconductors (chart 4). Turning to Japan, while its US trade deal helped avert immediate tensions, the vague terms and a headline $550 billion investment—mostly in the form of loans—leave room for future friction (chart 5). China, however, remains a wildcard. Talks to extend its tariff pause are ongoing, but failure could see a return to extreme tariff levels (chart 6). Meanwhile, tech tensions linger, despite eased restrictions on Nvidia AI chip exports.

    Latest US tariff developments We gained further clarity on the new reciprocal tariff rates announced by the US administration last week, as the White House released a full list of the modified rates on Thursday. It also announced that the new rates will take effect on August 7, giving partner countries a bit more time to negotiate new terms. Overall, as earlier indications suggested, Trump’s post-pause tariff rates—regardless of whether trade deals were secured—have often ended up lower than the original rates, as shown in chart 1. The largest reductions from original tariff levels have so far come from Cambodia and Vietnam. However, when looking at the steepest reductions from peak tariff rates, China stands out. It continues to benefit from a 10% tariff pause—down sharply from the triple-digit rates imposed at the height of US-China trade tensions earlier this year. On the flipside, a handful of economies—including New Zealand, the Philippines, and Brunei—are now facing modified tariff rates that are actually higher than their original Liberation Day levels. Notably, the Philippines ended up in this group despite having secured a trade deal with the US.

  • This week, we examine a series of major US trade and tariff developments since early July. The US has expanded its network of bilateral trade deals, including deals with Indonesia and the Philippines, both securing tariff rates of 19%. Meanwhile, former President Trump has seemingly raised the general tariff floor from 10% to 15%, potentially affecting countries like Australia, New Zealand, and Singapore (see chart 1). India, once expected to be among the first to reach a deal, has yet to finalize an agreement ahead of the August 1 deadline. Attention remains on China’s suspected use of transshipments through third countries to circumvent tariffs. One possible, though inconclusive, indicator is the decline in China’s direct exports to the US alongside stable overall export levels—suggesting either the use of transshipment routes or a broader redirection of exports to other markets (see chart 2).

    Japan also recently struck a significant deal with the US, reducing its reciprocal tariff from 24% to 15%. This announcement boosted Japanese equities and the yen (see chart 3). However, Japan’s auto exports to the US continue to decline, with firms absorbing tariff-related costs to maintain competitiveness (see chart 4). Despite political uncertainty following the ruling LDP’s losses in recent upper house elections, Japanese markets have remained resilient (see chart 5). As the Bank of Japan prepares to announce its next rate decision, real wages have posted their sharpest decline in two years, while household spending—driven by car purchases—has surged (see chart 6).

    Latest US tariff developments Several significant US trade developments have occurred since early July. Notably, the number of bilateral trade deals secured by the US has increased. For instance, Indonesia reached an agreement that reduced tariffs from 32% to 19%, while the Philippines avoided a previously threatened 20% rate, settling instead at 19%. Meanwhile, former President Trump has reportedly raised the tariff floor from 10% to 15%. This suggests that countries previously facing the 10% rate—such as Australia, New Zealand, and Singapore (which runs a trade surplus with the US)—will now be subject to higher duties, as illustrated in chart 1. In contrast, India, once expected to be among the first to reach a deal, has yet to produce a substantive agreement as the August 1 deadline approaches.

  • This week, we look at the latest US trade developments and their implications for Asia, as President Trump unveiled new tariff rates on 14 countries (chart 1). Though some rates were lower and implementation delayed to August 1, the move signals the US tariff pause is ending and deepens investor uncertainty in Asia. Market sentiment has weakened, reflecting both renewed policy risks and stalled trade negotiations in the region (chart 2).

    Vietnam stands out as a rare exception, having secured a deal with the US that reduced its tariff rate from 46% to 20%. However, the agreement includes a 40% tariff on “transshipments,” aimed at curbing indirect exports from third countries, such as China. In return, the US has gained tariff-free access to Vietnamese markets—an offsetting benefit for American firms. Nonetheless, the 20% rate remains high and could raise costs for US consumers if passed through supply chains (chart 3). Japan, by contrast, faces a more delicate balancing act. A 25% tariff was confirmed, while pressure persists over access for US agricultural exports—particularly rice (chart 4). Domestic sensitivities remain elevated amid a rice shortage and looming upper house elections, limiting Tokyo’s room to manoeuvre.

    Regional central banks are responding cautiously. The Reserve Bank of Australia held rates steady, defying expectations of a cut and citing a need for more information (chart 5). Rate decisions from South Korea, New Zealand, and Malaysia are due this week, with South Korea’s central bank seen likely to hold, amid rising home prices and mortgage growth (chart 6).

    Latest US tariff developments As previously signalled, US President Trump on Monday unveiled a new round of tariff rates targeting 14 countries, confirming initial fears that the US would move forward with reciprocal tariffs following its 90-day pause. While investor concerns—renewed late last week—have begun to materialize, there are two modest sources of relief. First, as shown in chart 1, many of the newly announced US tariff rates are actually lower than those initially unveiled on “Liberation Day,” April 2. Second, President Trump has delayed the effective date of the tariffs to August 1, offering a temporary window for countries that have not yet done so to negotiate trade deals with the US. However, while the extension allows more time for dialogue, it does not constitute a formal delay in implementation—at least for now. That said, progress in trade negotiations with the US remains limited across most Asian economies. In some cases, such as Japan, talks may have even come to an impasse—this will be explored further in subsequent sections. Vietnam, however, stands out as an exception, having secured a trade agreement with the US late last week; this development will also be discussed in more detail later on.

  • This week, we look at the state of US–Asia trade talks as the July 9 expiration of the US’ 90-day tariff pause approaches. Despite early activity, few deals have been finalized. So far, the US has reached only a limited agreement with the UK and rolled back mutual tariffs with China, alongside a framework on rare earth exports. Much of the action has focused on undoing previous measures rather than making new advances. Still, Asian markets have shown signs of stability (chart 1), though volatility may return as the tariff deadline nears. The outcome remains uncertain. President Trump has indicated flexibility on the deadline, and Treasury Secretary Bessent has suggested more deals may come only by Labor Day in September. Meanwhile, US effective tariff rates have already risen (chart 2), though inflation impacts have been muted, likely due in part to importers absorbing costs.

    Among Asian partners, India shows the most near-term promise, with ongoing talks focused on mutual market access, though barriers remain in agriculture and dairy (chart 3). Japan has made no breakthroughs despite pressing concerns over auto and metal tariffs—sectors key to exports and GVA (chart 4). South Korea, just emerging from political transition, is only beginning substantive talks (chart 5). In Southeast Asia, Indonesia and Vietnam are among the most likely to reach agreements. Both face steep tariff hikes if talks fail, particularly Vietnam with a potential 46% rate. Indonesia has submitted proposals, while Vietnam remains optimistic. Thailand, still early in talks and politically distracted, is unlikely to meet the July 9 deadline (chart 6).

    US trade deals so far this year We have already reached the end of the first half of the year, and the US’ flurry of trade-related actions has so far yielded tangible outcomes with only a few countries. To date, the US has concluded a limited trade deal with the UK and reached an agreement with China to roll back many of the tariffs both sides imposed earlier this year. More recently, the US and China also established a framework concerning China’s rare earth export controls. That said, much of the world remains without new US trade deals. Most of the developments thus far have focused on partially reversing measures implemented earlier this year, rather than advancing beyond the pre-inauguration day baseline. Still, a measure of market calm has returned—at least in Asia—as reflected in recent rallies across some of the region’s equity indexes (chart 1). However, renewed volatility may lie ahead as the July 9 expiration of the US’ 90-day pause on reciprocal tariffs approaches.

  • In this week’s letter, we analyse the performance of Asian currencies so far this year. While US dollar weakness has broadly supported regional currencies, economy-specific factors have driven significant divergence (chart 1). Advanced Asian currencies—such as the Taiwan dollar, Japanese yen, South Korean won, and Singapore dollar—have outperformed, not simply due to their advanced status but because of unique domestic drivers. Conversely, currencies like the Vietnamese dong, Indian rupee, Indonesian rupiah, and Chinese yuan have lagged, reflecting country-specific challenges.

    Trade exposure has been a key influence on currency movements. The wave of US tariffs has spotlighted economies’ links to the US, making export-reliant nations more vulnerable to downside risks (chart 2). Vietnam’s high exposure to US exports helps explain its currency weakness, while India remains relatively insulated overall despite significant US trade ties. Markets remain cautious as the US 90-day tariff pause nears expiry.

    Investor growth outlooks have also shaped currency trends. Taiwan’s 2025 GDP forecasts were upgraded after strong Q1 data, helping explain some currency divergence (chart 3), though growth alone does not fully determine currency strength. Monetary policy developments matter too. Most Asian central banks have held or cut rates this year, except the Bank of Japan, which has tightened policy, supporting the yen (chart 4). India’s rate cuts narrowed its interest rate differentials, pressuring the rupee, while Vietnam and Taiwan saw currency moves despite steady policies, underscoring other influences.

    Policy uncertainty and geopolitical risks have also remained critical. South Korea’s political instability eased after recent elections, boosting sentiment (chart 5). India has faced challenges from Middle East tensions and resulting energy price pressures. Our Asia Currency Scorecard (chart 6) summarises these dynamics: the Taiwan dollar leads on growth optimism, the Japanese yen benefits from tighter monetary policy, and the South Korean won from reduced uncertainty. In contrast, the Vietnamese dong struggles with trade exposure, the Indian rupee is weighed down by rate cuts and geopolitical risks, and the Indonesian rupiah faces pressure from past policy uncertainty and recent easing.

    Asia’s currency performance The performance of Asian currencies so far this year has been mixed. A common tailwind has been the weakness of the US dollar, which has provided some support to regional currencies. However, individual economy-specific factors have driven significant divergence in overall performance. On balance, advanced Asian currencies—such as the Taiwan dollar, Japanese yen, South Korean won, and Singapore dollar—have led the pack, recording the strongest year-to-date gains on a nominal effective exchange rate (NEER) basis, as shown in chart 1. That said, their outperformance is not due to their status as advanced economies, but rather to distinct, economy-specific factors, which we will explore further. Conversely, currencies such as the Vietnamese dong, Indian rupee, Indonesian rupiah, and Chinese yuan have been among the weakest performers in NEER terms. As with the top performers, their relative weakness also stems from country-specific factors.

  • This week, we focus on India’s economic developments, which continue to demonstrate resilience amid persistent global headwinds. In Q1, GDP growth accelerated to its fastest pace in a year, surpassing expectations. Services remained the primary growth driver, bolstered by gains in construction and manufacturing (chart 1). Despite widespread global downgrades, the World Bank still expects India to be the fastest-growing major economy in 2025.

    While services have long underpinned India’s growth, the country is gradually pivoting toward manufacturing, including higher-end, IP-intensive sectors. Progress has been made—such as attracting iPhone production—but manufacturing has yet to significantly shift the composition of GDP, which remains heavily weighted toward services (chart 2). India’s rising role as a “China Plus One” destination has enhanced its global appeal, though the shift has drawn criticism from former US President Trump, who favours bringing manufacturing back to the US.

    India’s strategic ties with both the US and China require a careful balancing act. The US is India’s top export destination, with major exports including pharmaceuticals, jewellery, and smartphones (chart 3). At the same time, India relies heavily on China for critical inputs such as Key Starting Materials (KSMs) and Active Pharmaceutical Ingredients (APIs), both vital to its pharmaceutical sector (chart 4). As a result, India is seeking to deepen trade relations with the US while avoiding actions that might provoke China. Trade negotiations with the US are reportedly progressing, with an interim deal possible ahead of Trump’s July 9 tariff deadline.

    On the monetary front, the Reserve Bank of India cut policy rates by 50 bps in June and announced a phased 100 bps reduction in the Cash Reserve Ratio (CRR), in response to falling inflation and risks of weaker demand (chart 5). As a partial consequence, the rupee has underperformed its Asian peers—though the primary pressures stem from persistent foreign outflows and narrower interest rate differentials (chart 6).

    India’s economic developments India’s economy grew faster than expected in calendar Q1, with growth accelerating to 7.4% y/y—exceeding economists’ expectations and marking the fastest growth rate in a year. By sector, and based on gross value added at basic prices, services remained the primary growth driver, as shown in chart 1. However, contributions from the construction and manufacturing sectors also improved. More broadly, many investors and economists continue to view India as one of the few economies expected to deliver robust growth this year. This remains a rare distinction, given the growth-dampening effects of US tariffs and the associated retaliatory actions. That said, recent US-China breakthroughs on trade-related agreements have eased much of this latent risk.

    Despite enacting widespread forecast downgrades in its latest projections just last week, the World Bank still expects India to post the fastest growth among major economies in 2025. Nonetheless, India’s outlook has been somewhat dampened by weaker export potential and slowing investment amid rising global trade barriers. Similarly, panellists in our recent Blue Chip Economic Indicators survey continued to rank India as the top-growing major economy among those covered.

  • This week, we focus on critical minerals, which have moved into the spotlight following China’s recent restrictions on rare earth exports. The move triggered widespread supply chain disruptions and renewed attention to an issue that had long flown under the radar. A closer look reveals that just a handful of countries dominate global production—chief among them, China, as shown in chart 1. This concentration highlights the growing geopolitical and economic importance of mineral-rich nations in supporting key industries such as automotive, aerospace, and defence. The implications for national security are significant.

    China’s influence goes well beyond raw material reserves. It has also positioned itself as a leading refiner of critical minerals such as copper and nickel—even though it is not the top producer of the raw ores (see chart 2). In the case of rare earths, China has become a key supplier to Western economies, including the United States and the Euro area (chart 3). Its recent export restrictions on rare earth elements (REE) are a direct response to ongoing trade actions and have already triggered disruptions across key industries. Ford in the US and Suzuki in Japan, for example, have reportedly paused production due to shortages of these inputs. Meanwhile, non-US automakers—particularly in Japan—face additional pressure from US auto tariffs. These have forced firms to slash export prices (chart 4), squeezing profit margins and weakening overall financial performance.

    But not all signs point to prolonged disruption. There is a glimmer of hope. In Europe, negotiations with China suggest a possible easing of REE-related disruptions, although any concrete relief will likely depend on broader trade discussions. One likely sticking point is the surge in Chinese EV exports to Europe, which has saturated local markets and drawn import tariffs (chart 5). Meanwhile, US–China trade talks resume in London this week, with rare earths a central topic. Markets and policymakers alike are watching closely, hoping for signs of de-escalation. That said, the impact of these mutually imposed trade actions is already visible, as shown in chart 6. While negotiations continue, disruptions remain an active threat to supply chains, industrial output, and economic stability.

    Global critical minerals production While headlines are often dominated by breakthroughs in high-end and essential technologies, what tends to be overlooked are the raw materials that make those innovations possible. These foundational inputs are known as critical minerals—so named because of their vital role in enabling advanced technologies and their often-fragile supply chains. Critical minerals include rare earth elements (REEs)—a group of 17 chemically similar elements essential to high-tech, clean energy, and defence applications. Also considered critical are minerals used in various battery chemistries, including those for electric vehicles (EVs) and associated infrastructure. These include nickel, cobalt, graphite, and copper. Additionally, elements like gallium and germanium are indispensable for semiconductors, fibre optics, and other high-tech systems.

    In their raw form, the global production of critical minerals is highly concentrated. As shown in chart 1, only a handful of economies account for the majority of the world's production—and this pattern repeats across most critical minerals. Countries such as China, Russia, South Africa, and the Democratic Republic of the Congo consistently emerge as dominant producers across several of these materials. While production dominance alone may not always present a risk, it becomes strategically significant when geopolitical tensions interfere with trade flows. This issue has come into sharper focus as China’s central role in global mineral supply chains is increasingly scrutinized—especially in the wake of renewed US-China trade tensions following President Trump’s second term in office.

  • This week, we examine the deepening divisions between the US and China, which are affecting not just trade but also investment flows, monetary policy, and technological development.

    On the trade front, China has shifted from modest trade shares with its partners (chart 1) to capturing significantly larger shares across Asia, Africa, and Latin America (chart 2), while US progress in these regions has been more subdued. This signals a clear bifurcation, with China forging its own trading blocs, often at the expense of US market share. However, economies like Vietnam have managed to deepen trade ties with both countries (chart 3).

    China’s efforts to strengthen relationships extend beyond trade to direct investment abroad (chart 4) and loan financing, particularly in Africa, where it has become a major investor in new projects. This has allowed China to cement a foothold in regions where US influence is limited. The bifurcation also extends to the monetary and currency space, with China gradually reducing its US Treasury holdings while increasing its gold reserves, possibly as part of a diversification push (chart 5). Concurrently, China’s push for de-dollarisation continues, despite significant hurdles.

    Finally, US–China bifurcation is also playing out in the technological sector, where China has made significant advancements in critical areas, driven in part by substantial R&D investment over the years (chart 6). In response, US efforts to limit China’s access to key technologies may have inadvertently accelerated China’s development of its own systems and infrastructure, deepening the bifurcation further.

    Shifts in China and US trade shares While economists may differ on when the broader US–China bifurcation began, many agree that the more significant phase of decoupling was triggered in 2018, when President Trump initiated the first wave of trade restrictions and tariffs against China during his first term. Prior to these sharp policy shifts—and before Trump took office—China’s share of total trade with several major global economies remained relatively modest, generally below 20%, as shown in chart 1. Similarly, the US also maintained a relatively balanced trade share with most partners, though its trade was more concentrated with neighbouring countries such as Canada and Mexico.

  • This week, we explore a series of interconnected themes—from China’s accelerating AI ambitions to evolving geopolitical dynamics in Southeast Asia, shaped in part by the United States’ increasingly inward focus and protectionist trade measures. Despite US chip export restrictions, some—including Nvidia’s CEO—have questioned their effectiveness. Indeed, select indicators suggest that China’s AI capabilities continue to advance (chart 1), even as broader dimensions of development—beyond raw performance—reveal areas where significant progress is still needed (chart 2).

    In Indonesia, we discuss last week’s central bank rate cut, which some economists saw as necessary to support the economy amid external trade-related headwinds and reduced government spending. The move was also made possible by recent signs of rupiah stability (chart 3). In response to global trade uncertainties, Indonesia is also deepening regional ties, particularly with China—a relationship that has been strengthening even prior to this year’s US trade measures (chart 4).

    Zooming out to broader regional issues, this week’s ASEAN-related summits reflect a growing inclination to expand ties with both China and the Middle East. As such, ASEAN’s already substantial trade with China (chart 5) may be poised to grow further. At the same time, ASEAN is now exploring a collective approach in trade talks with the US—alongside ongoing bilateral efforts—potentially to stave off further tariff increases on its exports (chart 6).

    China’s AI push It has been another revealing week in US–China developments. Nvidia CEO Jensen Huang remarked that US chip export controls have not only failed but may have accelerated China’s drive for self-reliance in AI chips—particularly at the high end. Indeed, this trend appears to be playing out. China has steadily increased investment in its AI capabilities over the years, bolstered by a strategic government push that includes substantial funding. This has led to tangible progress, such as a rising number of large-scale AI systems (see chart 1). Notably, China’s advances have continued despite sustained US efforts to hinder its technological progress—many of which were introduced under previous administrations.

  • This week, we continue to monitor developments stemming from US trade actions across Asia. China’s latest monthly data reflects encouraging resilience, even as initial impacts from recent steep US tariffs become visible (chart 1). Notably, despite heightened US restrictions on chip exports, China's semiconductor imports from the US remain robust (chart 2), highlighting the careful balance US producers are maintaining between complying with regulatory constraints and preserving valuable commercial relationships. Meanwhile, in India, trade discussions with the US have remained prominent, showing early signs of meaningful progress. Economists continue to highlight India’s strong growth potential for the year (chart 3). However, a potential tension has surfaced around Apple's shift of iPhone production to India—a trend already evident in rising Indian exports (chart 4)—with US President Trump openly criticizing the move and reaffirming his commitment to boosting domestic manufacturing. In Japan, economic indicators were already signalling weakness prior to the introduction of the US “Liberation Day” tariffs (chart 5). Further anxiety stems from the risk of stalled US-Japan trade negotiations, which could potentially trigger renewed tariff hikes, exacerbating Japan’s already faltering trade performance (chart 6).

    Latest Chinese data releases China released its usual batch of monthly data today, offering a mixed set of results. While not uniformly strong, the figures showed no clear signs of the significant drag on growth that might have been expected from the initial impact of US tariffs. Industrial production outperformed expectations, rising 6.1% y/y in April (see chart 1). In contrast, retail sales and fixed asset investment growth came in below forecasts but remained in positive territory. Meanwhile, the unemployment rate edged lower, while house prices continued to decline. Overall, April’s data suggests a degree of resilience in China’s economy, despite the 145% US tariffs that took effect earlier in the month. With a 90-day pause on further tariff escalation currently in place, there may be some short-term relief—provided no new adverse developments emerge.

  • This week, we focus on US-China trade developments in light of the economies’ joint 90-day tariff pause announcement. The extent of the interim tariff cuts has surpassed investors’ expectations. As such, the cuts have understandably boosted sentiment in Chinese equity markets (chart 1), though sentiment had already been buoyed by the increasingly conciliatory tone in US-China communications leading up to the announcement. The tariff cuts are a significant reprieve for both economies. The US is likely to see reduced price pressures on producers and consumers in the near term, while China stands to gain from a temporary easing of growth drags amid ongoing domestic challenges (chart 2).

    Turning to the hard numbers, China’s April trade readings were relatively resilient, partly due to significant front-loading ahead of the prior US-imposed 145% tariffs taking effect (chart 3). As shown in chart 4, sharp declines in shipments to the US were more than offset by rising exports to Asian partners, including ASEAN, India, and Taiwan. Looking ahead, with the tariff pause beginning around mid-May, we may not see a full month’s data capturing trade responses to the earlier steep tariffs.

    Next, we turn to how investors and analysts are responding. In the May survey, our Blue Chip panellists continued to mark down growth forecasts across several economies relative to end-2024 expectations (chart 5). At the same time, they raised US inflation forecasts and lowered China inflation forecasts (chart 6). However, these forecasts are likely to see favourable revisions in future surveys—barring new adverse developments—especially in light of this week’s positive news.

    Latest US-China trade developments Financial market sentiment has remained fairly buoyant despite the flare-up in US-China trade tensions in April. Recent messaging from both sides has moved away from the fiery rhetoric of previous months, adopting a more conciliatory tone aimed at de-escalating rather than intensifying frictions. Encouragingly, developments earlier this week reinforced this shift: the US and China issued a joint statement agreeing to a 90-day cooling-off period as they pursue trade talks following a relationship “reset.” During this time, the US will reportedly reduce its 145% tariffs on Chinese imports to 30% by May 14, while China will lower its 125% tariffs on US imports to 10%. Markets have understandably reacted positively, as seen in chart 1, with this move representing a significant rollback of mutual tariffs and bringing rates much closer to their pre–“Liberation Day” baseline. As a result, the growth-dampening effects from elevated tariffs are now considerably more muted—though it is worth noting that these measures remain temporary.