 Asia
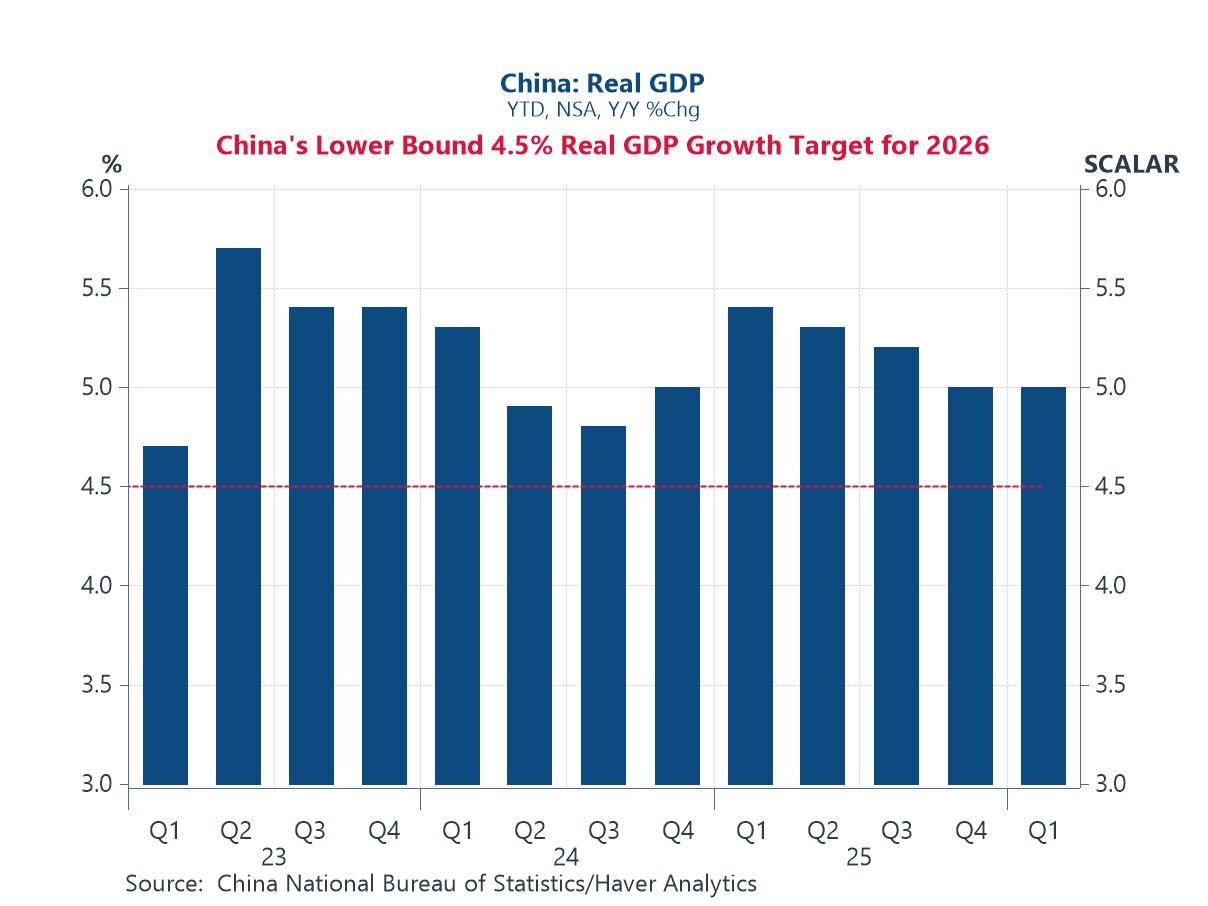
AsiaIn this week’s Letter, we take stock of the latest economic data from China, assessing what it tells us about the outlook for growth and policy. We also continue our coverage of the Middle East conflict, focusing on its broader implications for Asia through energy markets, trade routes, and regional risk sentiment.On China, while Q1 GDP data exceeded expectations, putting the economy on a firm footing to meet its annual growth target (chart 1), a closer look at the underlying monthly indicators suggests the headline resilience may be masking a more uneven underlying picture (chart 2).
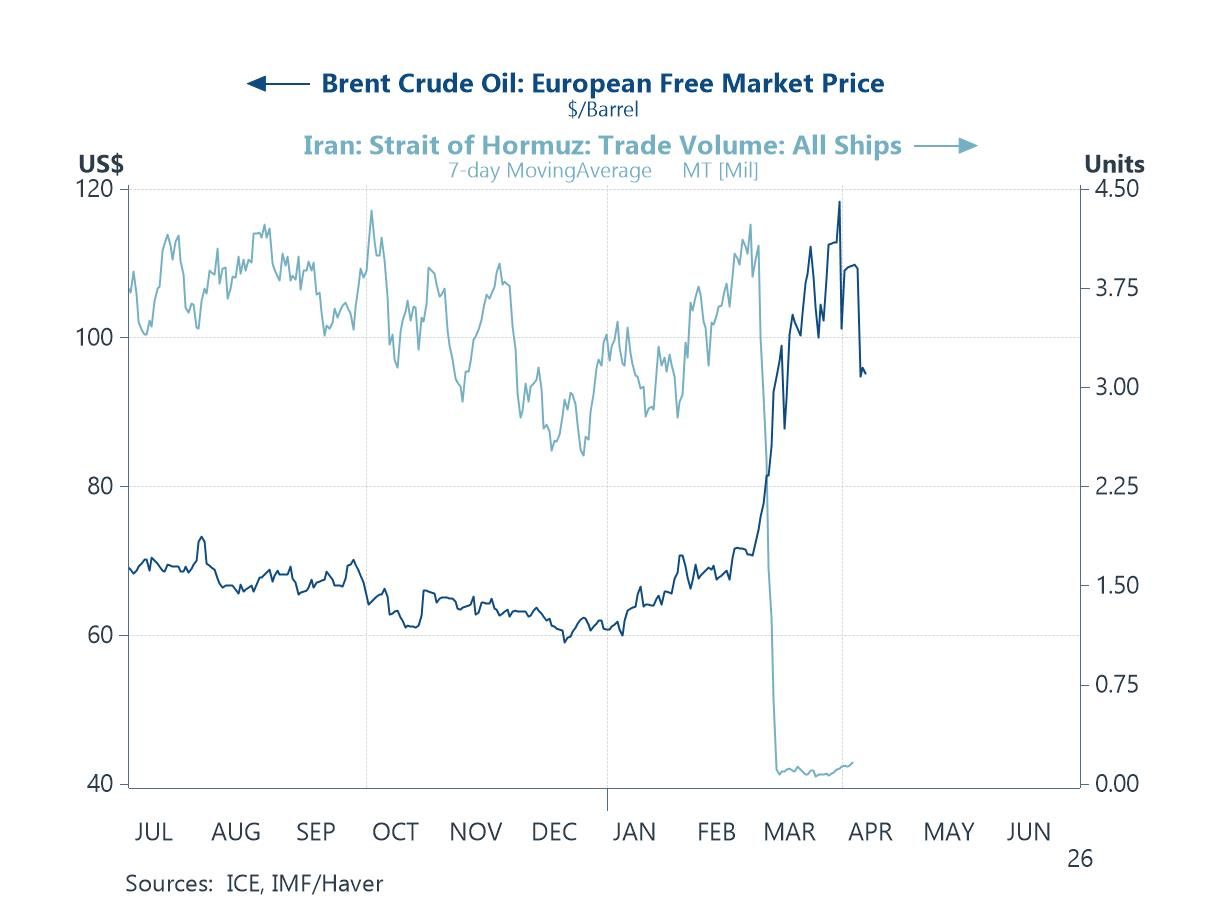
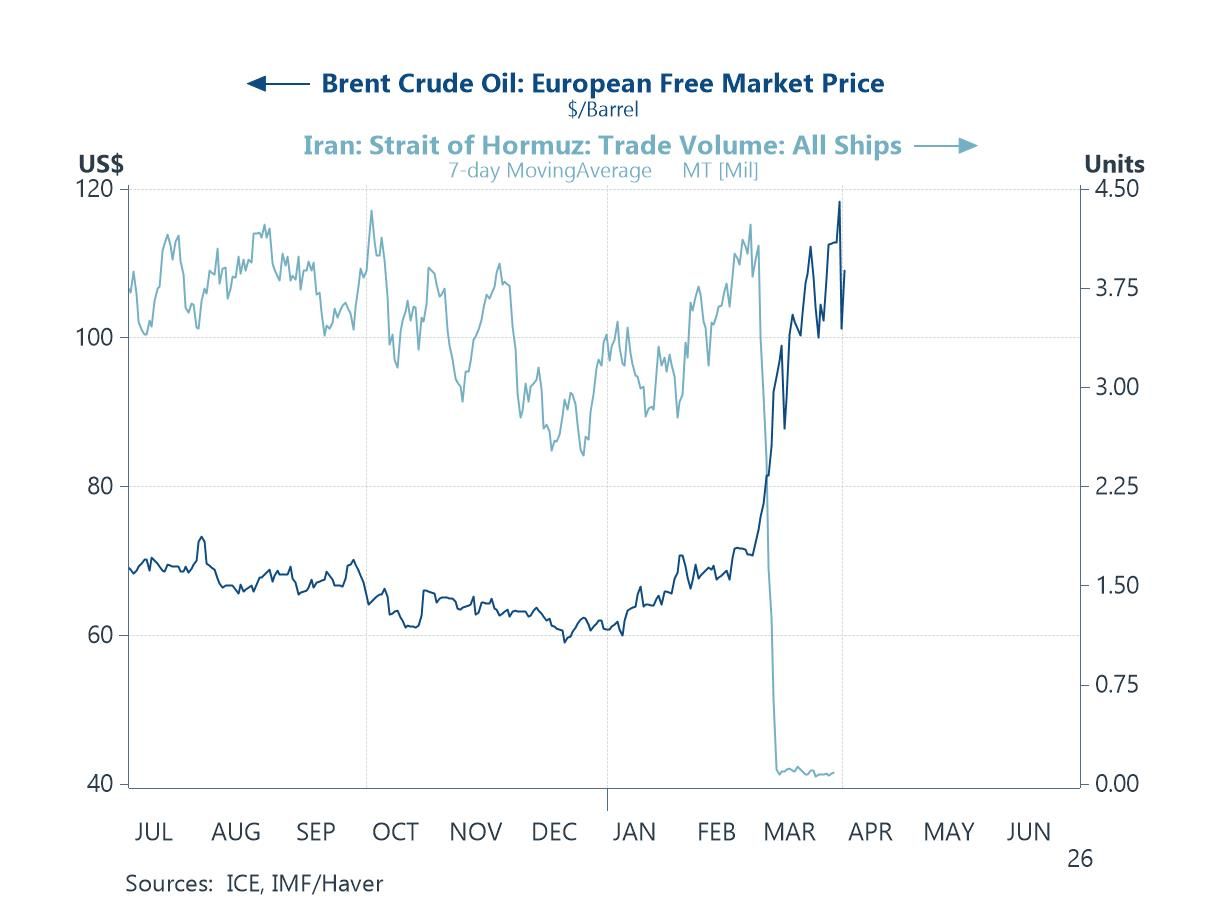
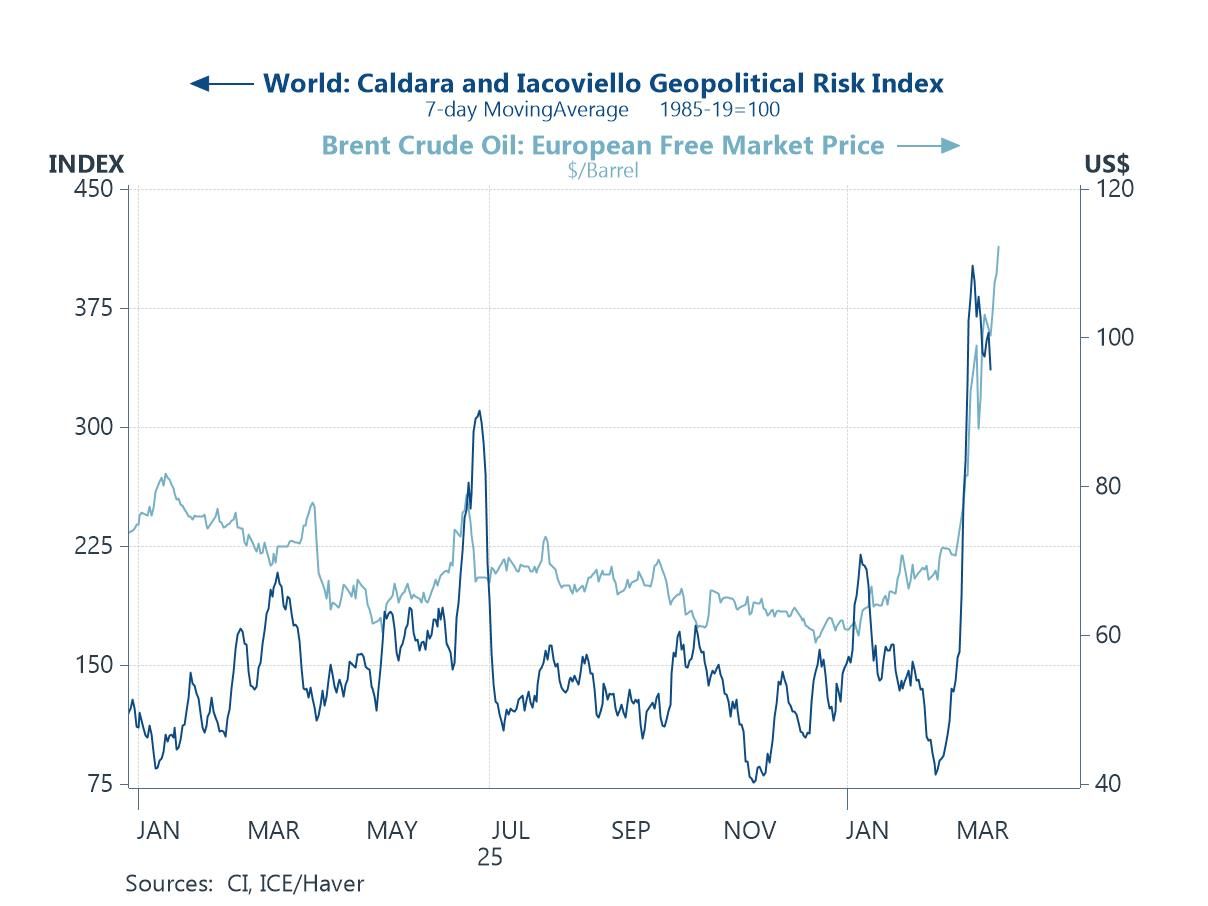
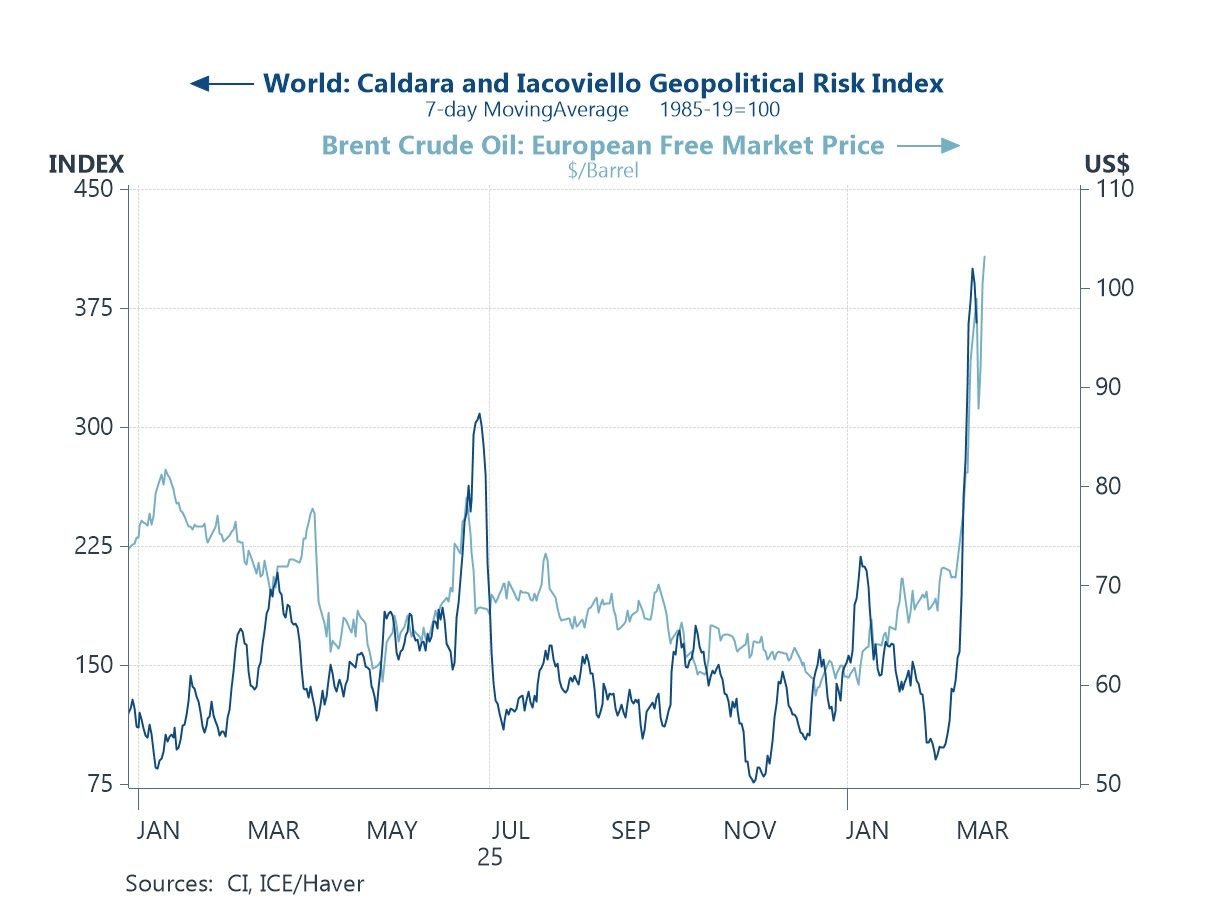
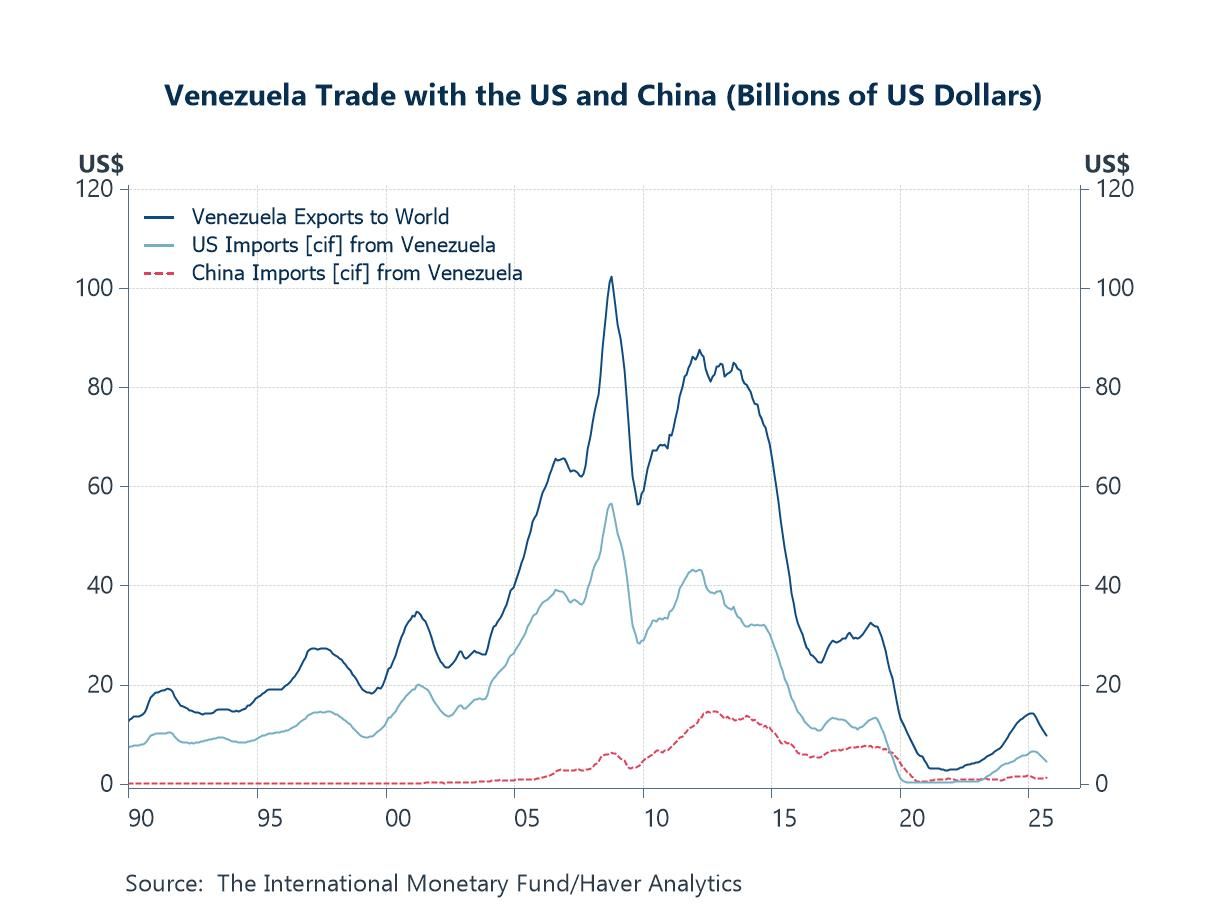
As for the Middle East, the latest round of regional March CPI prints largely confirms the initial pass-through from higher oil prices to consumer inflation. If energy prices remain elevated, second-round effects will likely become more evident in the coming months (chart 3). Turning to the Strait of Hormuz, shipping data point to a gradual recovery in flows. However, conflicting signals on the strait’s status—alongside renewed US–Iran tensions—continue to cloud the outlook for a sustained normalization in global oil supply (chart 4). In response, global players have begun to adapt, including rerouting shipments via the longer but safer Cape of Good Hope route, and exploring alternative export channels through Red Sea ports, even though these remain exposed to regional risks (chart 5). Finally, the conflict has prompted a reassessment of the global outlook. In its latest World Economic Outlook, the IMF delivered broad-based growth downgrades across economies, with only a handful of exceptions (chart 6).
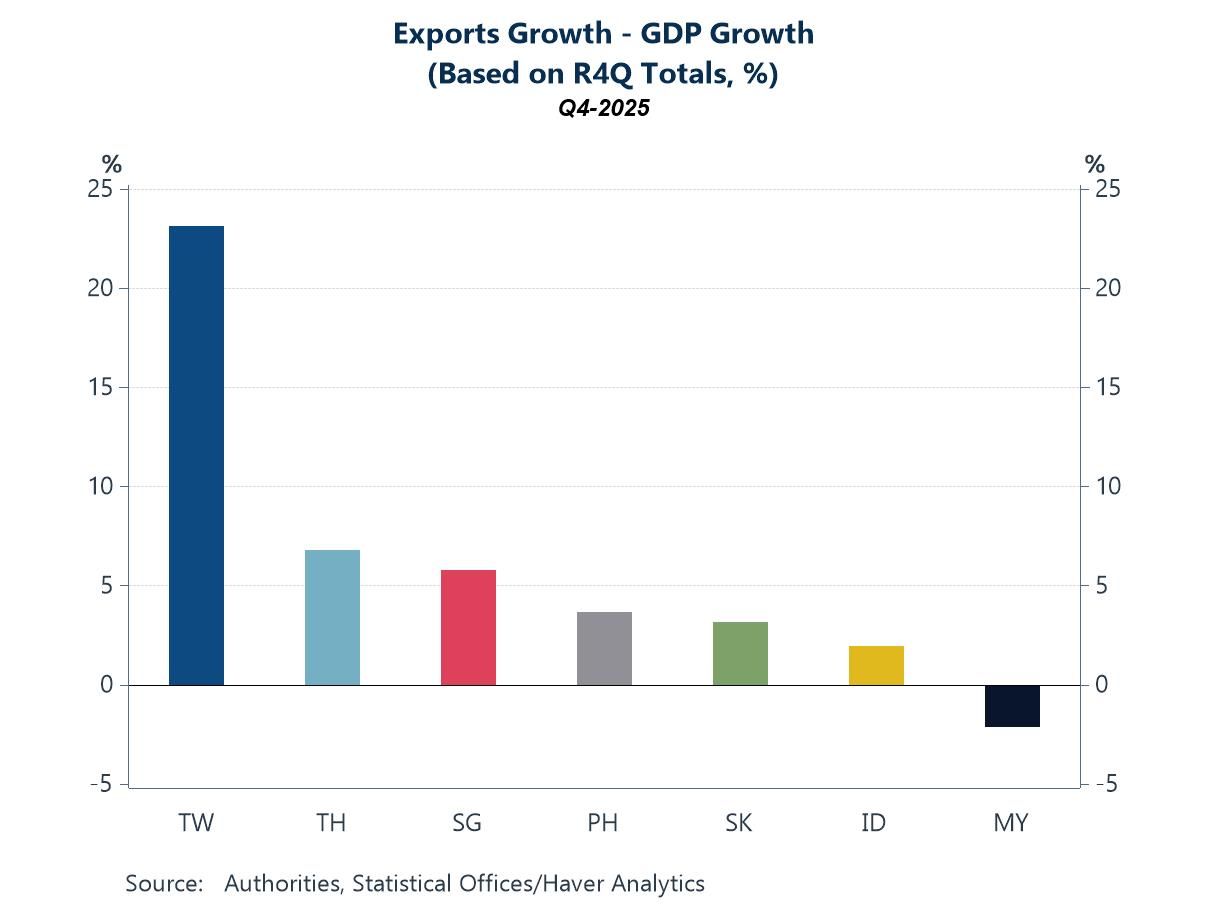
China China released a raft of data late last week, with March figures particularly pertinent as they capture the initial effects of the Middle East conflict that erupted in late February. Notably, Q1 GDP exceeded expectations, with the economy expanding 5% y/y despite incorporating March data (chart 1). This suggests China has secured a firm early footing toward its 4.5%–5% growth target for the year—a slight step down from last year’s “about 5%” goal. But a closer look at the March data reveals several nuances. On the external front, export growth slowed sharply year-to-date, falling behind import growth, thereby dragging on trade balance growth.