 Asia| Aug 19 2025
Economic Letter from Asia: BRIC by BRIC
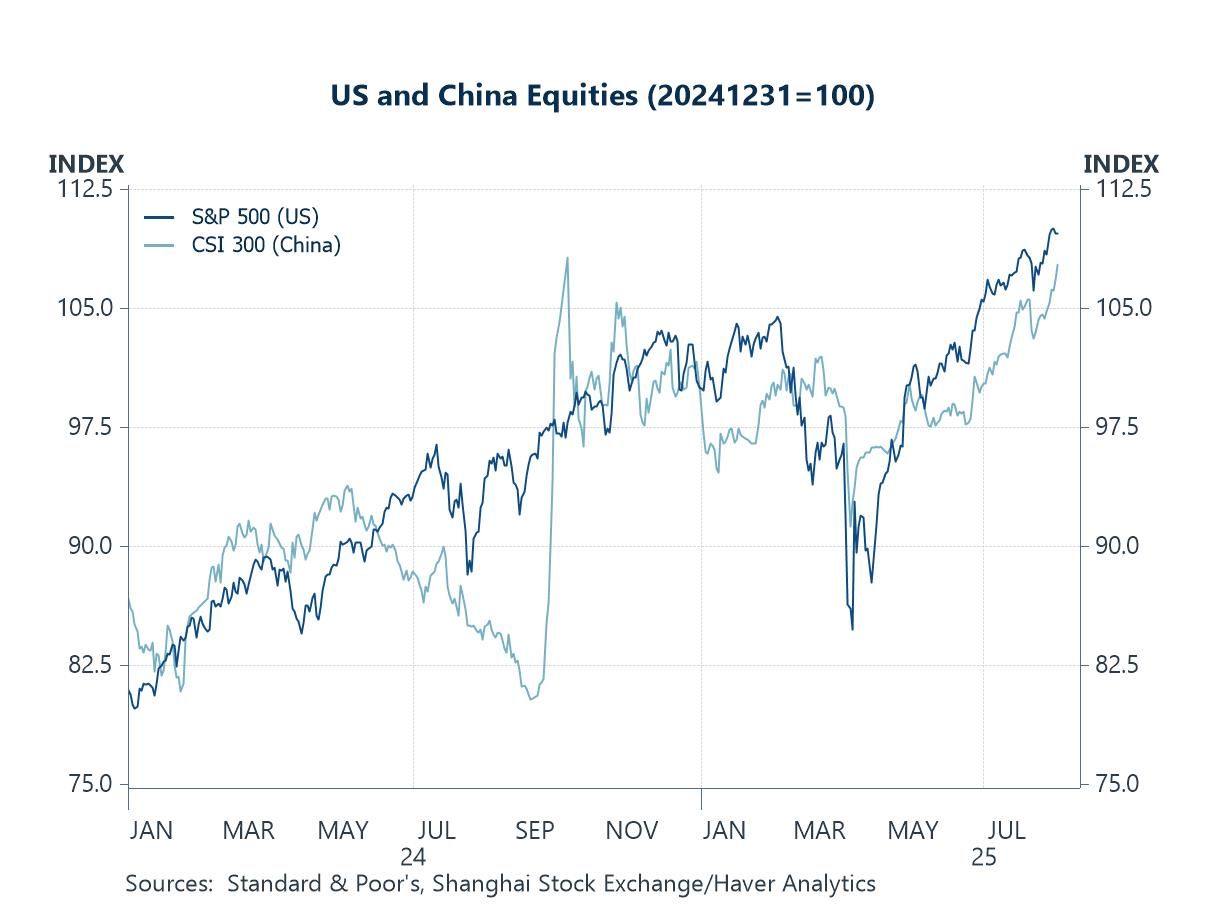
This week, we examine recent developments in US-China trade and assess the broader implications of US trade actions for the BRIC bloc—Brazil, Russia, India, and China. Last week, the US and China extended their tariff truce by 90 days, a move welcomed by equity markets (chart 1). While this pause eased fears of renewed trade tensions, it remains temporary and fragile, with no durable resolution in sight.
As for China’s economy, July data disappointed: retail sales, industrial production, and fixed-asset investment all missed expectations (chart 2). This may signal that tariffs are beginning to bite, as earlier growth drivers—such as some front-loading of imports and one-off consumption boosts like China’s durable-goods subsidy—are fading (chart 3). Newer measures, including loan-interest subsidies, may provide some interim relief. Meanwhile, the property sector remains under heavy strain, with further price and investment declines evidenced in July (chart 4).
In the broader regional context, US trade measures may inadvertently push trading partners closer together, complicating Washington’s bilateral strategy. The BRIC bloc shows tentative signs of greater alignment, though this has yet to appear in data for trade flows (chart 5). China and India, however, are warming toward one another: Foreign Minister Wang Yi’s visit to India this week—focused on the Himalayan border among other issues—suggests an improving dialogue. Separately, discussions at the national level to restart direct flights between the two countries also signal a thaw. Full economic integration remains distant, but the scale of both economies suggests significant potential if relations continue to improve (chart 6).
The US-China tariff truce Last week, the US and China announced a 90-day extension to their mutual tariff truce. Although largely expected, the move still generated further equity market gains (see chart 1). This contrasts sharply with worst-case scenarios earlier this year, when tensions peaked and Washington imposed sweeping tariffs of 145% on Chinese imports — levels that would have severely disrupted global trade and growth if sustained. Instead, both sides agreed to keep additional tariffs at 10% until November 10, allowing more time to pursue a durable trade deal. Still, this is merely a pause rather than progress.
Chart 1: US and China equities
The China docket In the meantime, China’s latest monthly data releases were watched closely and offered valid reasons for caution despite earlier signs of resilience. More specifically, retail sales, industrial production, and fixed-asset investment (chart 2) all missed expectations, suggesting US tariff and non-tariff measures are beginning to weigh on growth alongside persistent domestic headwinds. Also, China’s unemployment rate inched higher, while property prices continued to decline. If such weakness persists, calls for additional policy support will grow, even though debt-fuelled measures risk merely trading today’s problems for tomorrow’s.
Chart 2: China’s retail sales, industrial production, and fixed asset investment

China retail sales Diving deeper into the individual releases, chart 3 highlights the gradual slowdown in China’s retail sales in recent months, with growth easing to 3.7% y/y in July. By product category, the deceleration reflects weaker automobile sales — amid authorities’ clampdown on carmaker price wars — and softer furniture sales, suggesting a one-off boost from the government’s durable-goods subsidy programme may now be fading. Clearer confirmation could come if sales growth of other subsidized goods, such as home appliances, also begin to weaken. Still, retail spending — and broader consumption activity — may gain fresh support from China’s new loan-interest subsidy programme, which covers both consumer borrowing and eligible service-sector business loans.
Chart 3: China retail sales

China property prices and investment Moving next to China’s beleaguered property market, the sector has shown no meaningful recovery for several years. Prices remain on a downtrend, and repeated investor attempts to call a bottom have proven futile. The latest data offered no relief: property prices continued to decline, while investment in the sector fell 12% y/y year-to-date in July (chart 4). That said, the pace of price declines has slowed sharply compared with last year. Even so, what was once a major engine of China’s growth continues to shrink into a shadow of its former self.
Chart 4: China residential prices and investment in real estate

The BRIC bloc While recent trade measures appear favourable for the US, lowering partner tariffs and modestly raising Washington’s own rates, significant risks remain. Such moves could push US trading partners closer together, undermining the administration’s strategy of leveraging bilateral negotiations. One potential area of alignment is the BRIC bloc — Brazil, Russia, India, and China. Although hard data have yet to show major shifts (see chart 5), recent headlines suggest small steps toward deeper cooperation. That said, Russia remains constrained by heavy US sanctions and pressure, as reflected in trade flows with its closest partners.
Chart 5: Intra-BRIC exports

Digging a little further, China and India have recently begun to ease their decades-long frosty ties, partly in response to this year’s US trade tensions. A key sign of improving relations is China’s Foreign Minister Wang Yi’s high-profile visit to India from Monday to Wednesday this week. The visit focused on, among other topics, the disputed Himalayan border — which, if resolved, would mark a major step in restoring bilateral relations — and trade across the border. Other indicators of a warming relationship include ongoing talks to restart direct flights, suspended during the pandemic. Given the sheer size of their populations and economies, as shown in chart 6, a fully developed China-India economic partnership could unlock immense potential. However, the path to meaningful economic integration remains at an early stage, with numerous hurdles still to navigate.
Chart 6: China + India shares of world GDP and population


Tian Yong Woon
AuthorMore in Author Profile »Tian Yong joined Haver Analytics as an Economist in 2023. Previously, Tian Yong worked as an Economist with Deutsche Bank, covering Emerging Asian economies while also writing on thematic issues within the broader Asia region. Prior to his work with Deutsche Bank, he worked as an Economic Analyst with the International Monetary Fund, where he contributed to Article IV consultations with Singapore and Malaysia, and to the regular surveillance of financial stability issues in the Asia Pacific region.
Tian Yong holds a Master of Science in Quantitative Finance from the Singapore Management University, a Master of Science in Analytics from the Georgia Institute of Technology, a Bachelor of Science in Mathematics from the Singapore University of Social Sciences, and a Bachelor of Science in Banking and Finance from the University of London.
More Economy in Brief


