 Global| Jan 08 2026
Charts of the Week: Cooling Inflation, Diverging Growth
by:Andrew Cates
|in:Economy in Brief
Summary
Over the past few weeks, global financial markets have taken comfort from cooling inflation, resilient earnings and continued upside surprises in the dataflow, with equity markets extending gains as confidence in a soft-landing outcome has firmed. While AI-related optimism was questioned toward the end of last year, amid valuation concerns and uncertainty over near-term payoffs, sentiment has improved again in recent days. Latest business surveys suggest little immediate cause for alarm on the global growth front (chart 1), despite clear signs of divergence across regions. At the same time, there are few near-term inflation concerns evident in the data, with global supply-chain pressures remaining subdued (chart 2). Taken together, these developments leave little immediate challenge to the prevailing outlook for monetary policy, with expectations for further gradual easing across several major economies remaining broadly intact (chart 3). At the same time, geopolitical shocks — most notably the upheaval in Venezuela — have reignited focus on energy market risks and sovereign debt uncertainties, adding complexity to oil price expectations and fiscal trajectories (chart 4). Shifting focus, China’s role also continues to remain pivotal: surplus industrial capacity and competitive export pricing continue to shape global trade and exert disinflationary influence (chart 5). Against this backdrop, public debt levels that are both elevated and still rising in many large economies underscore the structural imbalances that could limit policy flexibility and amplify market sensitivities in the immediate months ahead (chart 6).
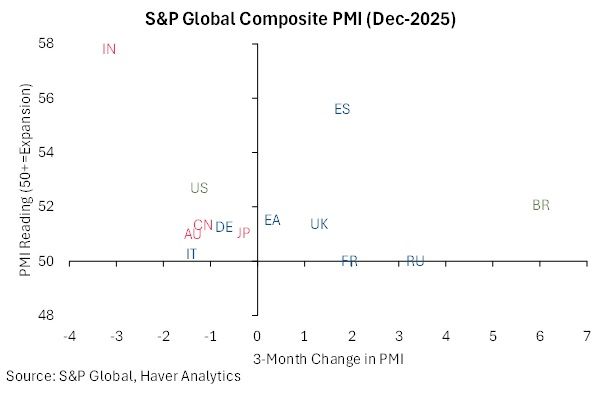
Global growth This first chart below highlights a still-fragmented global growth picture, with momentum and current activity levels varying markedly across economies. India stands out at the top-left of the chart, combining a very strong composite PMI reading with some recent cooling in momentum, suggesting activity remains robust even as growth rates moderate. Brazil and Spain sit at another end of the spectrum, pairing solid expansionary PMI levels with strong positive three-month momentum, signalling accelerating activity into year-end. By contrast, much of continental Europe — including France, Germany and Italy — remains clustered close to the 50 threshold, with modest (or no) improvements in momentum and only tentative signs of underlying expansion, underscoring the euro area’s sluggish growth backdrop. The US occupies a middle ground by remaining in expansionary territory, but recent momentum has softened, consistent with a gradual cooling rather than a downturn. Overall, the chart reinforces the message that while global growth remains positive, it is neither synchronised nor particularly strong.
Chart 1: December’s Composite PMI Survey: 3-month changes versus levels
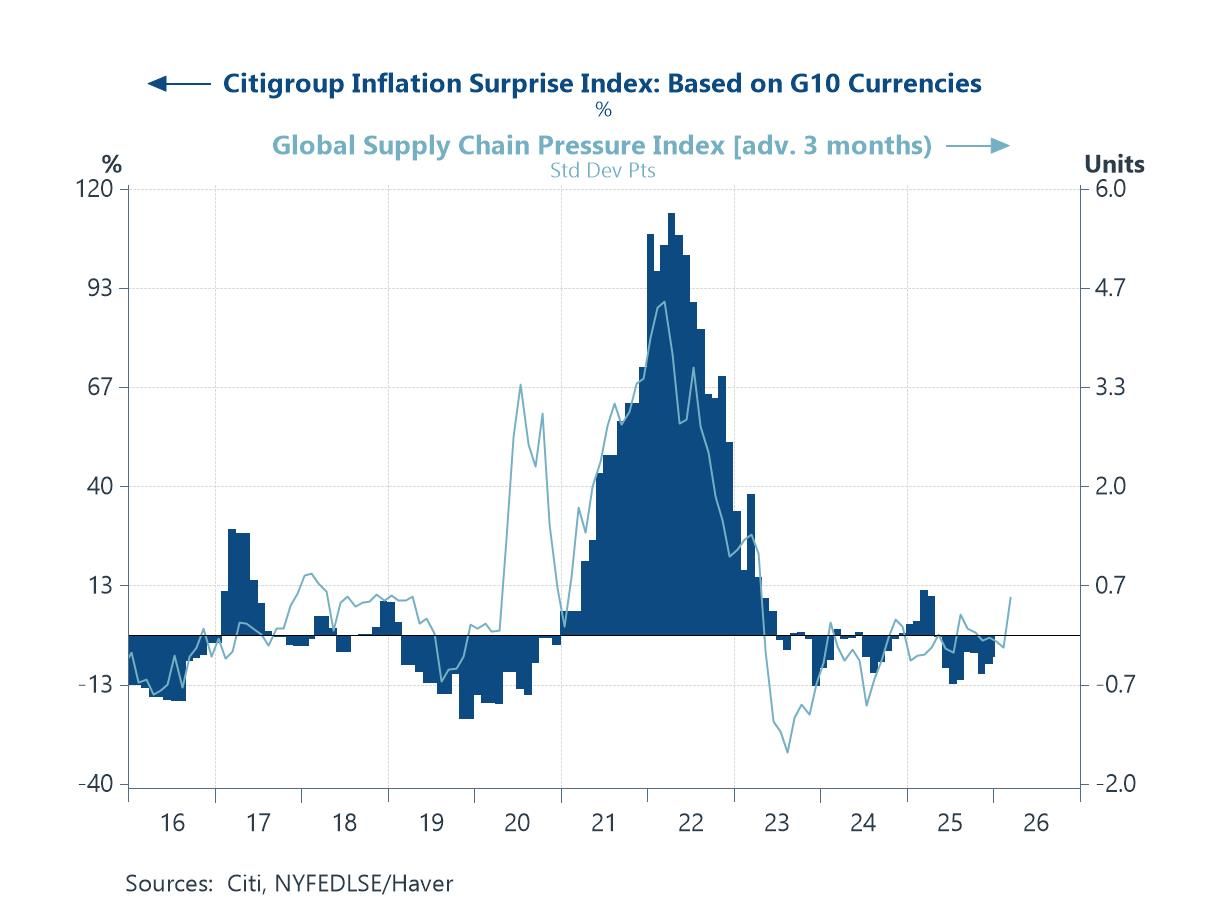
Supply chain pressures and inflation surprises The NY Fed’s Global Supply Chain Pressure Index has remained subdued in recent months, reinforcing the view that supply-side frictions are no longer a material source of inflation risk. After the extreme dislocations of 2021–22, the index has settled close to, and at times below, its long-run average, consistent with largely normalised delivery times, inventories and transportation costs. The latest reading for December 2025, however, does point to some marginal tightening in supply-chain conditions, though from very low levels and still well within historical norms. Still, this modest firming has so far coincided with a broadly benign profile for inflation surprises across the G10. While geopolitical risks and trade fragmentation remain medium-term considerations, the current signal from global supply chains continues to point to limited immediate upside pressure on inflation.
Chart 2: The NY Fed’s global supply chain pressure index versus G10 inflation surprises
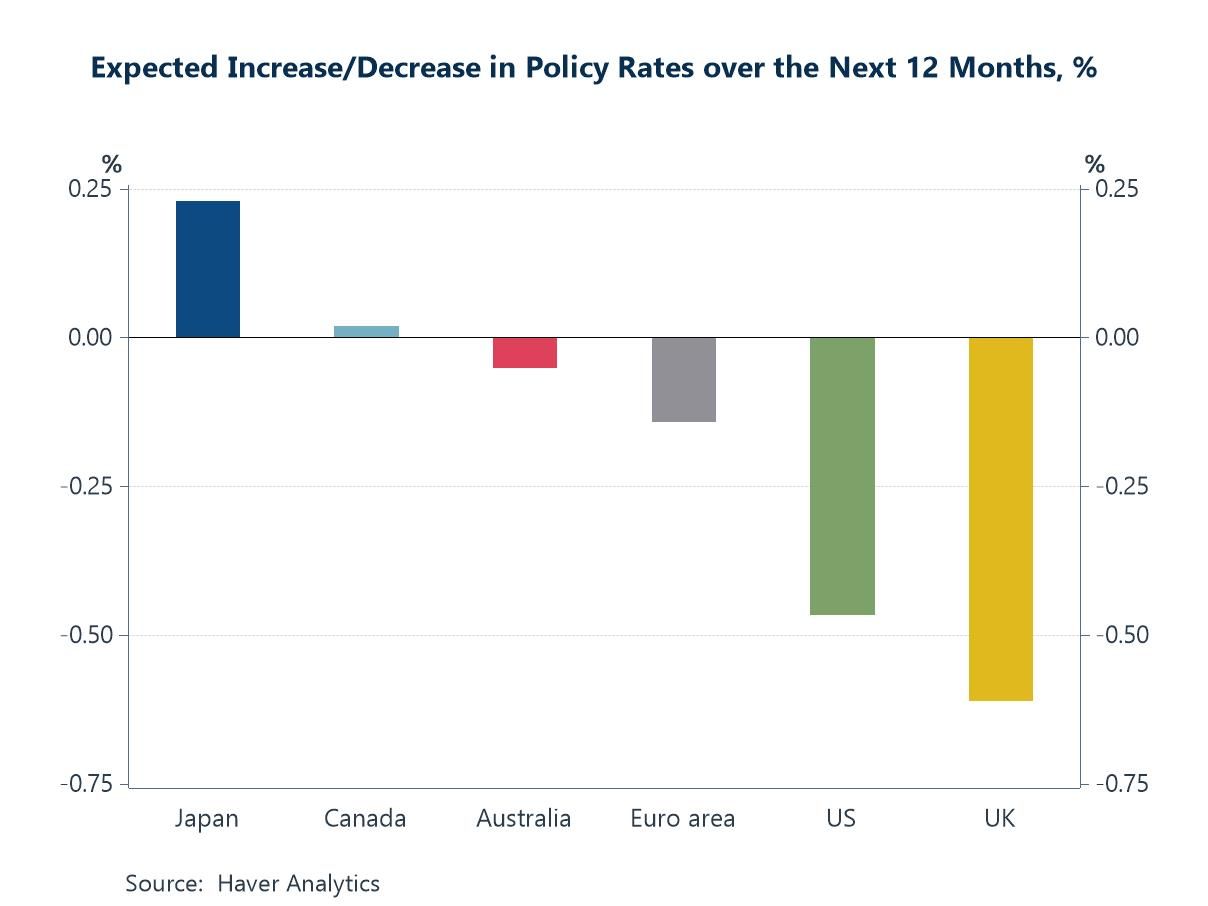
Policy rate expectations In the meantime, policy-rate expectations across the major economies continue to diverge, reflecting differences in inflation dynamics and where central banks sit in their respective cycles. The latest Blue Chip survey of Financial Forecasts points to further easing over the next 12 months in the UK and the US. By contrast, expectations for the euro area and Canada are more subdued, in part because both central banks are already at a more advanced stage of their easing campaigns, leaving less scope for additional near-term adjustment. Australia stands apart, with lingering inflation pressures tempering expectations for rate cuts despite softer growth momentum. Japan, meanwhile, remains at a very different point in the cycle: having only recently begun a less accommodative campaign from ultra-loose policy, it is the sole major economy where forecasters still anticipate modest further policy tightening rather than easing.
Chart 3: Blue Chip Financial Forecasts: Expected changes in policy rates over the next 12 months
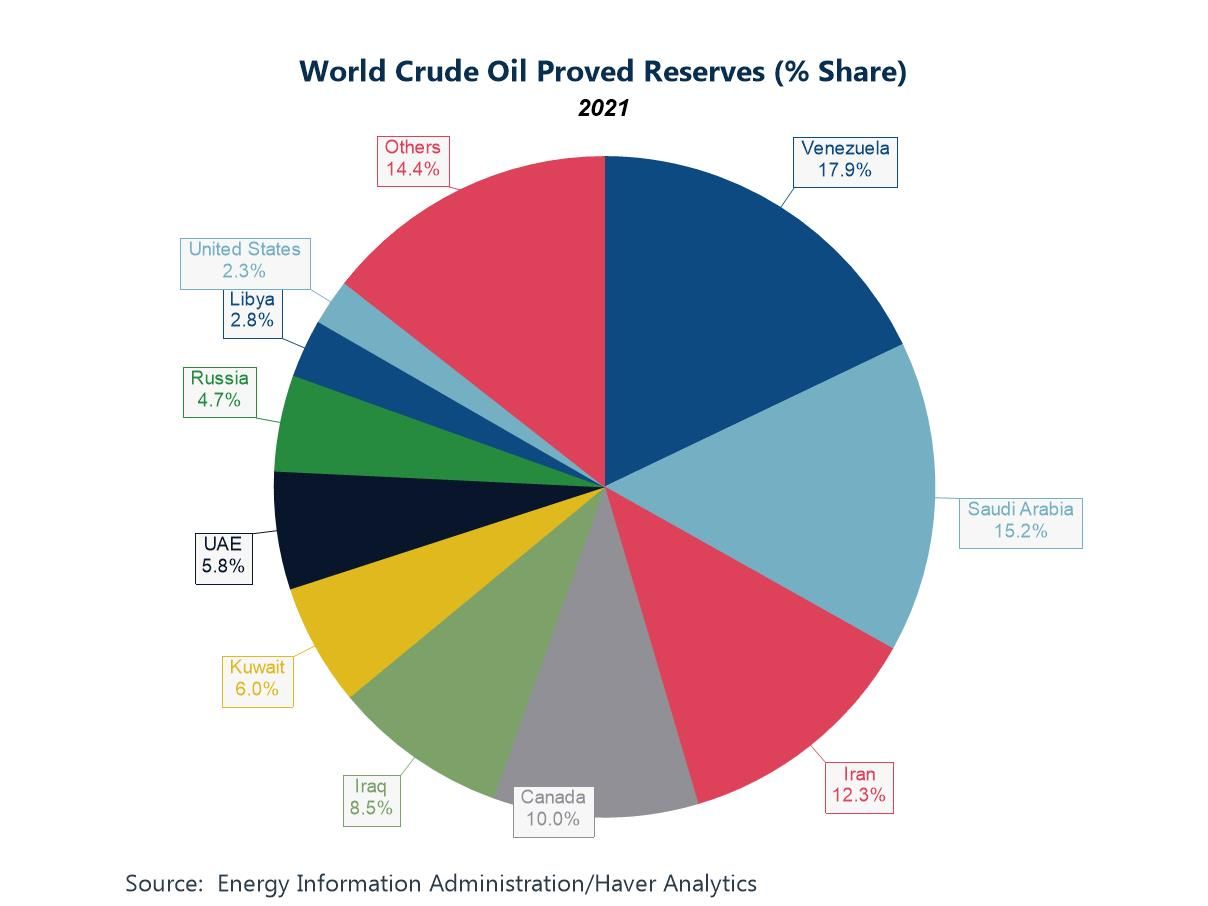
Venezuela, the oil market and implications Venezuela’s outsized share of world crude oil proved reserves — nearly one-fifth of the global total — looms large in market narratives even as its actual production has languished well below historic highs. At the start of 2026, dramatic political and strategic events — including the capture of President Nicolás Maduro by U.S. forces and a tightening U.S. oil blockade that has halted Venezuelan exports — have injected fresh uncertainty into oil markets. While immediate impacts on global prices have been modest amid ample global supplies, geopolitical risk premiums have briefly lifted crude benchmarks, reflecting market sensitivity to potential supply disruptions and future policy shifts. In the short run, sustained low exports and production cuts due to storage constraints could tighten crude balances marginally, but most analysts see limited influence on overall market fundamentals this year. Over the longer term, however, any successful revival of Venezuelan output — contingent on massive investment, infrastructure rehabilitation and changes to sanctions policy — could eventually expand heavy crude availability and weigh on prices, with broader implications for OPEC+ dynamics and energy security in the Western Hemisphere.
Chart 4: Global crude oil reserves by major country/region
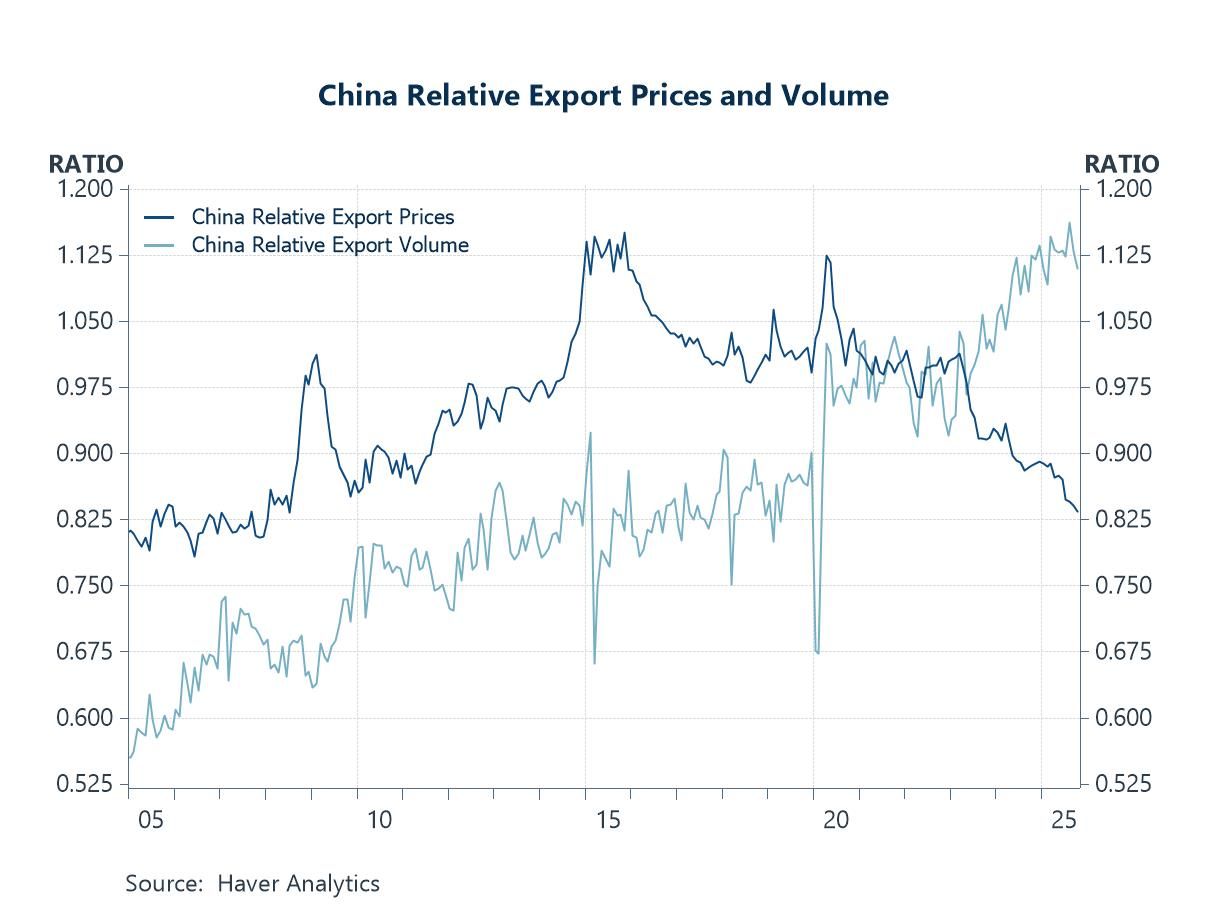
China’s excess capacity and traded goods price disinflation China’s export sector looks set to remain a key swing factor for the global economy in the year ahead, not least because of persistent surplus manufacturing capacity and weak domestic demand. As the chart illustrates, periods of falling relative export prices have tended to coincide with rising export volumes, highlighting China’s ability — and willingness — to clear excess capacity through external markets. With producer prices still under pressure and policy support focused more on supply than demand, the risk is that excess capacity is once again exported via more aggressive price competition, rather than absorbed domestically. If sustained, this dynamic would reinforce global disinflation forces, intensify competitive pressures on manufacturers elsewhere, and heighten trade tensions, particularly in sectors already sensitive to Chinese overcapacity such as autos, machinery and green technologies. In that sense, China’s export pricing behaviour may prove as important for the global inflation and trade outlook in 2026 as any shift in domestic growth momentum.
Chart 5: China: Domestic export prices and export volumes relative to global aggregates
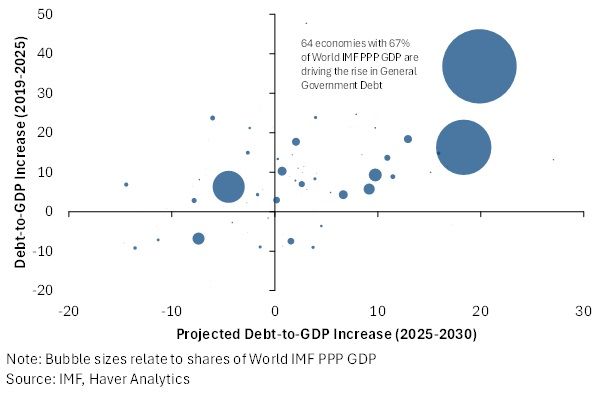
Public sector indebtedness This next chart, drawn up by the IMF, underlines a defining feature of the post-pandemic macro landscape: public debt is not only higher than before Covid, but is set to keep rising — and at a faster pace — with the largest economies doing much of the heavy lifting. The clustering of the biggest bubbles in the upper-right quadrant shows that countries accounting for roughly two-thirds of global GDP have already experienced sizeable increases in debt-to-GDP ratios since 2019 and are projected to see further rises through the second half of the decade. This combination of elevated starting points and ongoing fiscal expansion reflects the persistence of structural pressures — higher interest costs, ageing populations, defence spending and climate-related investment — rather than temporary crisis measures. For the global economy, the implication is a world in which fiscal policy remains active but increasingly constrained, raising difficult questions about debt sustainability, the tolerance for higher real interest rates, and the scope for counter-cyclical fiscal support when the next downturn arrives.
Chart 6: Public sector debt to GDP ratios, 5-year changes, actual versus projected

Andrew Cates
AuthorMore in Author Profile »Andy Cates joined Haver Analytics as a Senior Economist in 2020. Andy has more than 25 years of experience forecasting the global economic outlook and in assessing the implications for policy settings and financial markets. He has held various senior positions in London in a number of Investment Banks including as Head of Developed Markets Economics at Nomura and as Chief Eurozone Economist at RBS. These followed a spell of 21 years as Senior International Economist at UBS, 5 of which were spent in Singapore. Prior to his time in financial services Andy was a UK economist at HM Treasury in London holding positions in the domestic forecasting and macroeconomic modelling units. He has a BA in Economics from the University of York and an MSc in Economics and Econometrics from the University of Southampton.
More Economy in Brief


