Global| Jul 30 2026
Charts of the Week: The Price of an Investment Boom
by:Andrew Cates
|in:Economy in Brief
Summary
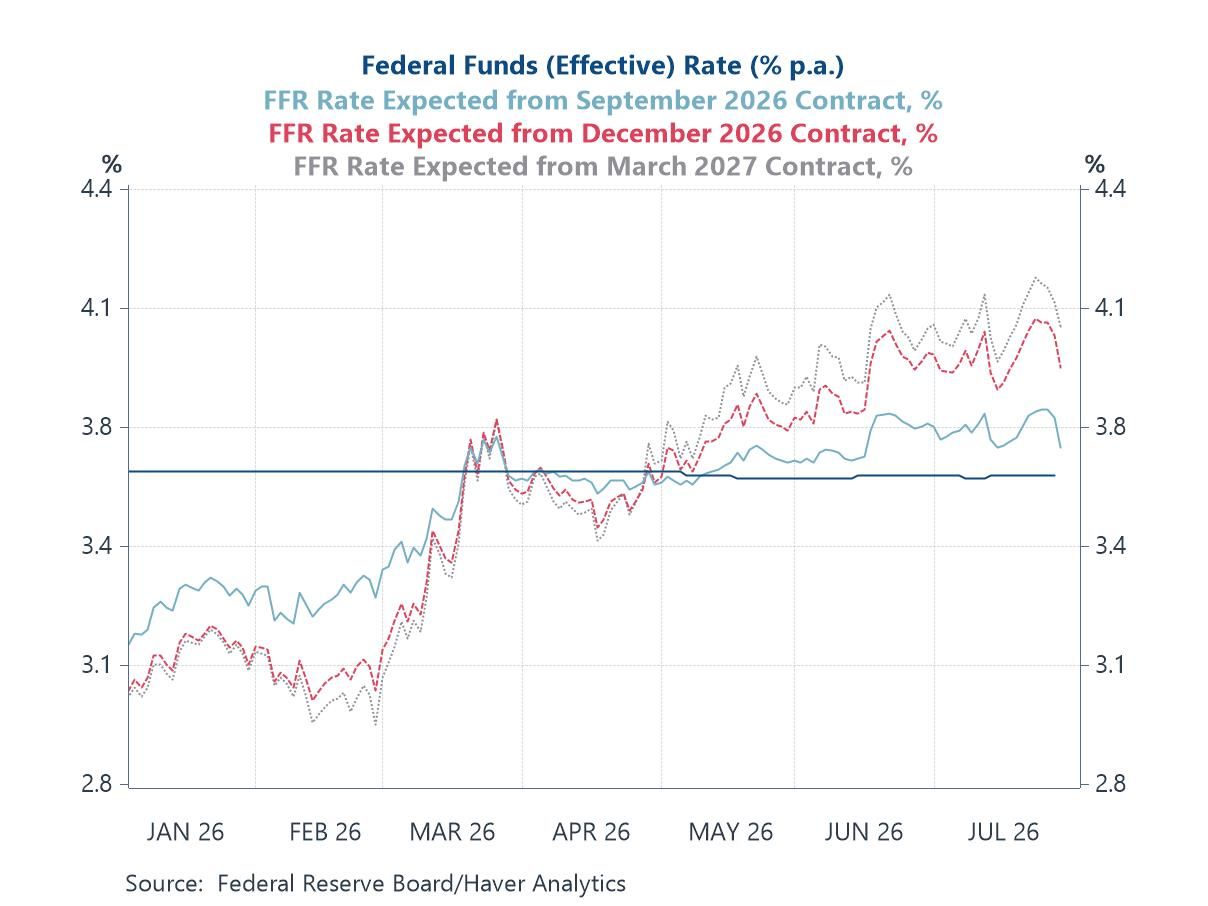
The Federal Reserve left its policy rate unchanged at the conclusion of last night’s meeting, a decision that had been widely expected — the futures market went in pricing only around a one-in-three chance of a hike — but one that split the committee unusually sharply, with three of its members dissenting in favour of an increase to counter inflation that has now run above target for more than five years (chart 1). Yet whatever the near-term path of official rates, the real cost of capital has already moved decisively. The real ten-year yield has climbed to around its highest in two decades, and it has done so in step with a run of firmer-than-expected economic data (chart 2). Behind that resilience lies an investment cycle that is quietly gathering pace. The July flash surveys show the upturn led, unusually, by manufacturing rather than services (chart 3), and the hard data are beginning to agree, with manufacturing orders across many major economies turning firmly higher (chart 4). Equity markets, for their part, have taken elevated real rates in their stride, the bond–equity relationships that fractured in 2022 having since been restored (chart 5) — the signature of a market that believes it has entered a higher-return, investment-led regime. The optimism is not unqualified. A fresh round of US tariffs and a sharp sell-off in chip stocks, led by South Korea, are reminders that the payoff from all this spending is far from assured. And the boom is colliding with a physical constraint: since the breakdown of the US–Iran understanding, Baltic tanker and gas freight rates have surged even as dry-bulk rates have stayed calm (chart 6), a pointed warning about the security of the world’s energy arteries.
The Fed stays its hand With US inflation still running above target and the economy expanding at a solid pace, the case for a further hold commanded a clear majority — but not the whole committee. The decision to stand pat for a fifth straight meeting drew three dissents, from members who wanted to raise rates without further delay: a rare and public split, and the sharpest the committee’s new leadership has yet faced. The futures market, by contrast, had been far less conflicted. A hold was the firm favourite going in, with only about a one-in-three chance of a hike attached, so the outcome itself surprised few. Where the real uncertainty now lies is in the path beyond this meeting. The rates implied by the September, December and March contracts no longer describe an easing cycle at all; if anything they lean towards further tightening, with a move as soon as September now a live possibility — a marked change from the cuts that had been priced earlier in the year. Tellingly, the statement accompanying the decision singled out strong capital investment and productivity growth, the very forces that run through the rest of this week’s charts.
Chart 1: The Fed holds for a fifth meeting; the futures-implied path now tilts towards further tightening
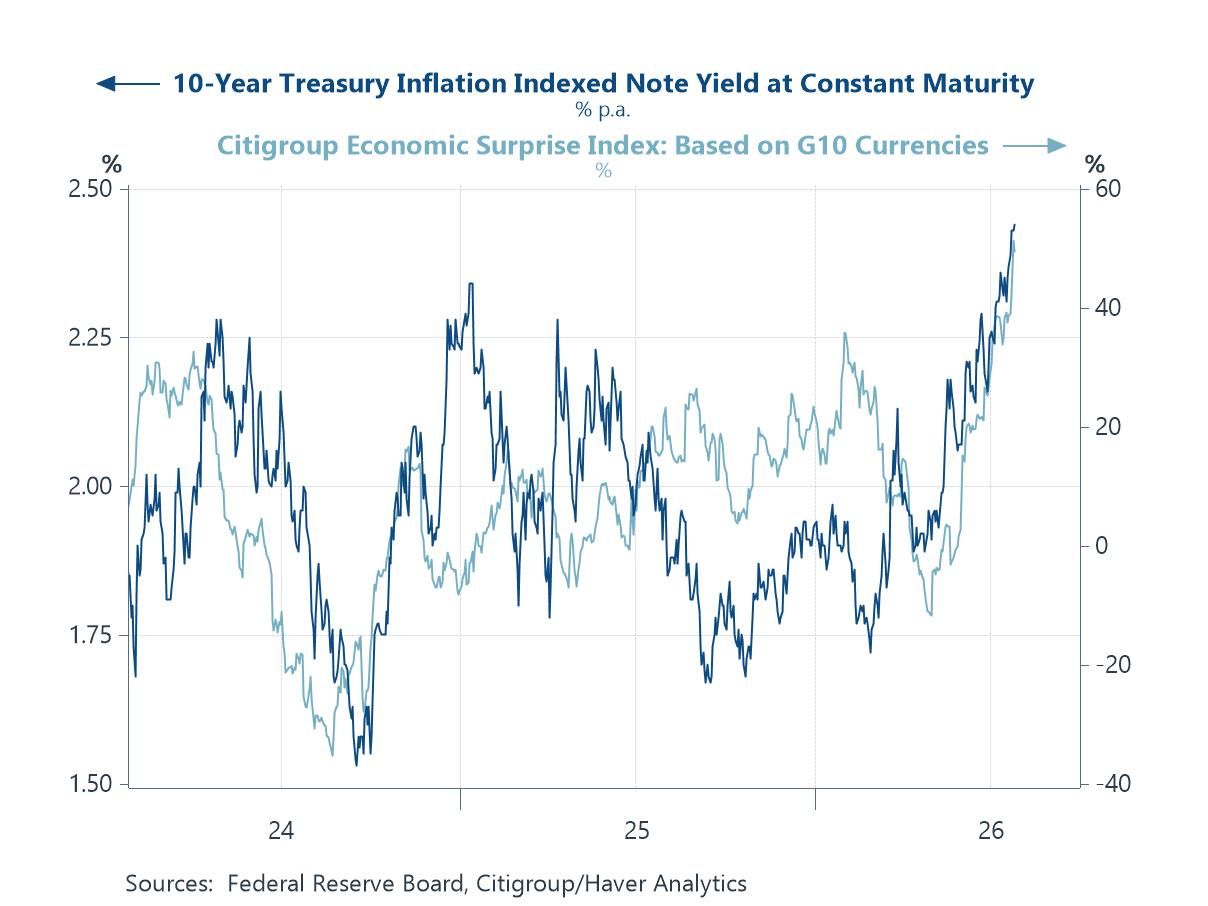
Expensive money, for the right reasons If official rates are going nowhere fast, the same cannot be said of the real cost of long-term capital. The US 10-year inflation-protected yield has risen to around its highest in twenty years, and the timing is instructive: it has moved closely with the Citigroup economic surprise index, climbing as incoming data have repeatedly beaten expectations. That distinction matters. A real yield rising because the economy keeps surprising to the upside is a very different thing from one pushed higher by, say, fiscal policy scares. It potentially points instead to genuine strength in the demand for capital — and, as the charts that follow suggest, to an investment cycle that is beginning to turn.
Chart 2: Real yields have risen in step with the run of economic surprises
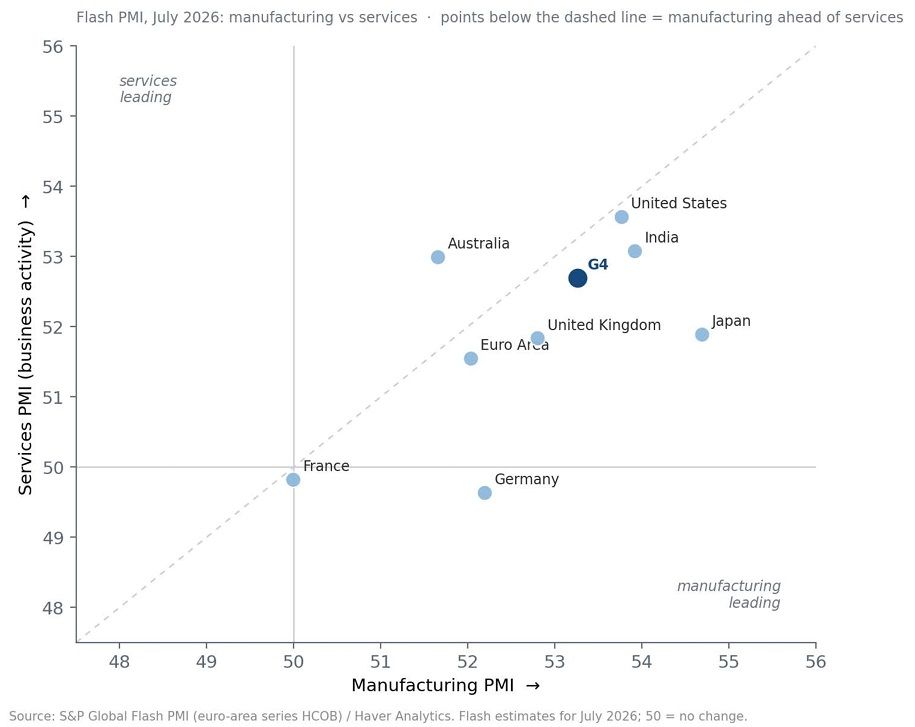
A recovery led from the factory floor The composition of the July flash surveys is as notable as their level. As chart 3 below suggests, in most of the major economies the manufacturing reading now sits above that for services — the points falling below the diagonal — reversing the pattern of much of the post-pandemic period, when services did the heavy lifting. A manufacturing-led upturn is characteristic of an investment cycle rather than a consumption one, and it fits the wider picture: it is firms, not households, that are stepping up their spending, whether on artificial intelligence, electrification, defence or the reshoring of supply chains.
Chart 3: July flash PMIs point to a manufacturing-led upturn
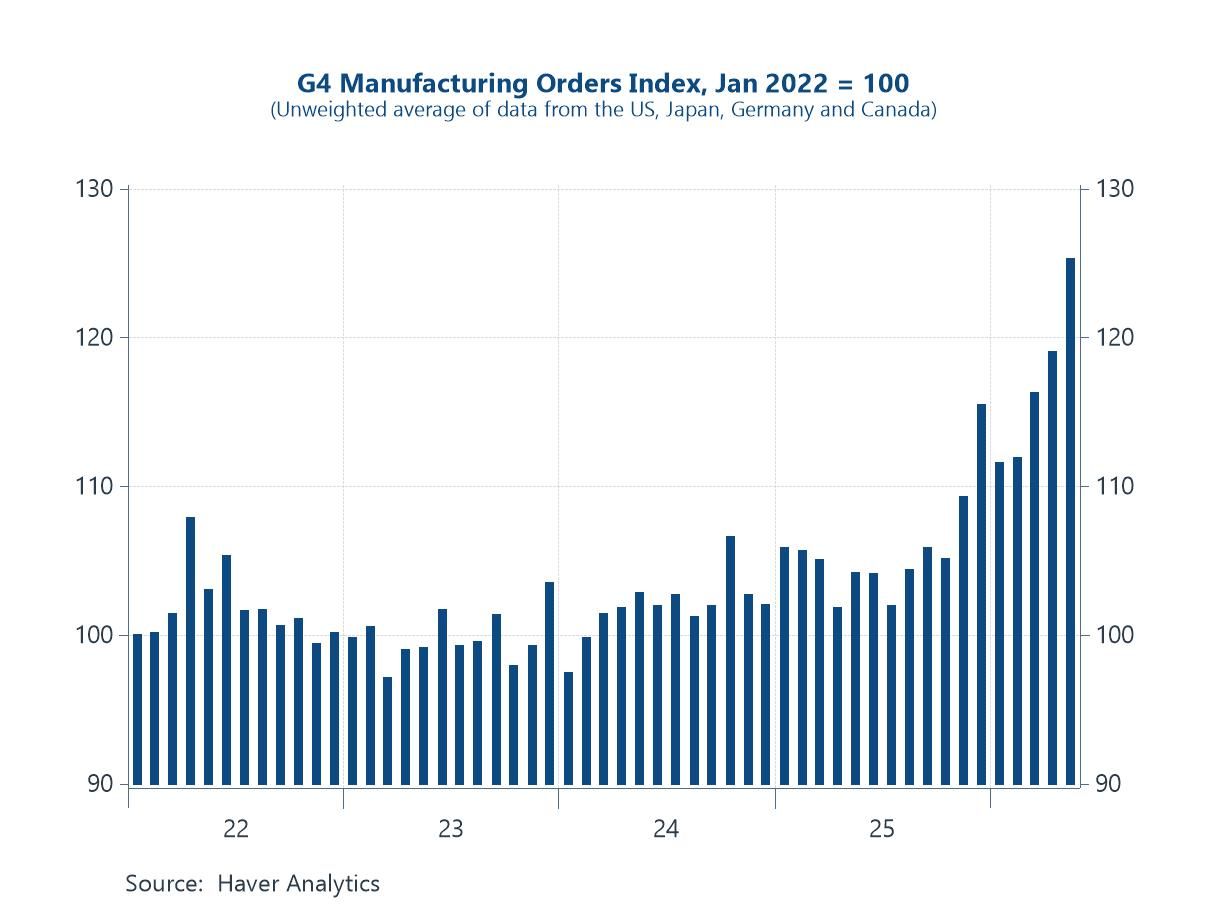
Orders confirm the turn Survey balances are one thing; hard orders are another, and they are pointing the same way. A composite of manufacturing new orders across the United States, Japan, Germany and Canada has turned firmly higher, corroborating the message of the flash surveys. The strength is genuine, though it warrants a caveat. Some of it reflects lumpy and volatile items, Japanese machinery orders among them, and much of the wider investment surge is defensive as much as productive, directed at security and resilience rather than at raising the economy’s productive capacity. Whether it ultimately pays off will turn on that distinction — and on whether it is funded out of profits or increasingly out of borrowing.
Chart 4: G4 manufacturing orders have turned firmly higher
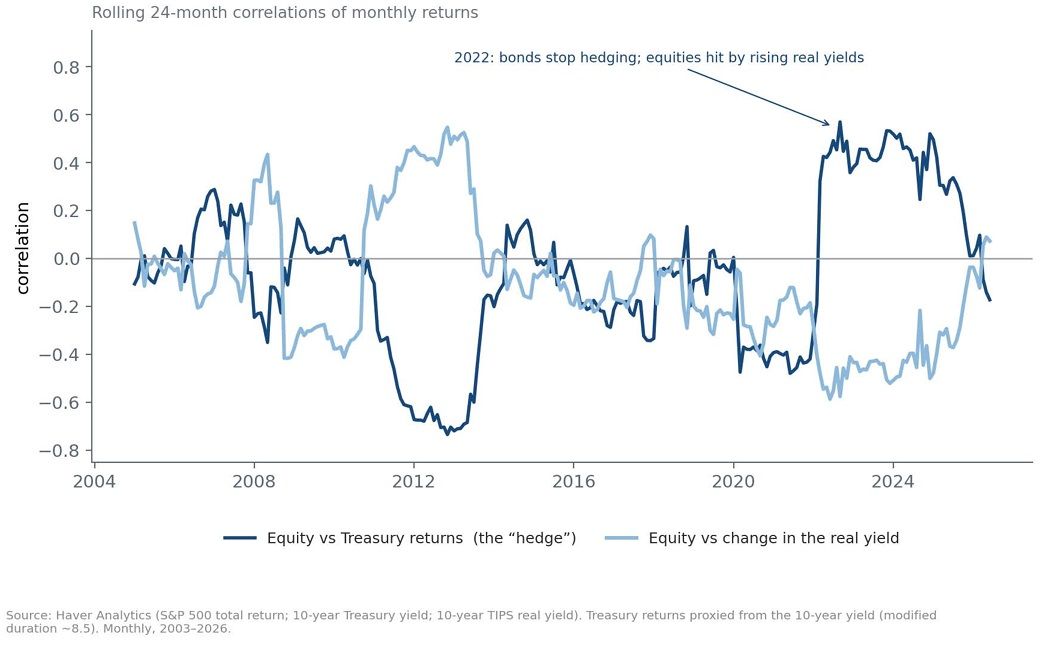
Markets at ease with higher rates Equities, remarkably, have taken all of this in their stride, holding near record highs even as real yields have climbed. The reason can be read in the way assets move together. The correlations that broke down in 2022, when rising real yields hit shares and bonds alike and government bonds ceased to hedge equity risk, have since reverted to something closer to their historical norm. That normalisation is the mark of a market persuaded that higher rates reflect stronger growth rather than an inflation problem. It is a coherent view, and may prove right; but it rests on the assumption that the investment now under way delivers the productivity gains its champions promise. This week’s rotation out of the artificial-intelligence winners, and the sharp fall in chip stocks led by South Korea, show how quickly that assumption can be called into question.
Chart 5: The equity–bond relationships that broke in 2022 have reverted
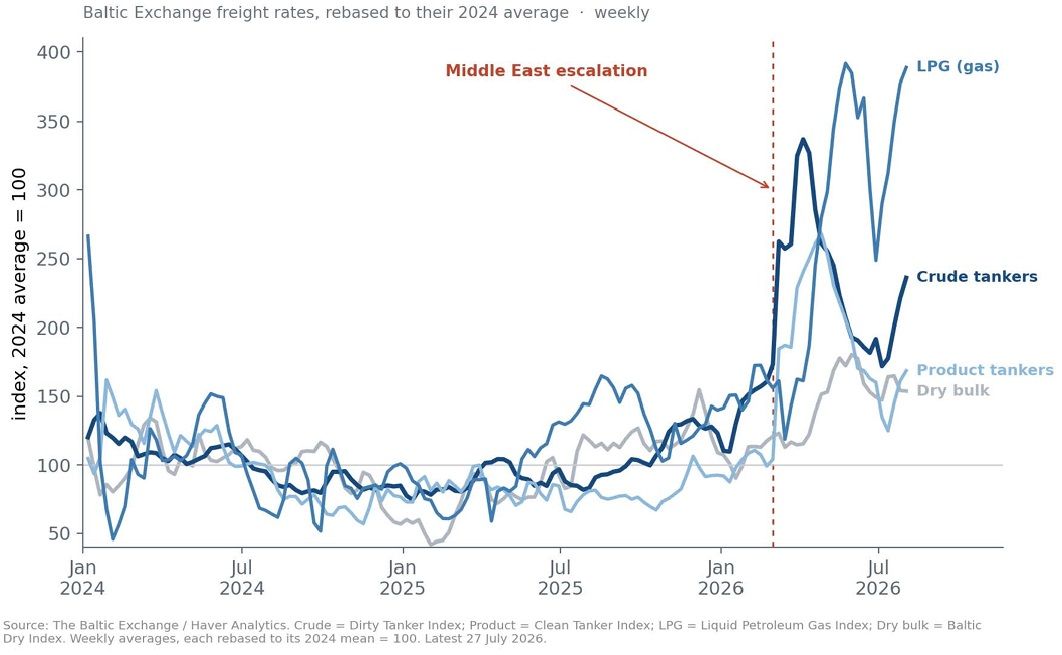
The constraint beneath the boom For all the enthusiasm about capital spending, the boom is running into a physical wall, and nowhere is that clearer than at sea. Rebased to their 2024 average, Baltic freight rates tell a strikingly selective story. Since the breakdown of the US–Iran understanding and the associated escalation in the Middle East, the cost of shipping crude oil, refined products and gas has surged, while dry-bulk rates — grain, iron ore, coal — have barely moved. This is not a broad freight boom but a targeted repricing of the risk to the world’s energy arteries, above all the Strait of Hormuz. It is a fitting coda to the week: an investment cycle straining against the availability, and the security, of the energy and resources on which it ultimately depends.
Chart 6: Baltic energy freight has surged while dry bulk has stayed calm

Andrew Cates
AuthorMore in Author Profile »Andy Cates joined Haver Analytics as a Senior Economist in 2020. Andy has more than 25 years of experience forecasting the global economic outlook and in assessing the implications for policy settings and financial markets. He has held various senior positions in London in a number of Investment Banks including as Head of Developed Markets Economics at Nomura and as Chief Eurozone Economist at RBS. These followed a spell of 21 years as Senior International Economist at UBS, 5 of which were spent in Singapore. Prior to his time in financial services Andy was a UK economist at HM Treasury in London holding positions in the domestic forecasting and macroeconomic modelling units. He has a BA in Economics from the University of York and an MSc in Economics and Econometrics from the University of Southampton.
More Economy in Brief