Asia| Jul 27 2026
Economic Letter from Asia: Triple Threat
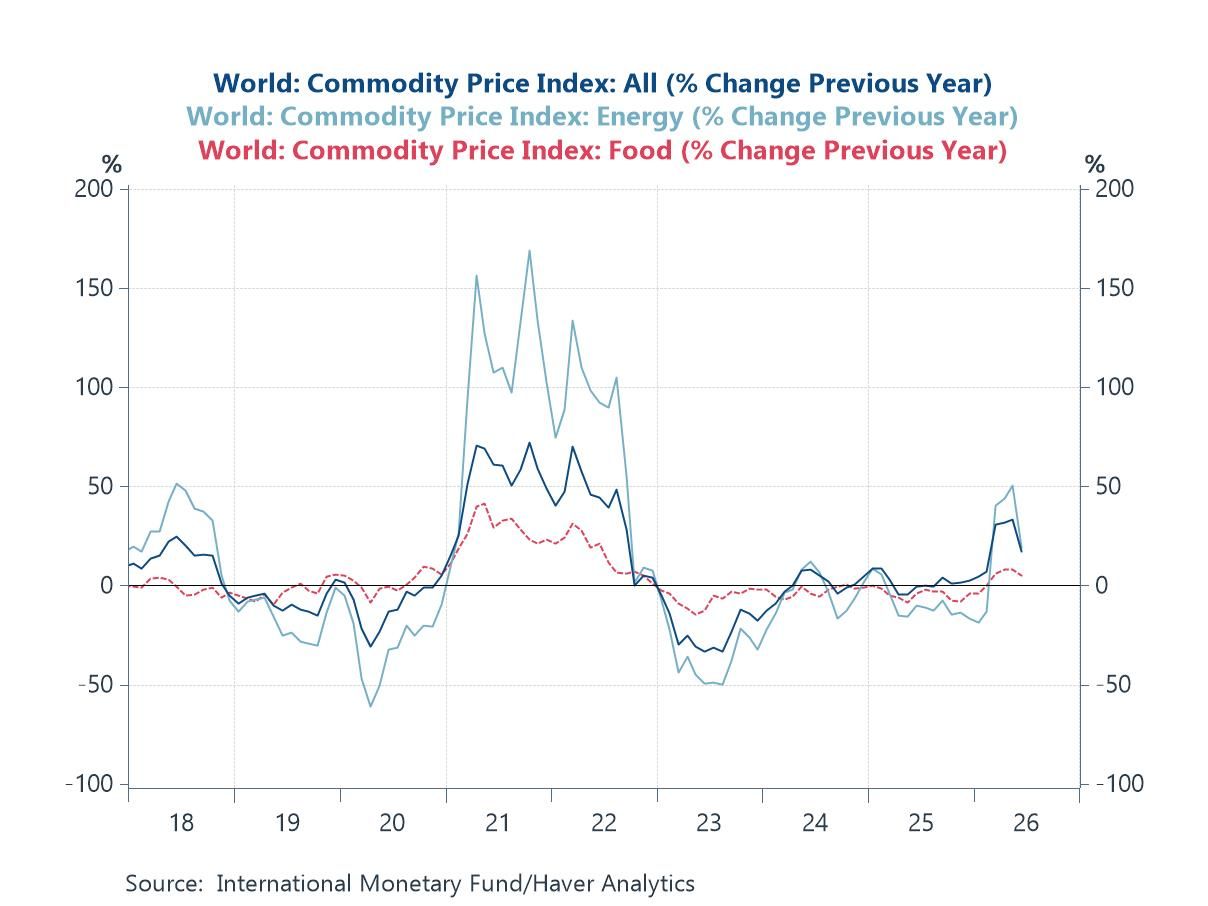
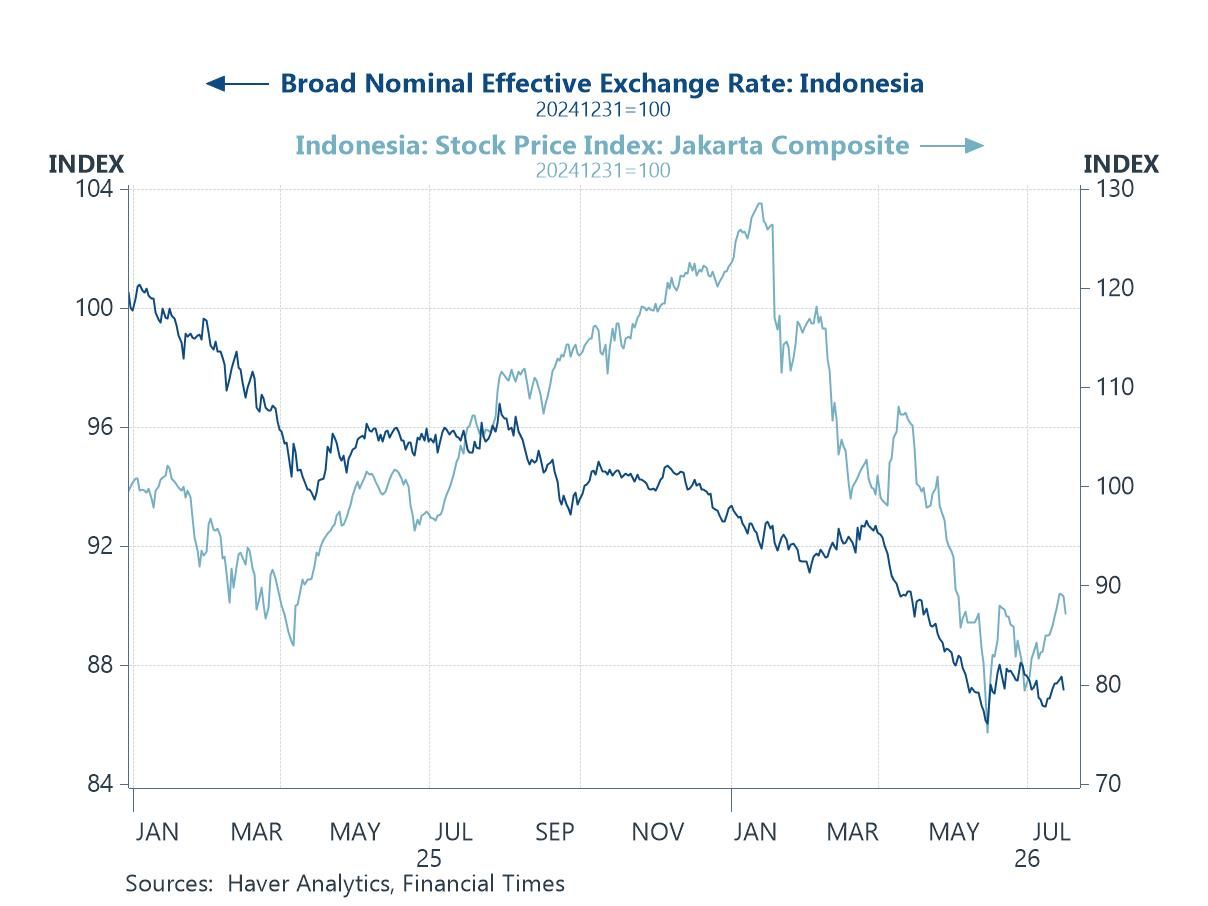
In this week's Letter, we trace three threats converging on Asia's inflation outlook. The first is renewed US tariffs, with the latest salvo of duties imposed over alleged forced labour issues. That move is widely seen as a replacement for the now-expired Section 122 tariffs, with only mild incremental effects from the new Section 301 duties. Set against that, the US effective tariff rate has pulled back from its 2025 highs in recent months (chart 1). The second is the Strait of Hormuz, where the re-escalation of US-Iran tensions has once again reduced shipping volumes to a trickle. Crude oil prices have been driven up as a result (chart 2). It could have been worse, were it not for China's sharply reduced crude imports over the period (chart 3). Arguably, though, at least part of that reduced intake simply reflected the absence of supply from the Strait. The third is the ongoing El Niño event, which several authorities have warned will likely be the largest on record (chart 4). It risks disrupting food crop yields, among other effects, channelling a price shock through food supply. Together these pressures threaten to upend the pullback in commodity inflation seen in recent months (chart 5), once again complicating policymaking. As an aside, we also explore economy-specific political developments that are brewing or could become an issue further down the road. One is the recent resignation of Indonesia's central bank governor, which came amid protracted rupiah weakness (chart 6) and concerns about fiscal health.
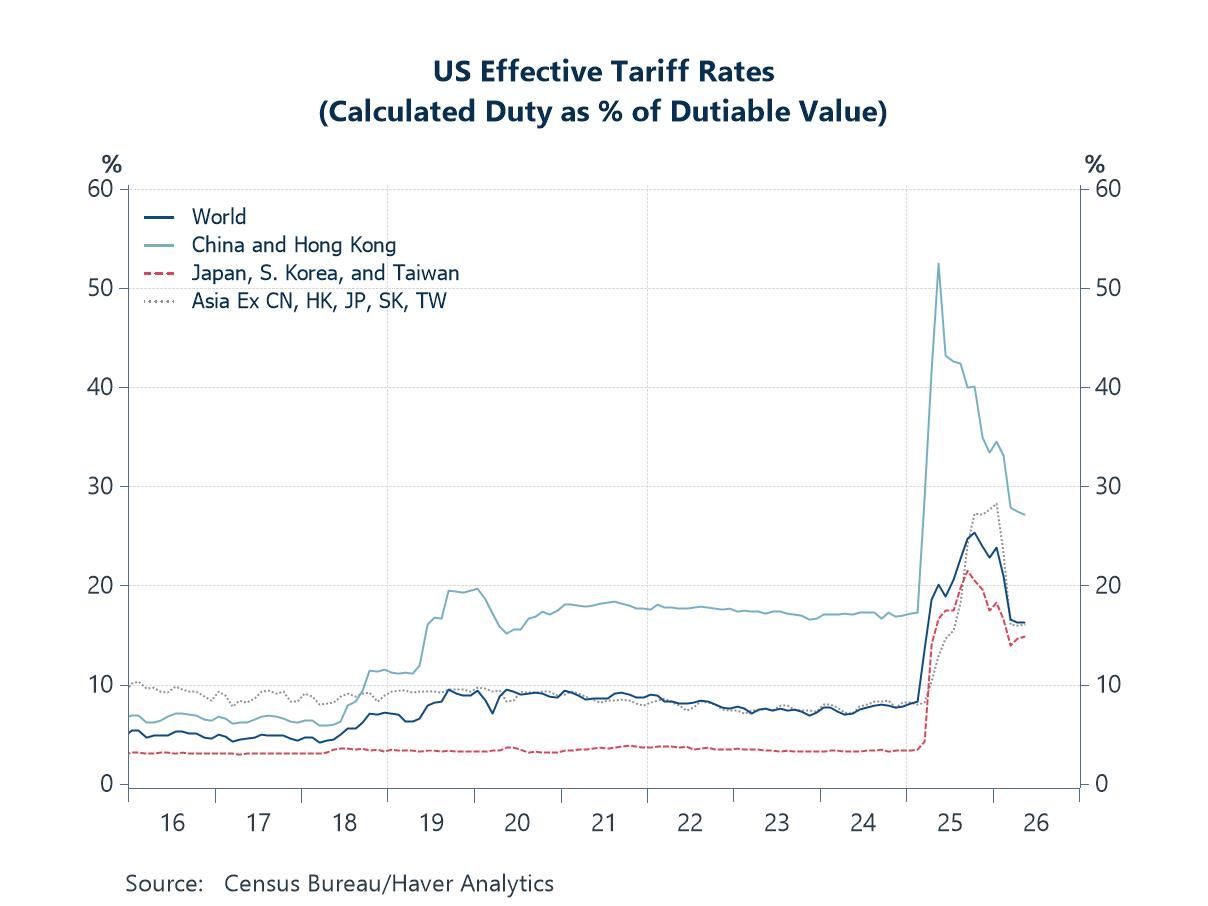
Tariff trouble Recent US forced labour tariffs have revived concerns, pushing the tariff theme back to the fore. The US imposed additional Section 301 duties of 10% or 12.5% on imports from 60 investigated economies, effective 24 July 2026. These followed USTR investigations into those economies' failure to impose and enforce prohibitions on goods produced with forced labour. They took effect the same day the temporary 10% Section 122 global surcharge expired by statute, and are seen as its replacement. Yet overall US effective tariff rates, calculated as duty as a percentage of the respective dutiable value, have pulled back significantly from their 2025 highs (chart 1). That retreat began with the numerous bilateral trade deals the US eventually struck with many of its trading partners. It went further in February, when the Supreme Court struck down President Trump's tariffs imposed under the International Emergency Economic Powers Act (IEEPA). That ruling dented the overall impact of US tariffs on its trading partners, with possible tariff refunds still in the works. Cutting the other way, the Section 122 surcharge had partially raised overall rates while it ran. Even so, some estimates suggest the new duties will only marginally increase US effective tariff rates on its trading partners.
Chart 1: US effective tariff rates
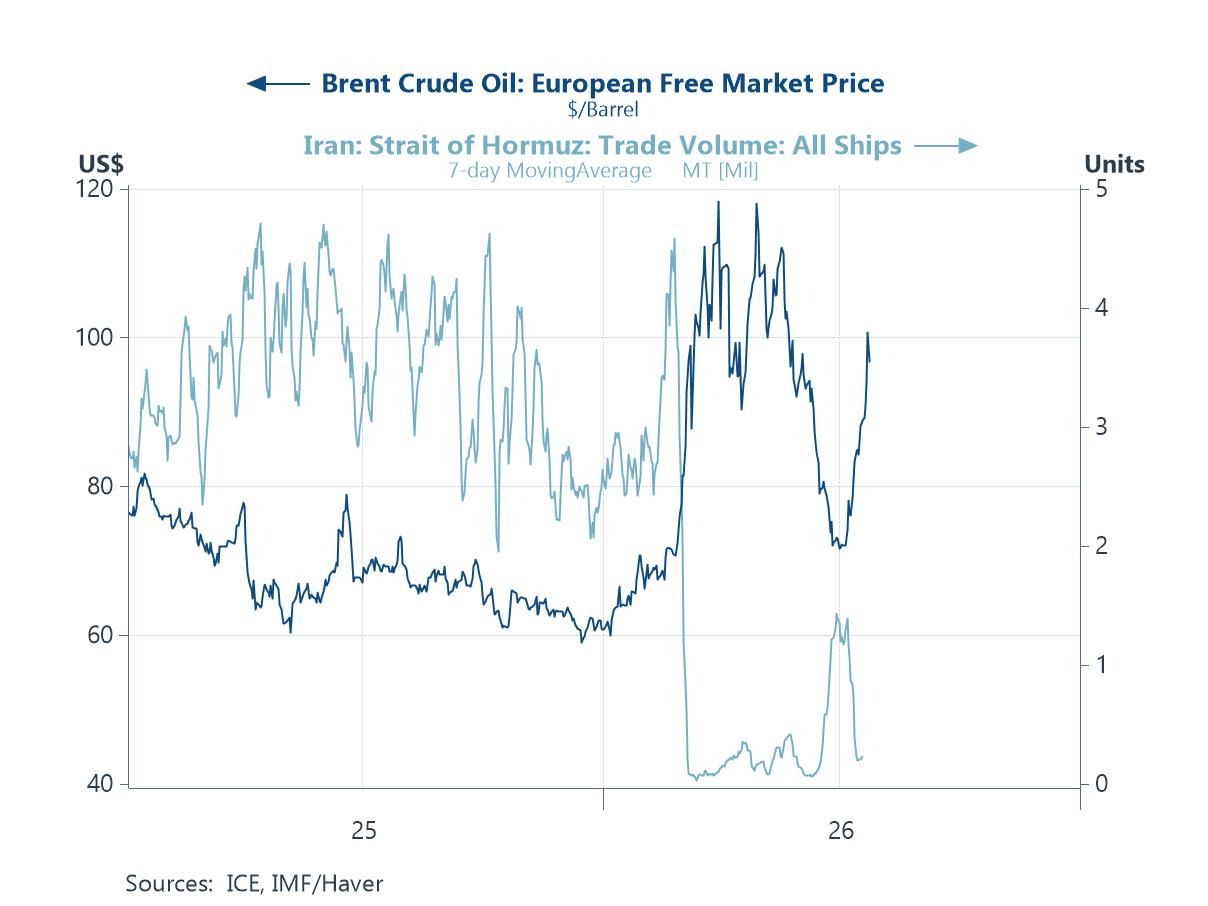
Strait trouble Tariff concerns have not resurged in isolation. Worries about the US-Iran conflict have returned alongside them, along with their consequences for shipping flows and crude oil prices. Those flows are the starting point, and shipping volumes through the Strait of Hormuz have tumbled once more, reduced again to a trickle (chart 2). Crude prices have followed, surging towards their post-conflict highs, with Brent flirting with $100/bbl. Against that, some interim reprieve may have come from the pause in strikes between the US and Iran, which followed 13 straight nights of US attacks. A pause is not a reopening, however, and the key metric remains the flow of goods, and especially energy, through the Strait. Those flows have not yet recovered to anywhere near pre-crisis levels. Resolving them is what the talks now under way between Oman and Iran are meant to address.
Chart 2: Brent crude price and Strait of Hormuz shipping volume
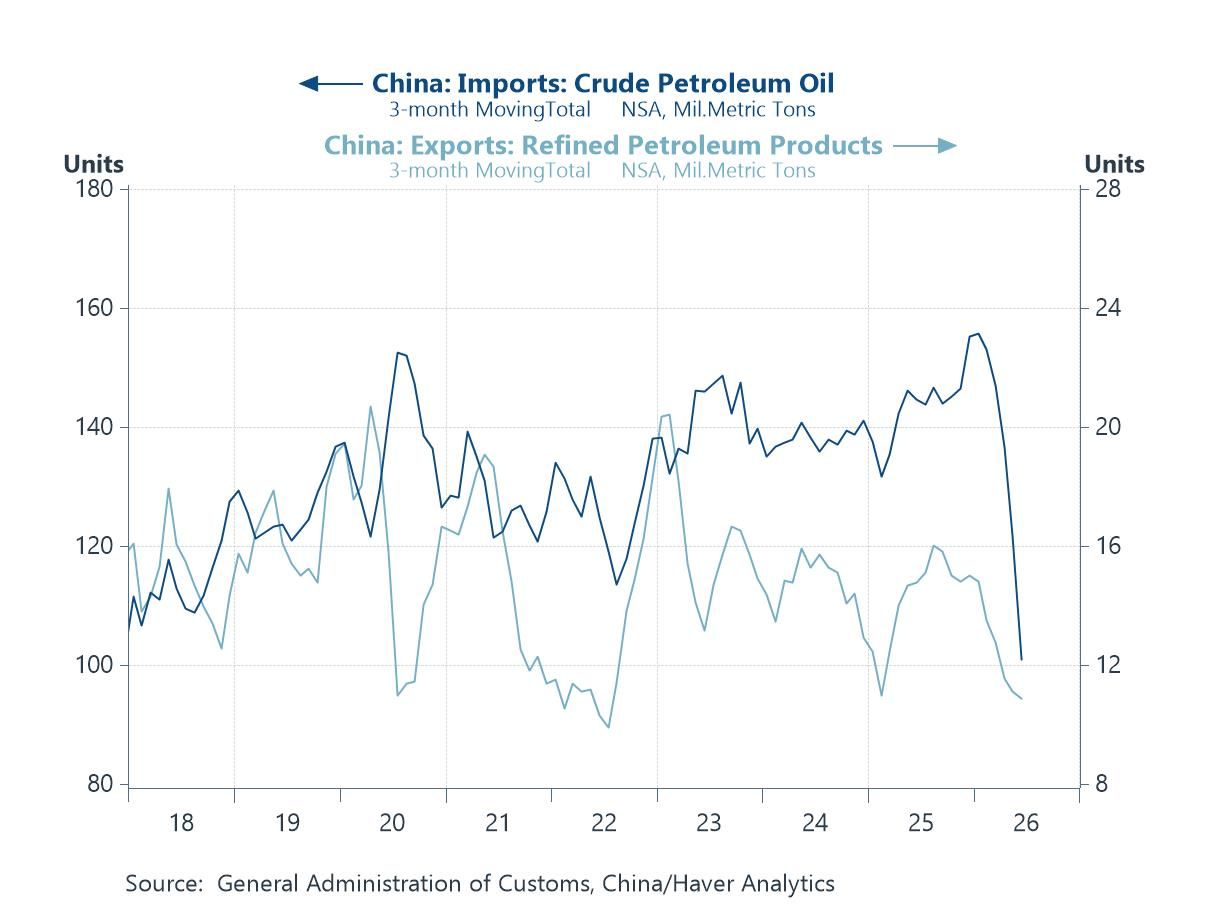
A less appreciated point amid the US-Iran flare-up and the subsequent surge in oil prices is that it could have been considerably worse. One reason concerns China, whose crude oil imports fell sharply after the conflict broke out (chart 3). That absence of demand was partly involuntary, since little crude was flowing through the Strait in any case. Even so, it likely alleviated much of the price surge that would otherwise have occurred. Over the same period, China's exports of refined petroleum products also tumbled. That decline was driven by the authorities' fuel export restrictions, imposed in March soon after the conflict began. Those restrictions were largely lifted only recently, after the US and Iran reached a ceasefire and the Strait reopened. Now that the situation has escalated again, how long the lifting holds remains to be seen. The broader question is how long China can sustain such sharply reduced crude imports. That turns on the size of the reserves it can draw upon, and those figures are undisclosed, with external estimates carrying wide uncertainty.
Chart 3: China crude oil imports, refined oil exports
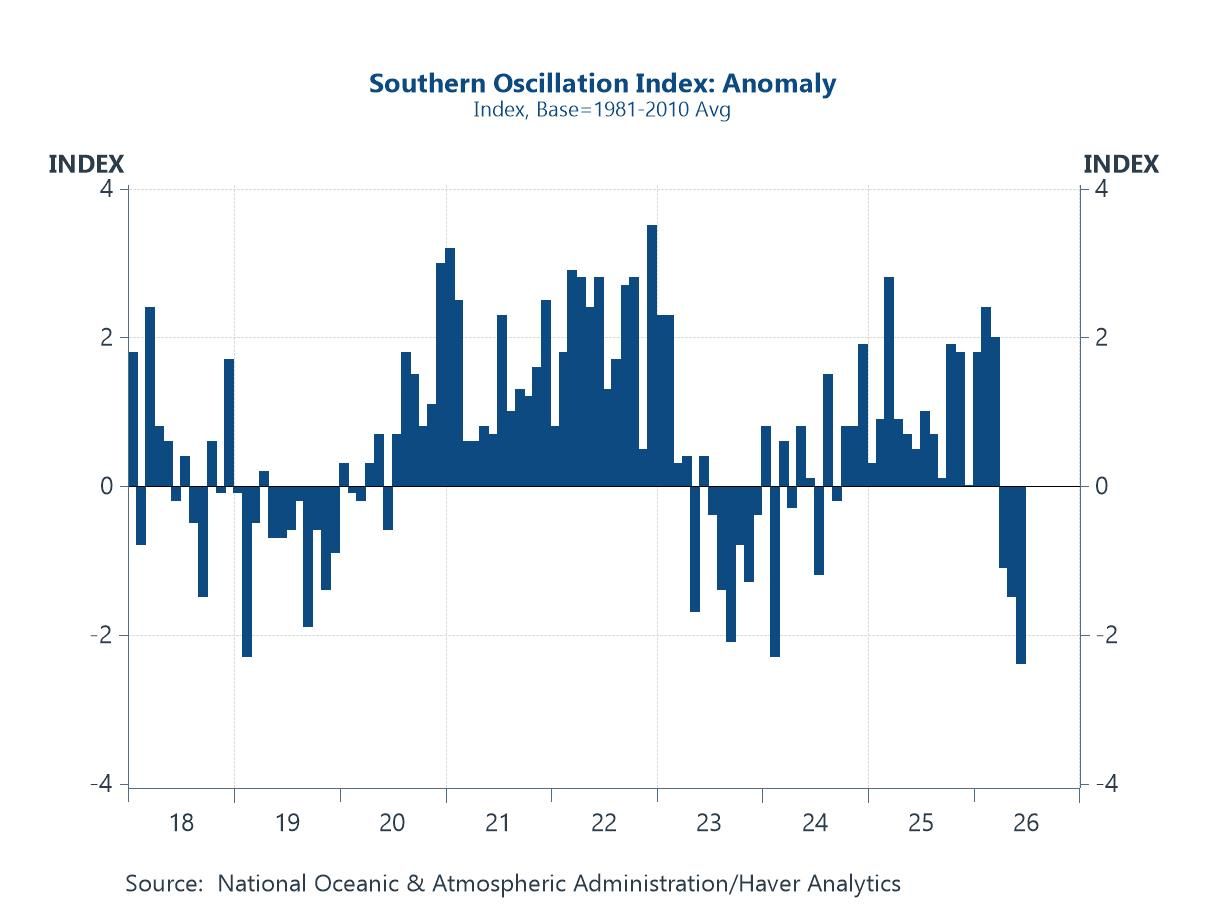
Climate trouble Adding to investor and policymaker concerns is the ongoing El Niño event, which has already formed. Recent Southern Oscillation Index readings offer one line of evidence (chart 4). Agencies such as the US National Oceanic and Atmospheric Administration (NOAA) have confirmed the event separately. Many authorities warn that this year's event is set to be the largest on record. That points to more severe effects than previously seen, from sharply higher global temperatures to flooding and landslides. Crop yields would be among the casualties, and the resulting disruption ultimately amounts to economic losses. Those losses look unlikely to be confined to 2026, since the current Super El Niño is expected to stretch well into next year.
Chart 4: Southern Oscillation Index
Converging on inflation Bringing it all together, three pressures now converge on the inflation outlook. First is a resurgent oil price shock from renewed US-Iran tensions. Layered on top are the potential knock-on effects from the Super El Niño pattern, which run through food crop yields and subsequently food prices. Renewed US tariffs add a third, milder push. Together they threaten to upend the pullback in commodity inflation seen in recent months (chart 5), once again complicating policymaking. That threat has further to run, since the worst of the El Niño price surge may not yet have materialised in full. Should the oil shock persist or worsen alongside it, price pressures would likely be pushed sharply upward. All of this lands on Asian economies already clinging to what few drivers of growth remain, such as the ongoing AI upcycle, while a slew of domestic issues weighs from within.
Chart 5: World commodity inflation
Political troubles? Finally and as an aside, we also explore other economy-specific developments that have been brewing or threaten to evolve into an issue further down the road. These troubles sit on the political front and have, so far, remained contained within their respective economies. Indonesia offers the first case, where central bank governor Perry Warjiyo resigned citing personal reasons, adding a layer of uncertainty. The timing sharpens it, with the rupiah already under protracted weakness (chart 6). Compounding that, Indonesia's President continues to pursue loose fiscal policy in an attempt to boost growth. Japan presents a different kind of pressure, with Prime Minister Takaichi's cabinet approval rating diving 10pp in the latest Nikkei and TV Tokyo poll. That took it below 60% for the first time since she took office last October, with perceived reasons for the decline varying. The resulting 58% rating is still comparatively high by historical standards. Even so, an extended slide from here could spell deeper underlying perception issues.
Chart 6: Indonesian equities and the rupiah

Tian Yong Woon
AuthorMore in Author Profile »Tian Yong joined Haver Analytics as an Economist in 2023. Previously, Tian Yong worked as an Economist with Deutsche Bank, covering Emerging Asian economies while also writing on thematic issues within the broader Asia region. Prior to his work with Deutsche Bank, he worked as an Economic Analyst with the International Monetary Fund, where he contributed to Article IV consultations with Singapore and Malaysia, and to the regular surveillance of financial stability issues in the Asia Pacific region.
Tian Yong holds a Master of Science in Quantitative Finance from the Singapore Management University, a Master of Science in Analytics from the Georgia Institute of Technology, a Bachelor of Science in Mathematics from the Singapore University of Social Sciences, and a Bachelor of Science in Banking and Finance from the University of London.
More Economy in Brief