Global| Sep 17 2026
Charts of the Week: The Price of Money
by:Andrew Cates
|in:Economy in Brief
Summary
The cost of energy and the cost of money set the tone this week. Brent crude held above $100 a barrel with a major Saudi pipeline still offline, and the Federal Reserve raised the federal funds rate by a quarter point, its first increase since 2023. The projections accompanying the decision mattered more than the decision itself, and futures have since priced a policy rate by the middle of 2027 above anything the committee has pencilled in, with the ten-year Treasury yield through 5 per cent for the first time since 2007 (chart 1). But the source of that tightening is worth dwelling on, because American companies are not competing for credit. The non-financial corporate sector is generating more cash than it spends, and has been for most of the past four years (chart 2). Forecasters have meanwhile spent the summer nudging growth forecasts up and inflation forecasts down for this year, with Taiwan and Korea marked up by some distance the most (chart 3). Britain provided a counterpoint, with pay growth and vacancies both back at or below pre-pandemic norms ahead of the Bank of England’s decision (chart 4). China’s August figures showed industrial output accelerating while investment contracted more deeply (chart 5). And Korean customs data for the first ten days of September gave yet another reading of how much of world trade now runs through a single product (chart 6).
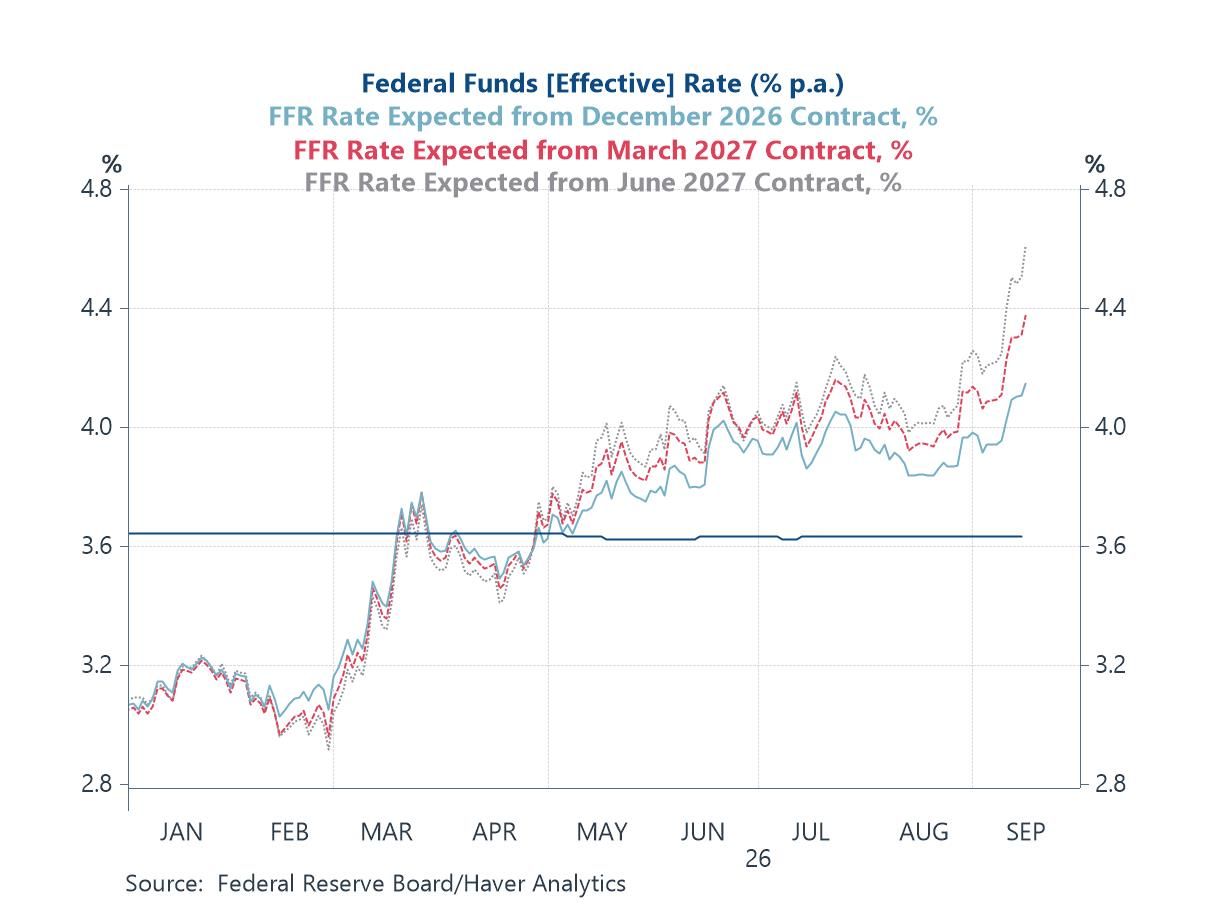
From easing to tightening Market expectations concerning Fed policy have turned completely since January. Contracts covering December 2026 and the first half of 2027 then implied a federal funds rate a little above 3 per cent, comfortably below the rate the Fed was actually running, and an easing cycle was the base case. That gap closed in March and has since inverted, with the move accelerating over the past fortnight. Energy is the immediate cause. The conflict with Iran has kept crude above $100 a barrel, and August’s inflation report showed the pass-through into core prices that policymakers had hoped to avoid. This week’s quarter-point increase was accordingly almost fully priced beforehand and settled little on its own. The framing around it was another matter. Sixteen of the eighteen participants who submitted projections expect at least one further increase this year, four of them two, and the median path is held at around 4.1 per cent through the end of next year with no cuts at all. Chair Warsh’s insistence on a timelier return to target was taken as ruling out an early reversal, and equities gave up their initial gains as he spoke. Futures now sit above the committee’s own path by the middle of 2027, and the long end has followed rather than steadied. A policy rate expected to approach 4.5 per cent alongside a ten-year yield above 5 per cent speaks to term premia as much as to the Fed.
Chart 1: US policy rate expectations have moved from easing to tightening
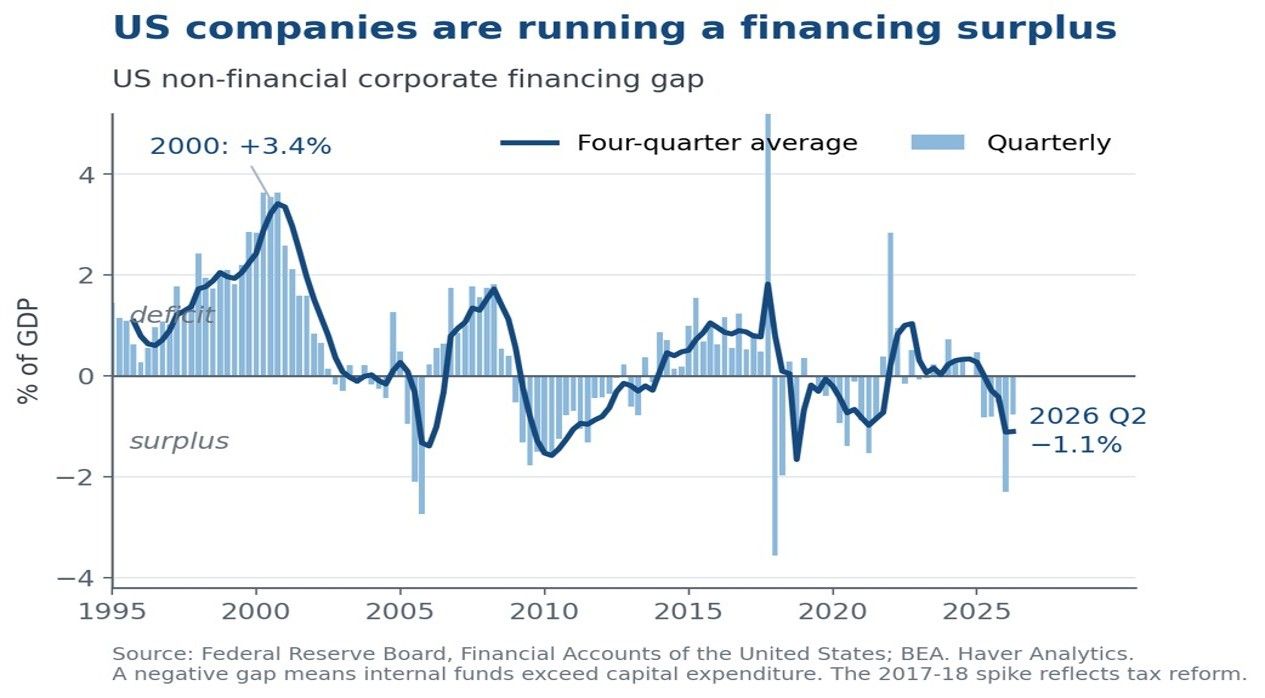
Who is paying for the boom The tightening is arguably not the product of corporate borrowing. The latest US financial accounts reveal that American non-financial companies ran a financing surplus of around 1 per cent of GDP in Q1, which is to say that internal cash flow more than covered their capital spending. The position has held for most of the past four years, and it stands in contrast to 2000, when the sector was running a deficit of more than 3 per cent of GDP at the peak of the last (internet-led) investment cycle. That distinction matters for how the present boom is read. Aggregates conceal distribution, and a small number of hyperscalers and data-centre developers have turned to bond and private credit markets on a scale that unsettled equity investors in recent weeks. At the level of the aggregate sector, however, the marginal claim on the US saving is coming from the US government rather than from companies.
Chart 2: US non-financial companies are generating more cash than they invest
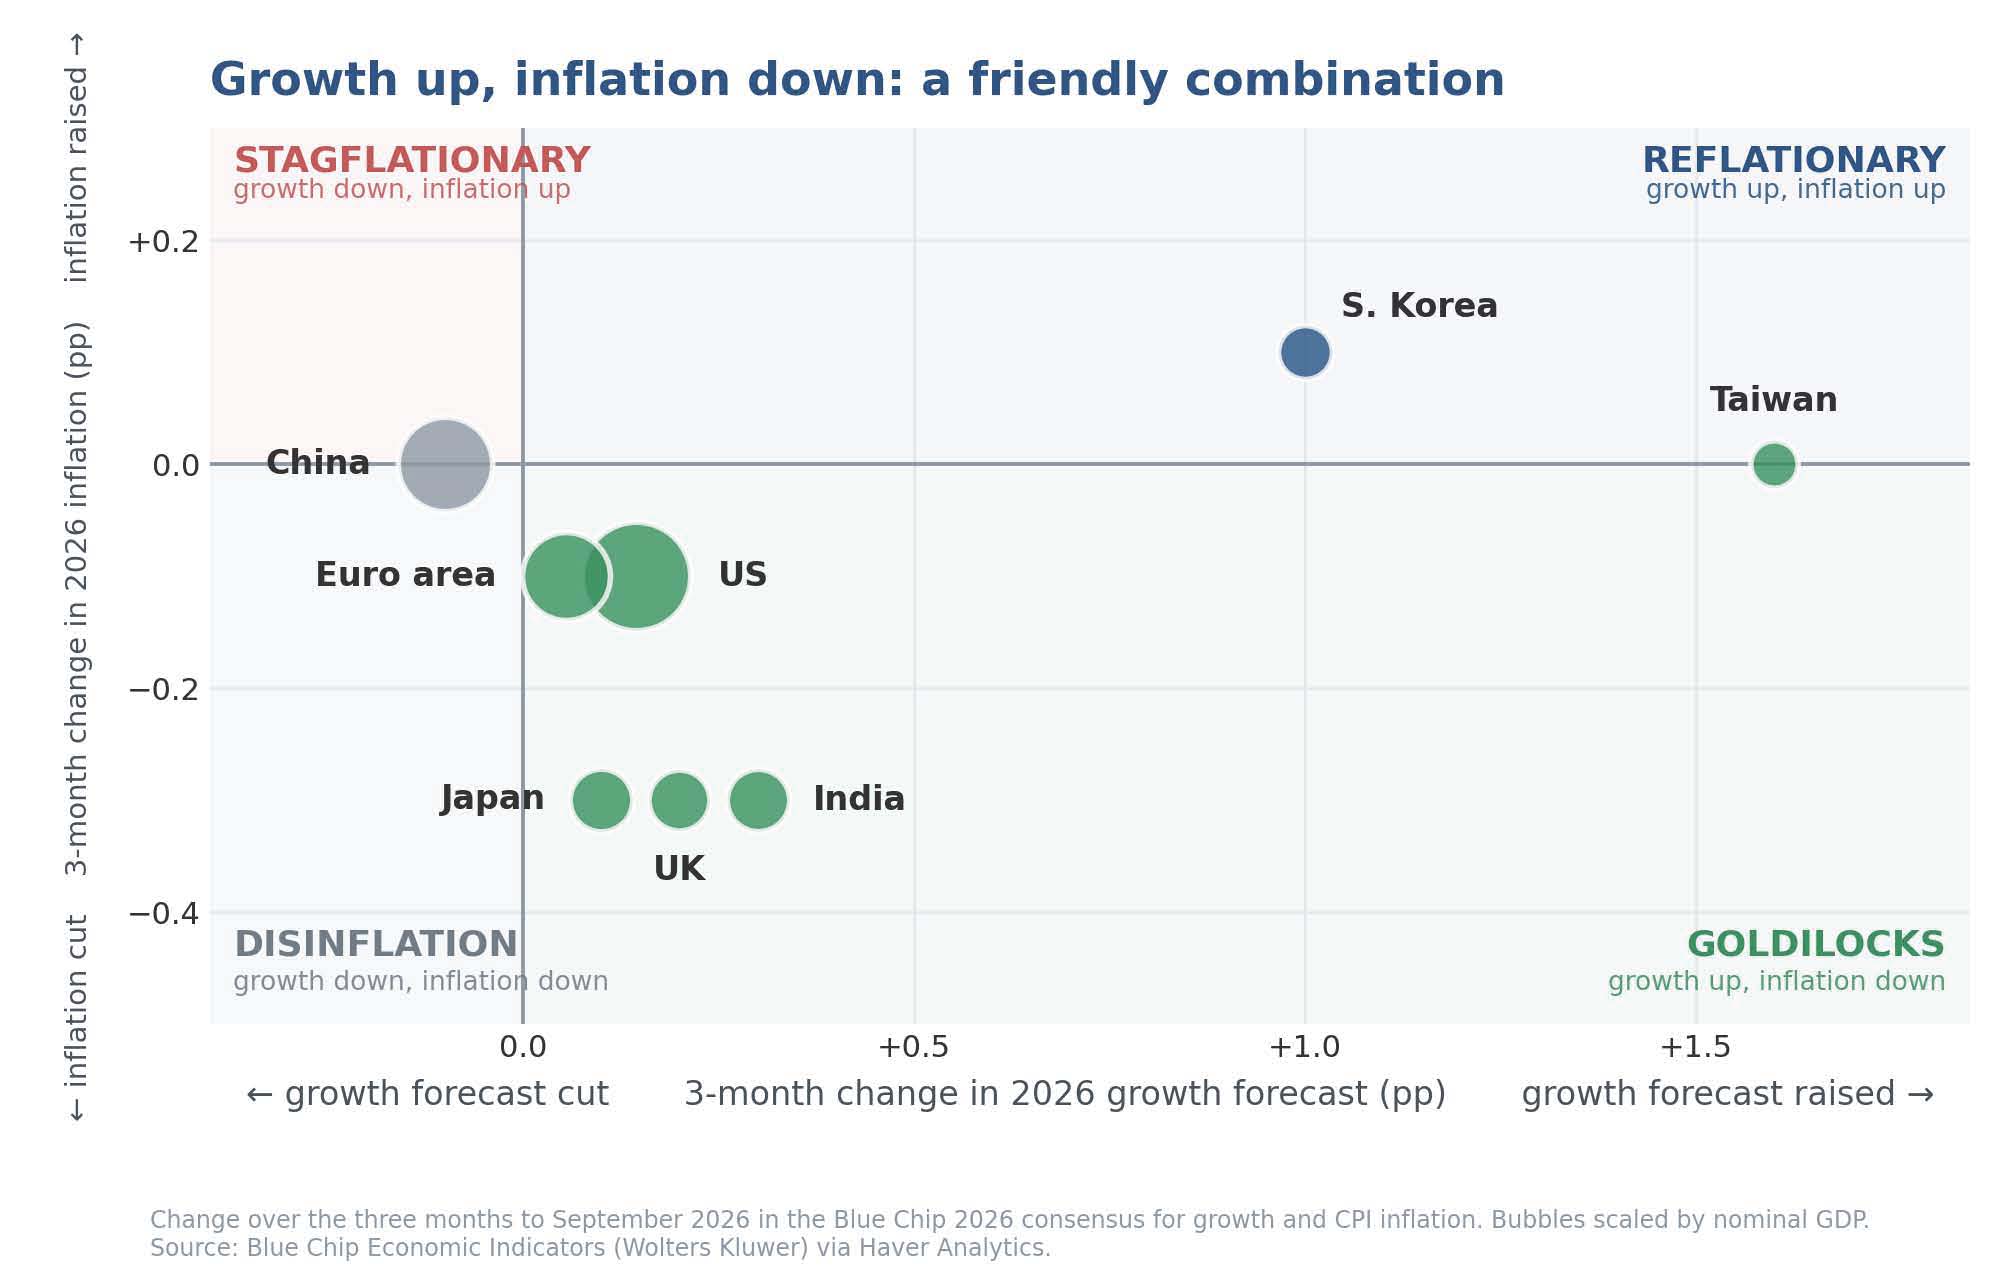
A friendlier mix, for now The latest September survey reveals that the Blue Chip panel has made much the same adjustment almost everywhere in recent months: growth for this year has been revised up, inflation for this year revised down. Taiwan and Korea account for the largest growth upgrades, both for the same AI-related reasons, while the United States, the euro area, Japan, the United Kingdom and India all sit in the same quadrant on a more modest scale. China alone (in our sample in the chart below) has seen neither forecast moved. The combination reads well, but it needs qualifying. With a fixed target year this far advanced, most of the 2026 inflation number is already determined by outturns, so marking it down is largely a verdict on the first half of the year rather than on the energy shock now working through.
Chart 3: Three-month revisions to the Blue Chip consensus for 2026
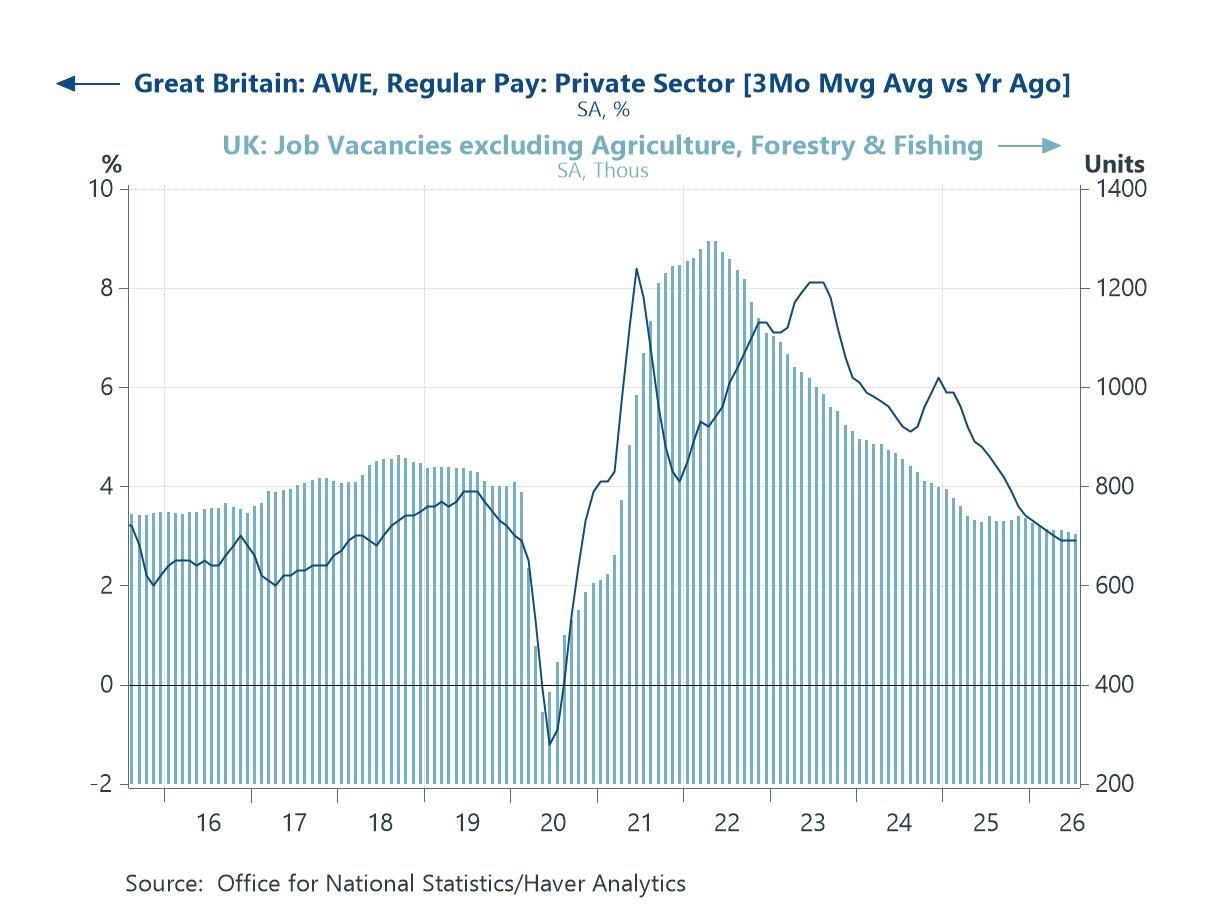
The UK’s quiet labour market The UK labour market is no longer adding much to inflation pressure. Private-sector regular pay is growing at around 3 per cent, the slowest rate since 2020 and below its average in the years before the pandemic. Vacancies have fallen to just over 700,000, the lowest outside the pandemic period since 2014, and payrolled employment declined again in August, leaving it around 145,000 lower than a year earlier. Unemployment, at 4.9 per cent, is up on the year. Smaller firms continue to tell the official vacancy survey that they are holding back from recruitment because of labour costs. None of this settles the Bank of England's decision later this week, since the inflation problem is arriving from outside rather than from wages.
Chart 4: UK pay growth and vacancies have returned to pre-pandemic norms
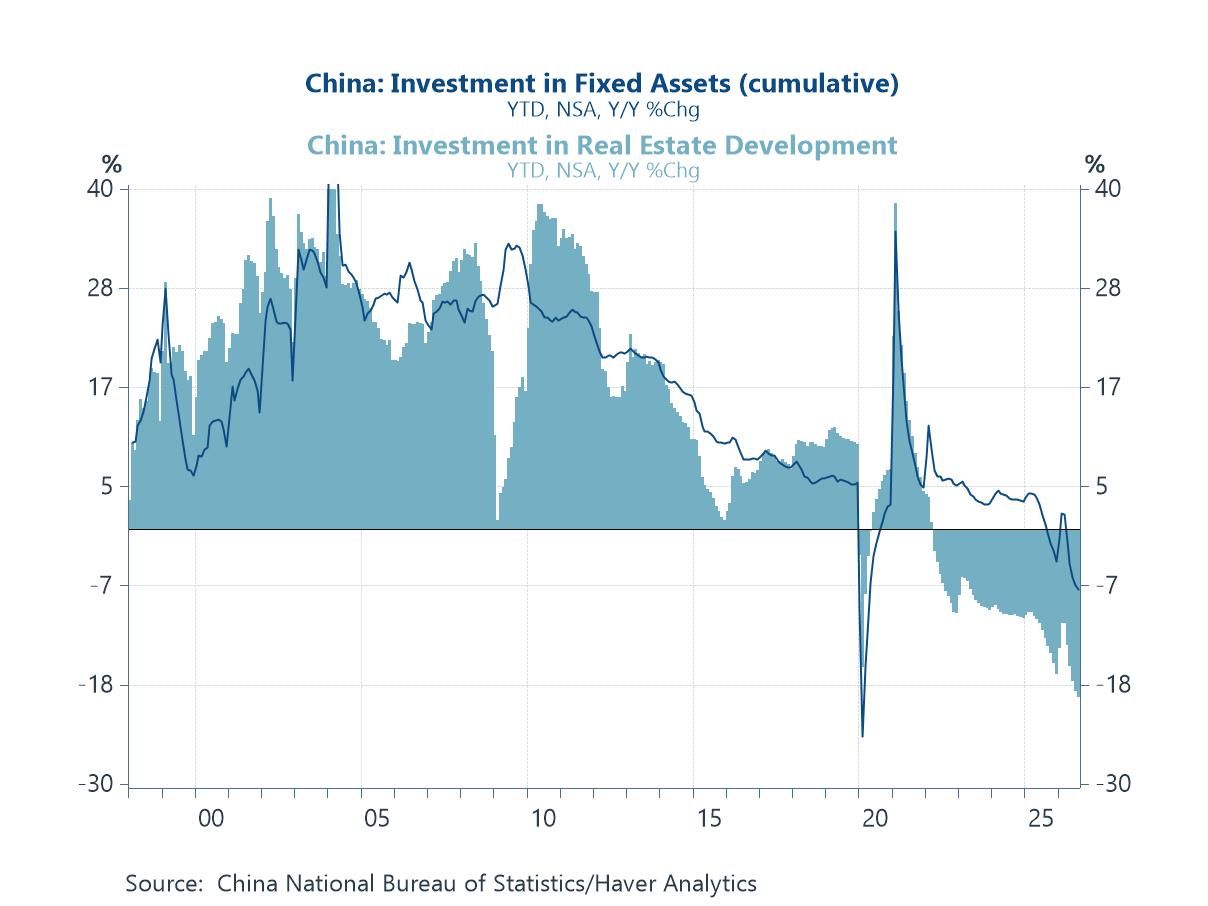
China is producing strongly but spending weakly China's August data extended a familiar divergence. Industrial output accelerated 5.2% y/y in August after 4.5% in July, beating expectations despite four typhoons disrupting activity along the east coast. Retail sales, in contrast, grew by just 0.4%. Fixed investment in the first eight months was more than 7 per cent lower than a year earlier, a deeper contraction than through July, and investment in real estate development fell by close to a fifth. The weakness is no longer confined to property: total fixed investment turned negative last year and the pace of decline has steepened since, with private investment contracting while state-owned enterprises hold the total up. For the rest of the world the arithmetic is straightforward. An economy producing strongly and consuming weakly exports the difference, and potentially exports disinflation with it. That makes China a partial offset to the energy shock elsewhere, and raises the odds of further domestic stimulus in the immediate weeks ahead.
Chart 5: China's investment contraction has spread beyond property
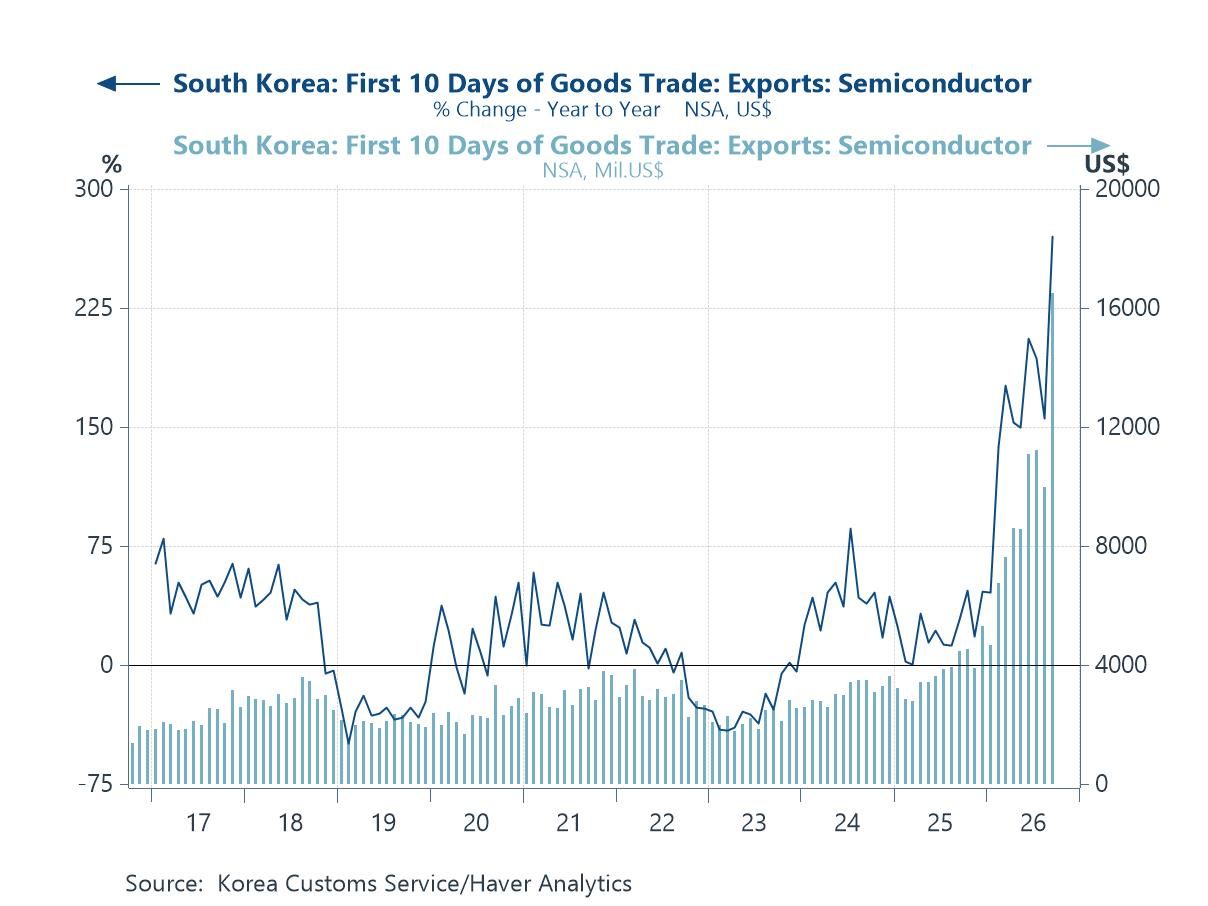
Ten days in September Korean customs data offer the earliest and cleanest reading on global technology demand, and the first ten days of September produced some of the largest numbers on record. Semiconductor shipments were worth $16.5 billion in that window, close to three and a half times their value a year earlier, and accounted for 47 per cent of all Korean exports. Total exports rose by more than 80 per cent, with shipments to China doubling and those to the United States more than doubling. This is the phenomenon behind the Taiwanese and Korean forecast upgrades noted above, and it is the physical counterpart of the capital spending recorded in the American accounts. It also concentrates risk. Close to half the export earnings of a major economy now rest on a single investment theme, financed in part by borrowing whose terms are set in the market that has repriced in recent weeks.
Chart 6: South Korean semiconductor exports in the first ten days of the month

Andrew Cates
AuthorMore in Author Profile »Andy Cates joined Haver Analytics as a Senior Economist in 2020. Andy has more than 25 years of experience forecasting the global economic outlook and in assessing the implications for policy settings and financial markets. He has held various senior positions in London in a number of Investment Banks including as Head of Developed Markets Economics at Nomura and as Chief Eurozone Economist at RBS. These followed a spell of 21 years as Senior International Economist at UBS, 5 of which were spent in Singapore. Prior to his time in financial services Andy was a UK economist at HM Treasury in London holding positions in the domestic forecasting and macroeconomic modelling units. He has a BA in Economics from the University of York and an MSc in Economics and Econometrics from the University of Southampton.
More Economy in Brief