

U.S. Retail Sales Rebound in August, Exceeding Forecasts
Summary
- Total retail sales +1.2% (+6.0% y/y) in August; sixth m/m increase in seven mths.
- Ex-auto sales +1.4% (+6.9% y/y), first m/m rise since May; auto sales +0.6% (+2.1% y/y), third rise in four mths.
- Ex-gas sales +1.1% (+4.9% y/y) and ex-auto & gas sales +1.2% (+5.6% y/y); both up m/m from Jan. through Aug. except July.
- Retail control group +1.4% (+5.6% y/y), seventh m/m gain in eight mths., pointing to solid underlying consumer demand in Q3 ’26.
- Gains m/m: gasoline stations (+3.1%), nonstore sales (+2.6%), misc. stores (+1.9%), electronics stores (+1.6%).
- Declines m/m: department stores (-0.8%), building materials & garden equipt. stores (-0.2%).
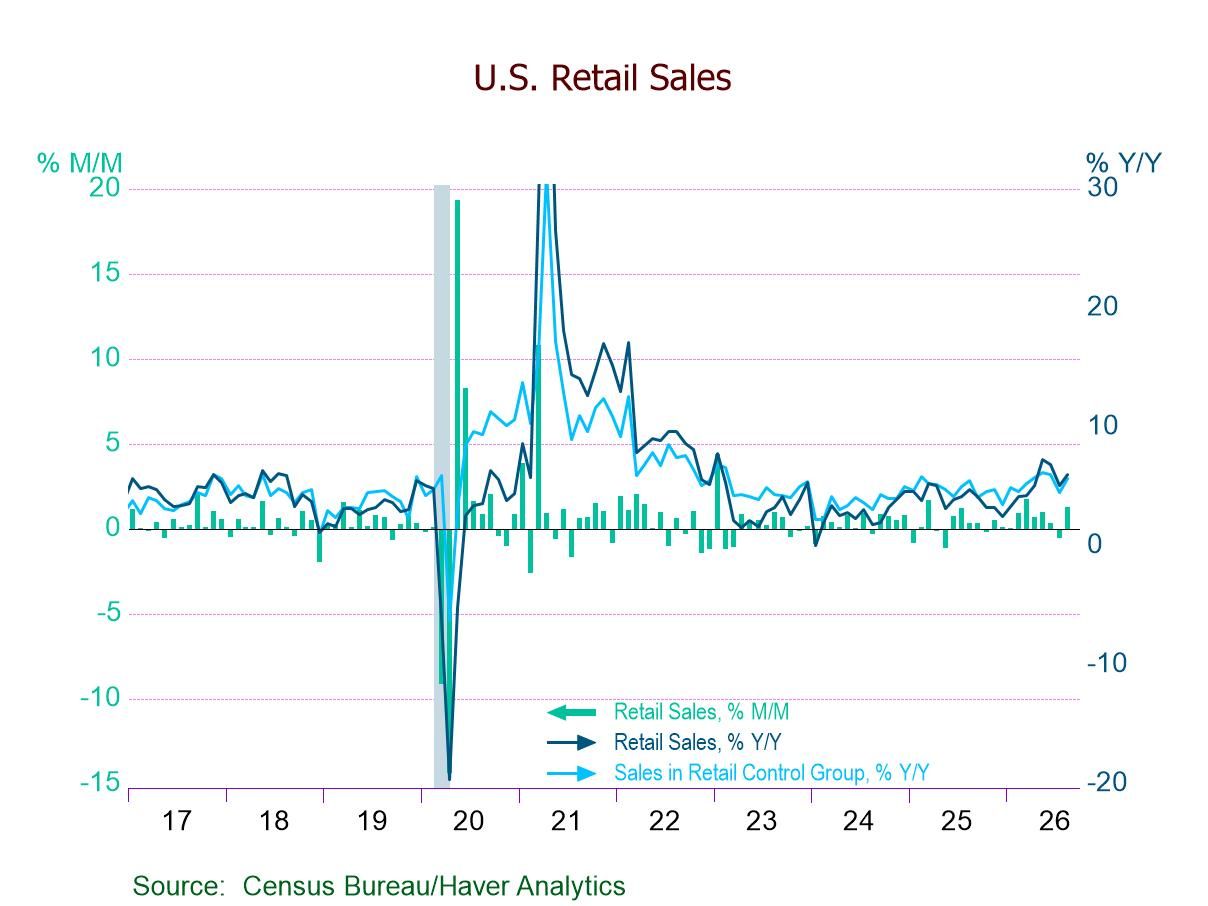
Total retail sales rose a larger-than-expected 1.2% m/m to $773.9 billion in August, the sixth monthly gain in seven months, after a 0.5% decline in July (-0.6% initially) and a 0.3% increase in June (+0.2% previously), data from the U.S. Census Bureau showed, pointing to resilient consumer spending and solid domestic demand in Q3 2026. A 0.8% m/m August rise had been expected in the Action Economics Forecast Survey. The year-on-year growth rate accelerated to 6.0% in August from 5.0% in July (4.7% in August 2025), while remaining well below a high of 17.1% in February 2022 and a record high of 51.8% in April 2021.
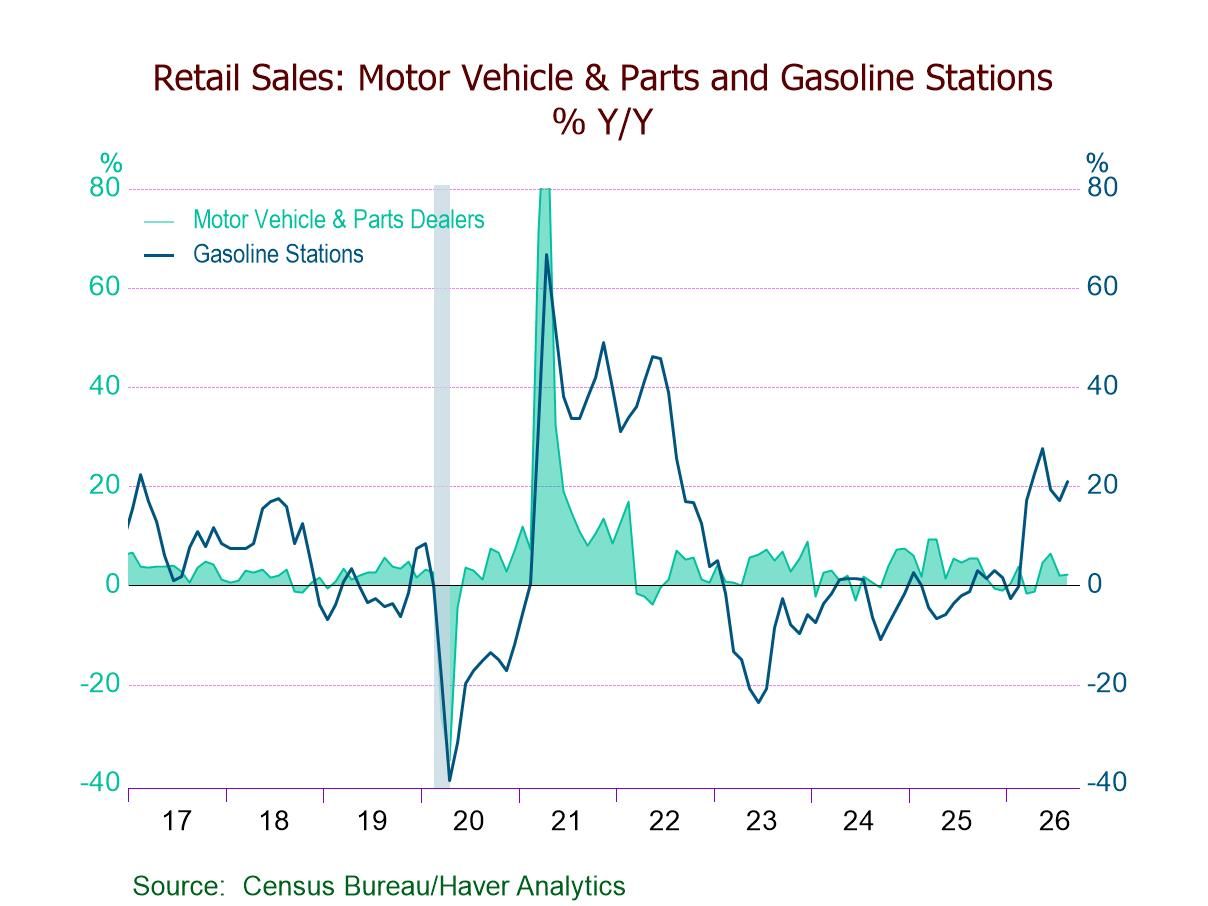
Excluding motor vehicles & parts, retail sales grew a greater-than-expected 1.4% (6.9% y/y) in August, the first m/m rise since May, following a 0.2% decline in July (-0.3% initially). A 0.5% m/m August increase had been expected. Sales of motor vehicles & parts rose 0.6% (2.1% y/y), up for the third time in four months, after a 1.8% July drop; this compared to a 2.0% gain (1.3% y/y) in unit light vehicle sales following a 1.0% July decrease.
Sales in the retail control group, which excludes autos, building materials, gasoline stations, and food services, rebounded 1.4% (5.6% y/y) in August, the seventh m/m gain in eight months, following a 0.4% decline in July, pointing to solid underlying consumer demand in Q3 2026. These sales are used in the construction of personal consumption expenditures in NIPA accounts. Nonauto sales excluding gasoline & building materials climbed 1.3% (5.7% y/y), up for the seventh time in eight months, after a 0.2% July decline.
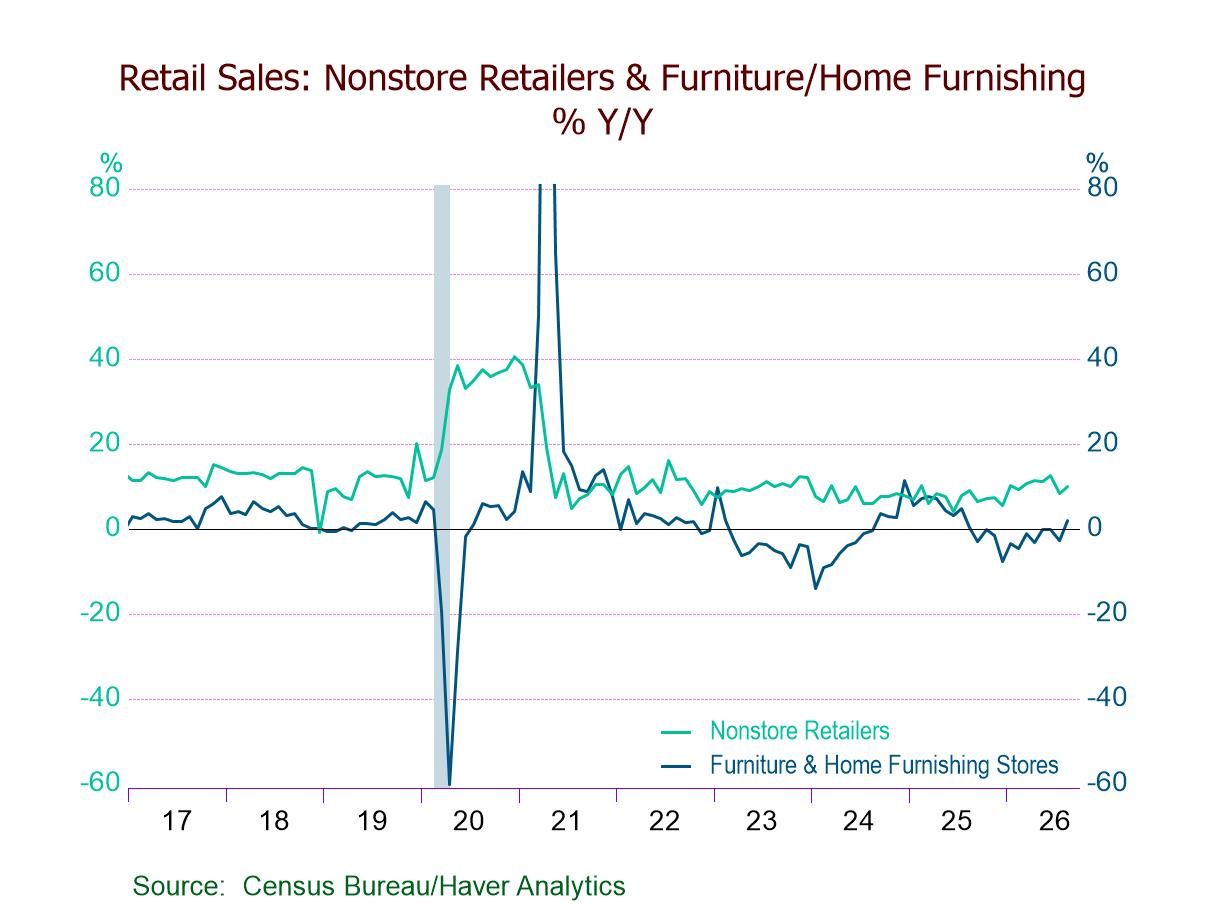
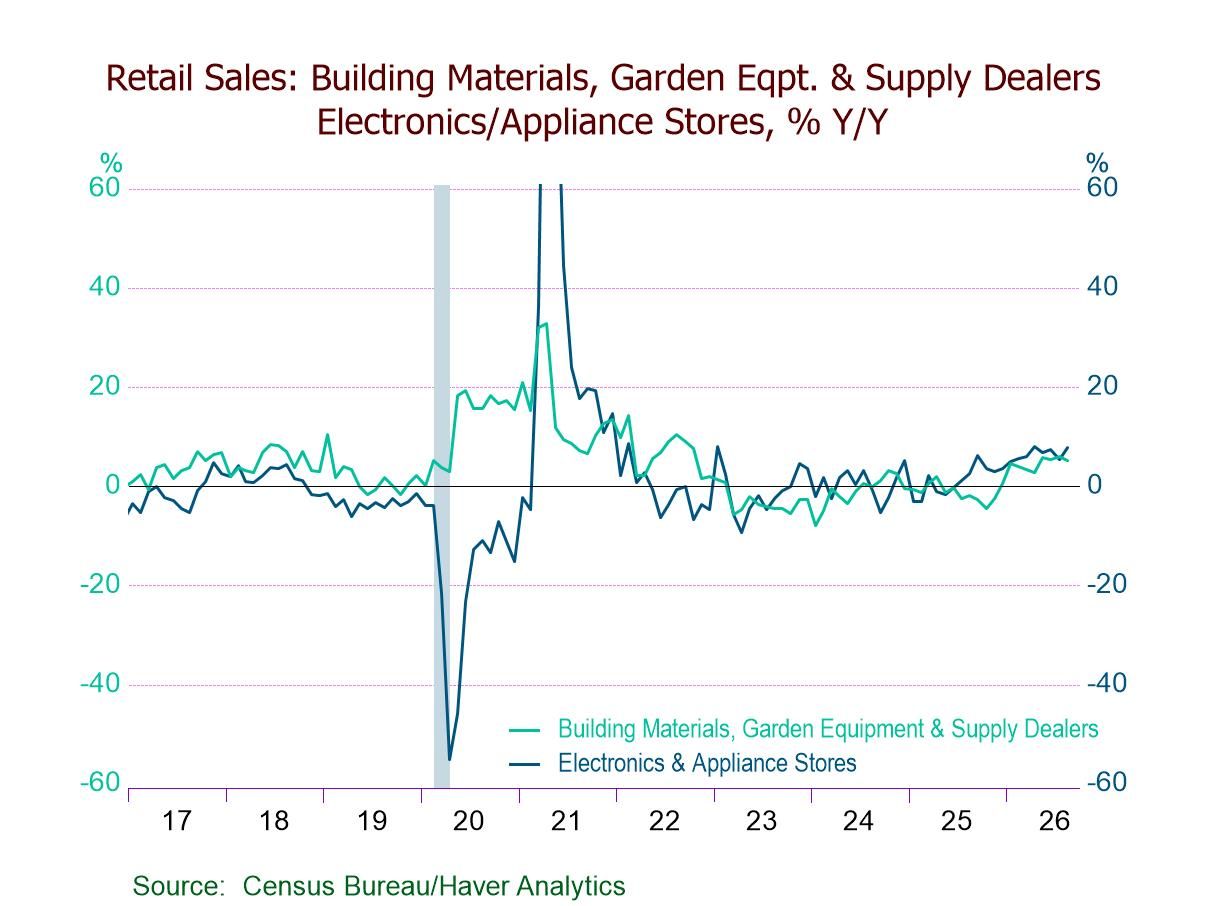
Sales by category mostly increased in August. Posting the largest m/m gain among major categories, gasoline station sales jumped 3.1% (21.0% y/y) in August, the first m/m increase since May, after a 0.2% decrease in July. Nonstore retail sales recovered 2.6% (9.9% y/y), the seventh rise in eight months, following a 1.7% July drop. Miscellaneous store sales rebounded 1.9% (14.0% y/y), the third m/m gain in four months, after a 0.6% July slide. Electronics & appliance store sales rose 1.6% (7.8% y/y), the second m/m increase in three months, following a 0.1% July slip. Sporting goods, hobby, book & music store sales advanced 1.2% (10.7% y/y), the seventh consecutive m/m gain, on top of a 0.2% July increase. Furniture & home furnishing store sales grew 0.9% (1.9% y/y), the first m/m rise in three months, after a 0.2% July decline. Clothing & accessory store sales rose 0.7% (4.3% y/y), up for the third time in four months, following a 1.3% July gain. Meanwhile, general merchandise store sales climbed 0.7% (4.5% y/y) in August after a 0.5% increase in July; within this category, department store sales fell 0.8% (+1.9% y/y) following a flat July reading. Building materials & garden equipment store sales decreased 0.2% (+5.1% y/y) following a downwardly revised 0.1% decline in July (+0.3% initially) and eight straight m/m gains.
In the nondiscretionary sales categories, health & personal care store sales rose 0.9% (+1.9% y/y) in August, the third m/m rise in four months, after a 0.3% increase in July. Food & beverage store sales recovered 0.4% (0.5% y/y) after declining 0.2% in July and June.
Consumers appeared to dine out more frequently in August despite still-elevated inflation (August CPI +0.4% m/m, +3.4% y/y; core CPI +0.3% m/m, +2.4% y/y). Restaurant & drinking place sales advanced 1.2% (+5.8% y/y) in August, the fifth successive m/m gain, after a 0.5% increase in July.
Note: The Federal Reserve unanimously voted to raise its benchmark interest rate by 25 basis points to a target range of 3.75% to 4.00%. The statement issued following today's FOMC meeting is available here.
Retail Sales data can be found in Haver's USECON database. The expectations figures are from the Action Economics Forecast Survey in AS1REPNA.

Winnie Tapasanun
AuthorMore in Author Profile »Winnie Tapasanun has been working for Haver Analytics since 2013. She has 20+ years of working in the financial services industry. As Vice President and Economic Analyst at Globicus International, Inc., a New York-based company specializing in macroeconomics and financial markets, Winnie oversaw the company’s business operations, managed financial and economic data, and wrote daily reports on macroeconomics and financial markets. Prior to working at Globicus, she was Investment Promotion Officer at the New York Office of the Thailand Board of Investment (BOI) where she wrote monthly reports on the U.S. economic outlook, wrote reports on the outlook of key U.S. industries, and assisted investors on doing business and investment in Thailand. Prior to joining the BOI, she was Adjunct Professor teaching International Political Economy/International Relations at the City College of New York. Prior to her teaching experience at the CCNY, Winnie successfully completed internships at the United Nations. Winnie holds an MA Degree from Long Island University, New York. She also did graduate studies at Columbia University in the City of New York and doctoral requirements at the Graduate Center of the City University of New York. Her areas of specialization are international political economy, macroeconomics, financial markets, political economy, international relations, and business development/business strategy. Her regional specialization includes, but not limited to, Southeast Asia and East Asia. Winnie is bilingual in English and Thai with competency in French. She loves to travel (~30 countries) to better understand each country’s unique economy, fascinating culture and people as well as the global economy as a whole.
More Economy in Brief
 Global