U.S. Import and Export Prices Jump in August
by:Sandy Batten
|in:Economy in Brief
Summary
- Counter to market expectations for small declines, both import and export prices rose meaningfully in August.
- Import prices increased 0.7% m/m while export prices rose 0.6% m/m. Both had fallen in June and July, helped by falling petroleum prices.
- Petroleum prices edged up 0.1% m/m in August.
- Price increases were relatively widespread across end-use categories.
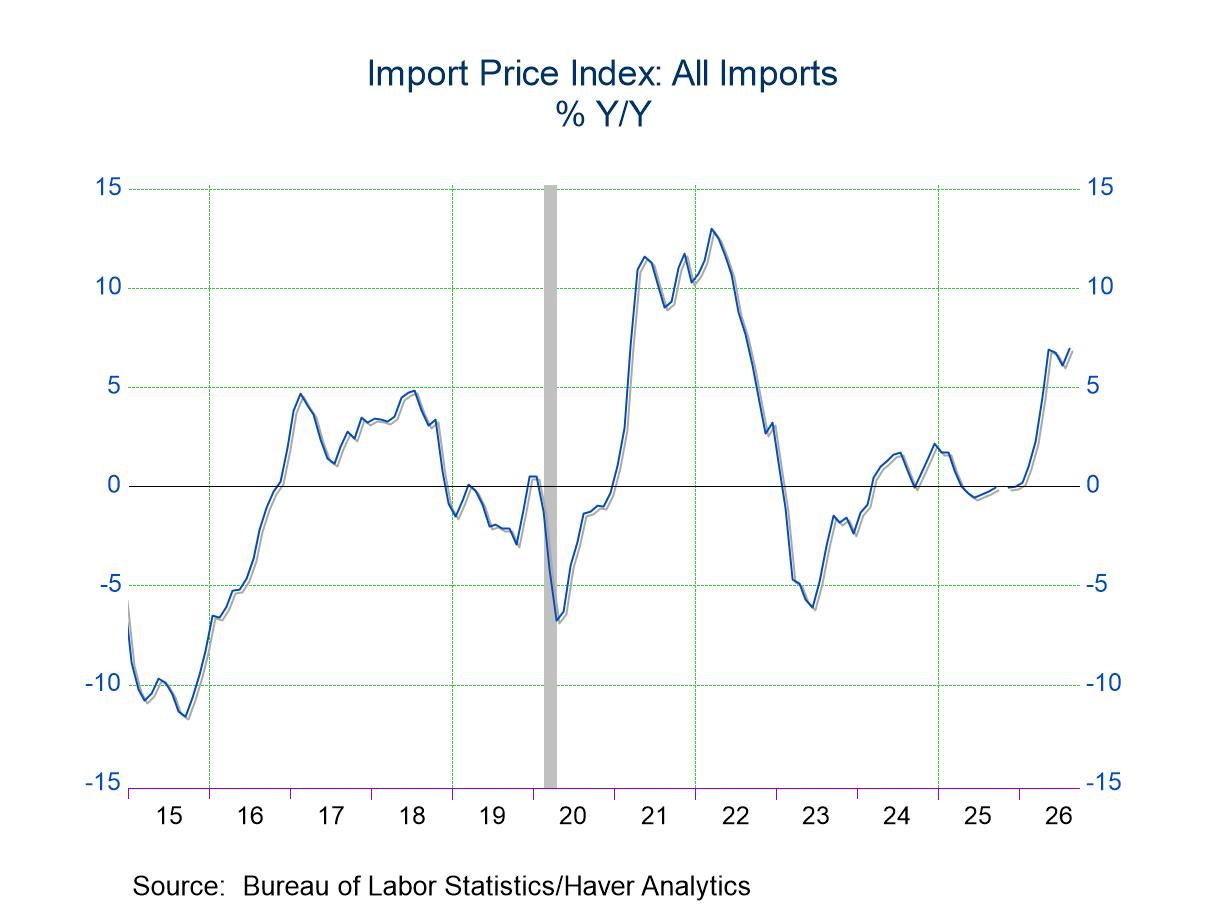
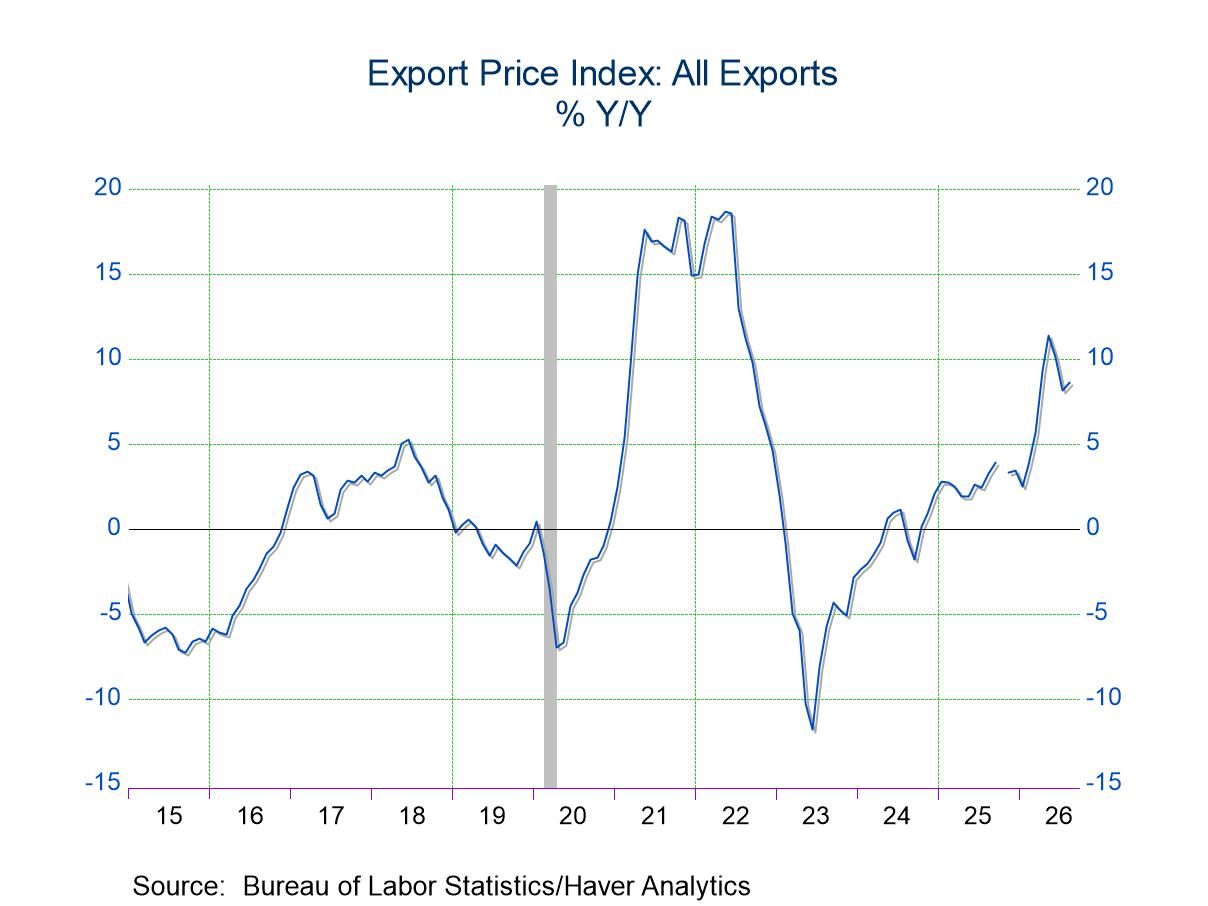
Import prices increased 0.7% m/m (7.0% y/y) in August after a revised 0.3% m/m decline in July (previously -0.4% m/m). The Action Economics Forecast Survey looked for a 0.1% m/m decline. Export prices increased 0.6% m/m (8.6% y/y) in August following monthly declines in both June and July. The Action Economics Survey expected a 0.5% m/m decline. Note that import and export price indexes are not directly affected by tariffs because they measure the prices of goods before taxes. Tariffs are classified as taxes and therefore are excluded from these calculations.
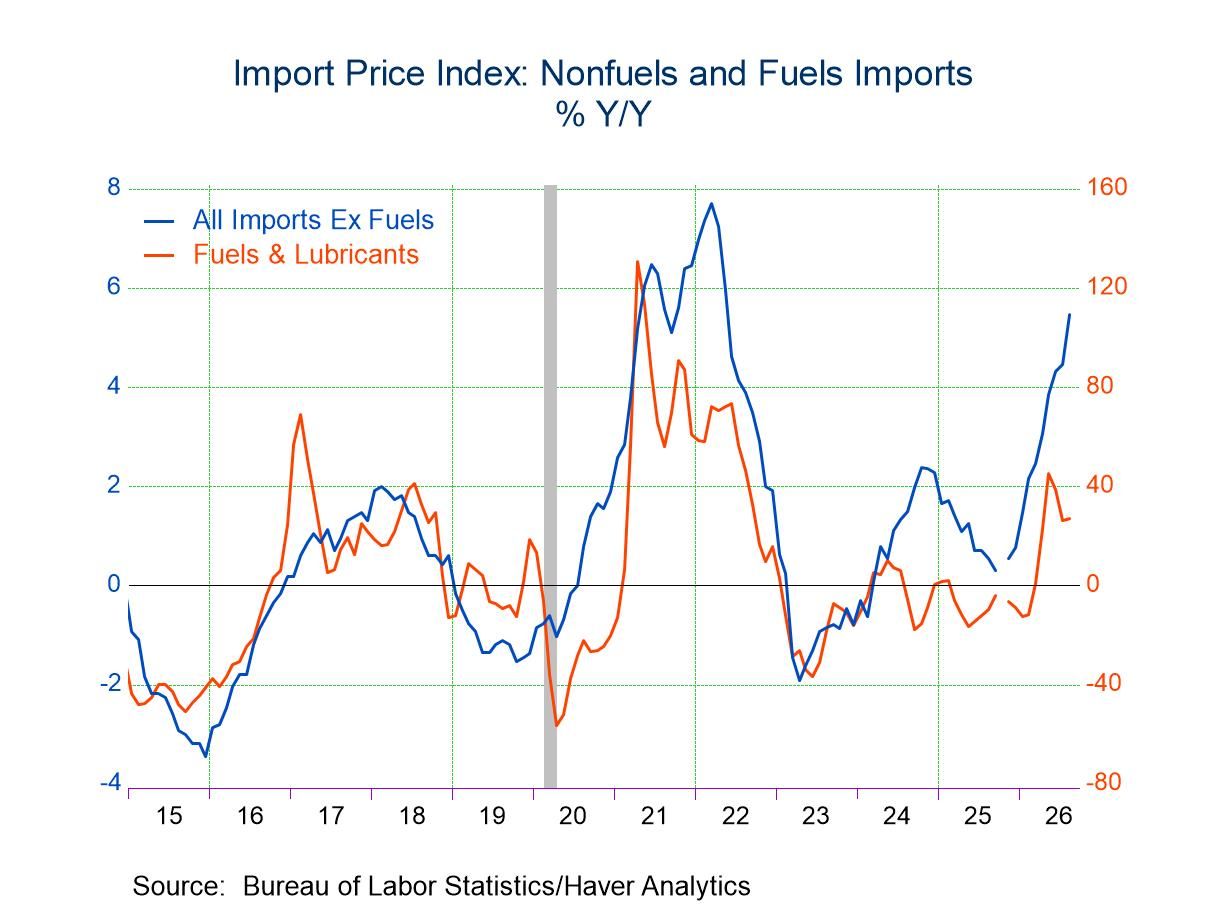
Declines in petroleum prices led to monthly declines in the overall import and export prices in both June and July. However, petroleum prices edged up 0.1% m/m in August. Import prices excluding petroleum jumped 0.8% m/m (5.5% y/y) in August, the largest monthly increase in four months and the highest y/y rate since May 2022. Higher prices for nonfuel industrial supplies and materials (2.0% m/m, the largest monthly increase since February), capital goods (0.9% m/m) and consumer goods excluding automotives (0.5% m/m) drove the increase in August.
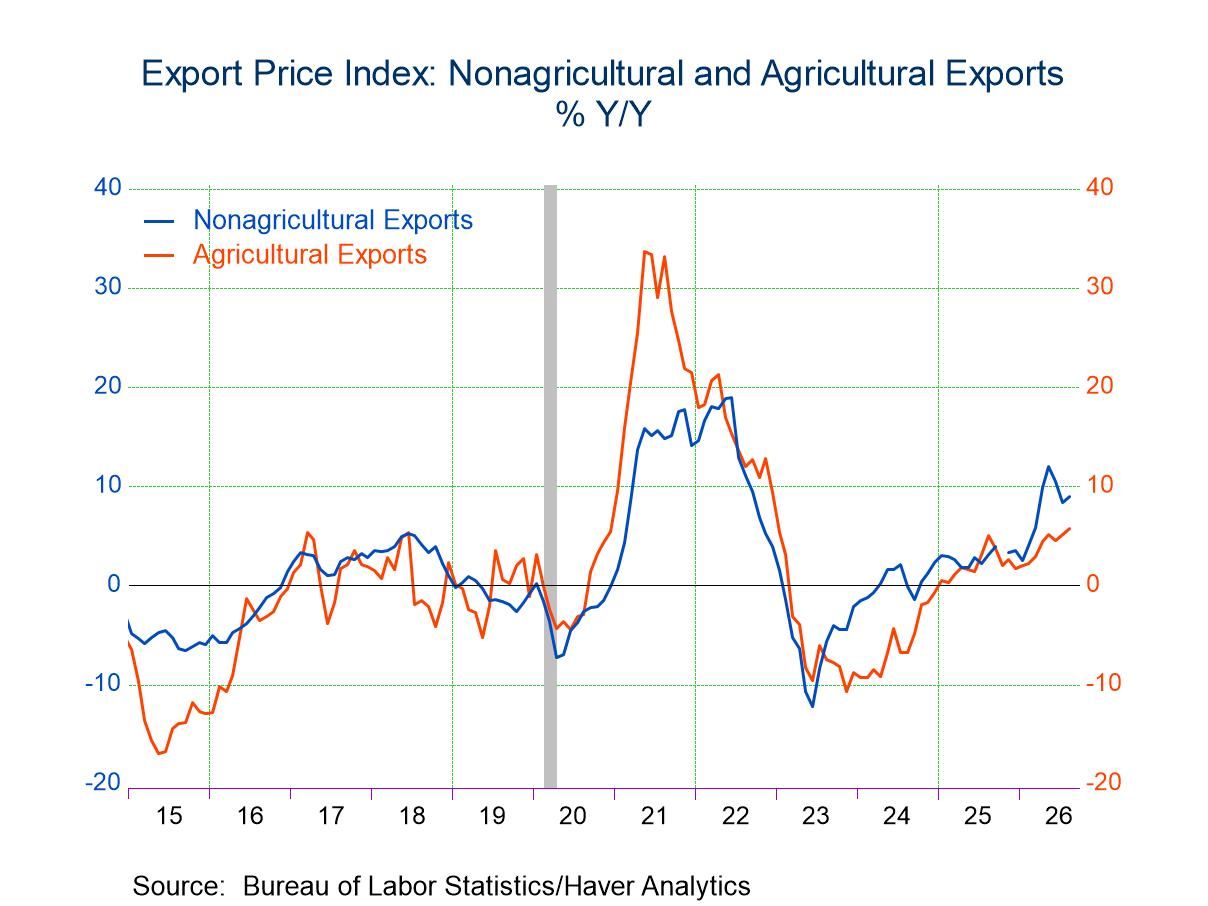
Agricultural export prices rose 0.5% m/m (5.8% y/y) in August while nonagricultural export prices jumped 0.7% m/m (8.9% y/y), the first monthly increase in three months. Agricultural export prices have not declined on a monthly basis since December 2025. Higher prices for corn and animal feeds more than offset lower prices for meat. Nonagricultural export prices had fallen in both June and July, aided by falling petroleum prices. Higher prices for nonagricultural industrial supplies and materials (1.4% m/m after declines in both June and July), capital goods (0.2% m/m) and automotive vehicles, parts, and engines (0.3% m/m) drove the increase.
These import and export price series are not seasonally adjusted; they can be found in Haver’s USECON database. Detailed figures are available in the USINT database. The expectations figure from the Action Economics Forecast Survey is in the AS1REPNA database.

Sandy Batten
AuthorMore in Author Profile »Sandy Batten has more than 30 years of experience analyzing industrial economies and financial markets and a wide range of experience across the financial services sector, government, and academia. Before joining Haver Analytics, Sandy was a Vice President and Senior Economist at Citibank; Senior Credit Market Analyst at CDC Investment Management, Managing Director at Bear Stearns, and Executive Director at JPMorgan. In 2008, Sandy was named the most accurate US forecaster by the National Association for Business Economics. He is a member of the New York Forecasters Club, NABE, and the American Economic Association. Prior to his time in the financial services sector, Sandy was a Research Officer at the Federal Reserve Bank of St. Louis, Senior Staff Economist on the President’s Council of Economic Advisors, Deputy Assistant Secretary for Economic Policy at the US Treasury, and Economist at the International Monetary Fund. Sandy has taught economics at St. Louis University, Denison University, and Muskingun College. He has published numerous peer-reviewed articles in a wide range of academic publications. He has a B.A. in economics from the University of Richmond and a M.A. and Ph.D. in economics from The Ohio State University.
More Economy in Brief
 Global