IP in EMU Shows Weakness Persists
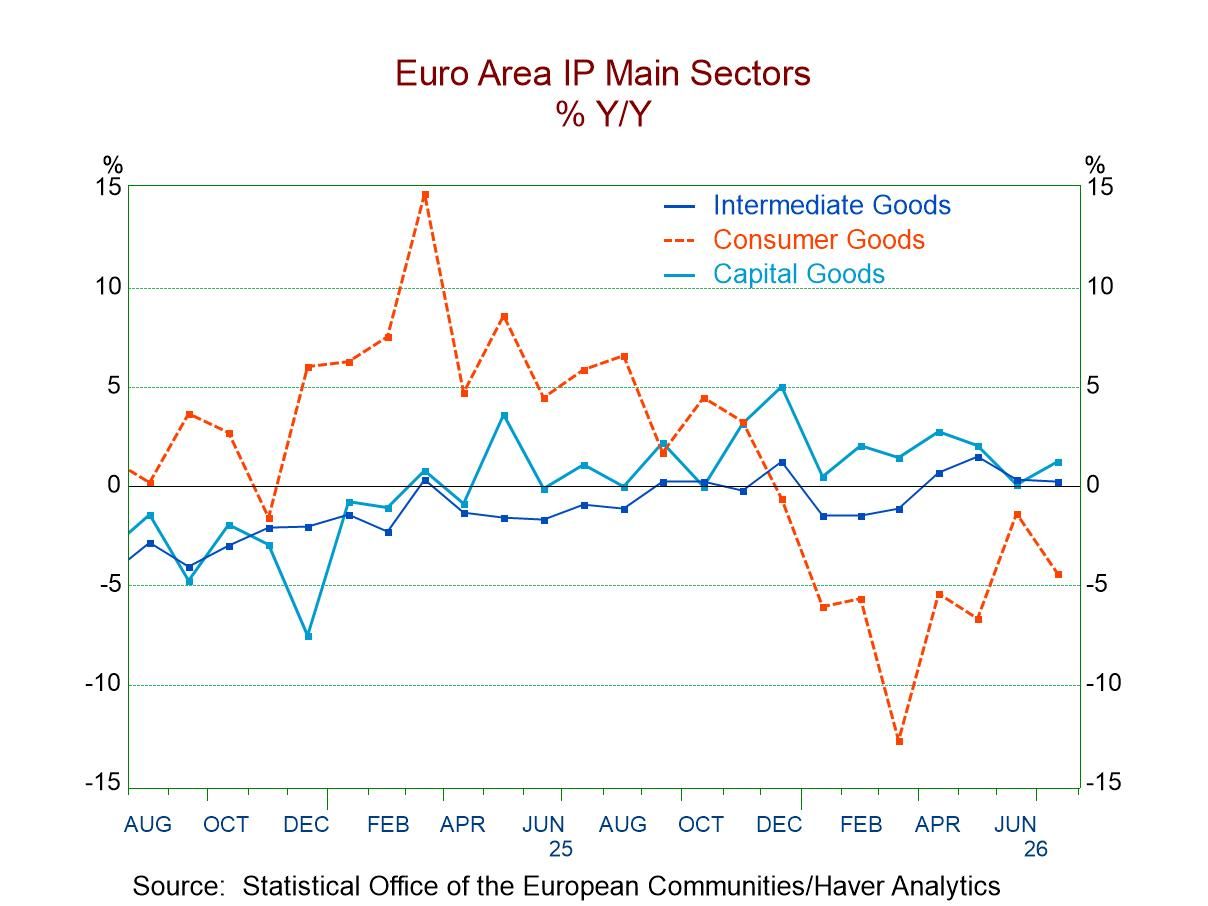
The monetary union graphic seems to show some very gradual longer-term progress underway based on looking at the year-over-year trends by sector. However, the shorter-term trends in the table, for a year and under, are not quite so supportive of optimism.
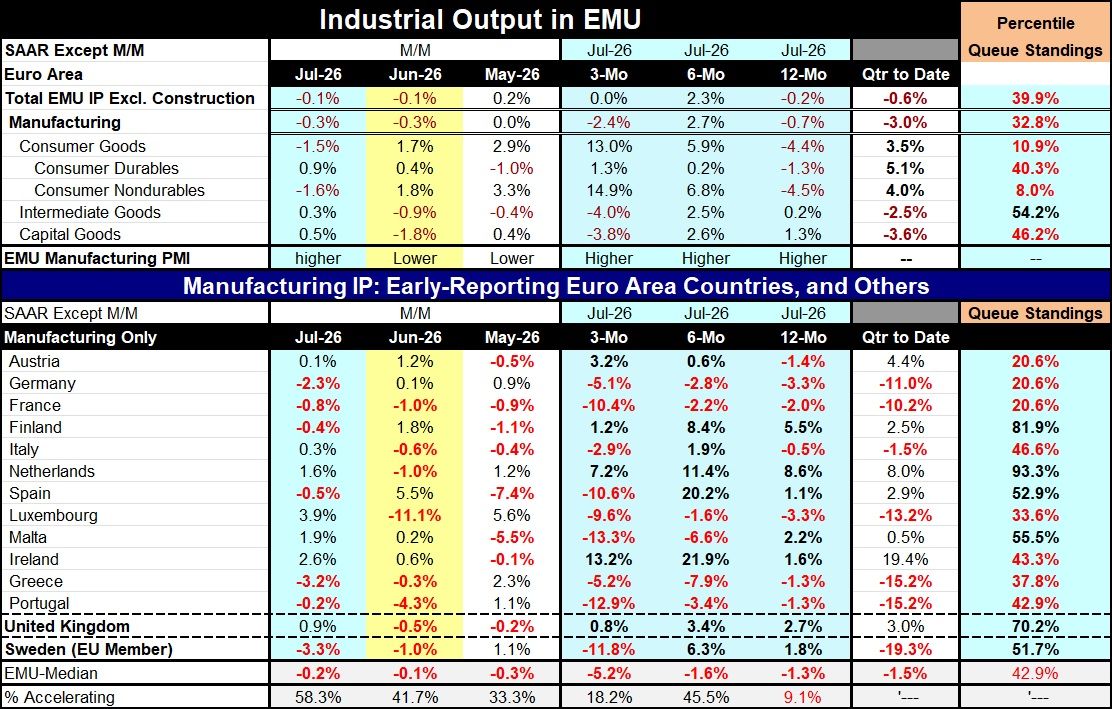
Monthly Monthly data show that industrial production has really been fluctuating around a zero-growth rate for the last three months, with a July and June drop of 0.1% versus a May increase of 0.2%. Looking at manufacturing alone, there was a drop in July of 0.3%, a June drop of 0.3%, and a flat performance in May. None of this speaks of growing optimism.
Sectors The consolidated monthly sector results show output gains in May and June for consumer goods but a substantial 1.5% drop in July. Intermediate goods output declined in May and June versus a small increase in July. Capital goods output was simply ragged, with a 0.4% increase in May, a 1.8% decline in June, and a 0.5% increase in July; it's hard to know what to make of that choppy performance.
Sequential growth in output Switching over to look at the sequential trends, that is, the pattern of growth rates from 12 months to six months to three months, what you see for the headline series is output falling by 0.2% over 12 months, rising at a 2.3% annual rate over six months, and then going flat over three months. Manufacturing industrial production shows an erratic loss and gain, and then a loss over three months. Consumer goods are encouraging on this timeline, with output falling by 4.4% over 12 months, rising by 5.9% at an annual rate over six months, and accelerating to a 13% annual rate over three months. Both consumer durables and nondurables output show acceleration; this is a rare bright spot in this report. Intermediate goods output shows acceleration from 12 months to six months and then a step back from a six-month growth rate of 2.5% to a 4% decline at an annual rate. Capital goods have the same characteristics, with a 12-month and six-month gain on the books and then a 3.8% annual rate decline over three months.
Quarter-to-date trends Quarter-to-date data, which is a nascent calculation since this report is for July, show declines underway for overall output, manufacturing, intermediate goods, and capital goods. The consumer goods categories are all showing increases in the quarter to date to offset the weakness in intermediate and capital goods, but still not enough to put an increase into the headlines.
Percentile standings The percentile standings, which rate the growth rates in a historic context since late 2006, show that only intermediate goods have an annual growth rate that registers above its median, and even then, it only has a 54.2 percentile standing. Capital goods come close to a neutral standing with a 46.2 percentile standing but consumer goods’ annual growth rate is very weak and logs a bottom-10-percentile standing.
Country detail monthly Country detail is not very reassuring, with six monetary union countries showing declines in July, the same as in June, compared to seven showing declines in May. This is for a small group of 12 countries that we track in the table. The medians for this group show declines in May, June, and July.
Countries sequentially Tracking the sequential trends for these 12 countries produces eight declines over three months, six declines over six-months, and seven declines over 12 months. The medians for each span are negative growth rates, and the negative growth rates get larger from 12 months to six months to three months, not a reassuring development. Also, statistics on the percent of reporters accelerating are below 50% for all periods. Over three-months, 18.2% of the countries are showing acceleration compared to six months, while over 12 months only 9.1% of the reporters are showing acceleration compared to the previous 12-month period.
Percentile standing by countries: weakness prevails Among the countries, only four show industrial production with year-over-year growth rates above their historic medians. The Netherlands leads the pack with a 93.3 percentile standing, followed by Finland with an 81.9 percentile standing, Malta with a 55.5 percentile standing, and Spain with a 52.9 percentile. The three largest monetary union economies have industrial production with annual growth rates ranking in the 20th percentile for Germany and France, while Italy is in its 47th percentile.
Summing up The weak showing in the latest data embodies weak trends. Recent months are weak as well, but more in a floundering way than in a deteriorating way. But the three-month growth rates taken together show more weakness than floundering. It’s not a reassuring report.

Robert Brusca
AuthorMore in Author Profile »Robert A. Brusca is Chief Economist of Fact and Opinion Economics, a consulting firm he founded in Manhattan. He has been an economist on Wall Street for over 25 years. He has visited central banking and large institutional clients in over 30 countries in his career as an economist. Mr. Brusca was a Divisional Research Chief at the Federal Reserve Bank of NY (Chief of the International Financial markets Division), a Fed Watcher at Irving Trust and Chief Economist at Nikko Securities International. He is widely quoted and appears in various media. Mr. Brusca holds an MA and Ph.D. in economics from Michigan State University and a BA in Economics from the University of Michigan. His research pursues his strong interests in non aligned policy economics as well as international economics. FAO Economics’ research targets investors to assist them in making better investment decisions in stocks, bonds and in a variety of international assets. The company does not manage money and has no conflicts in giving economic advice.
More Economy in Brief