U.S. Initial Unemployment Claims Dropped in the Week of September 12
Summary
- New claims declined by 10,000 to 196,000 in the week of September 12.
- Continuing claims dropped by 39,000 to 1.730 million in the week ending September 5.
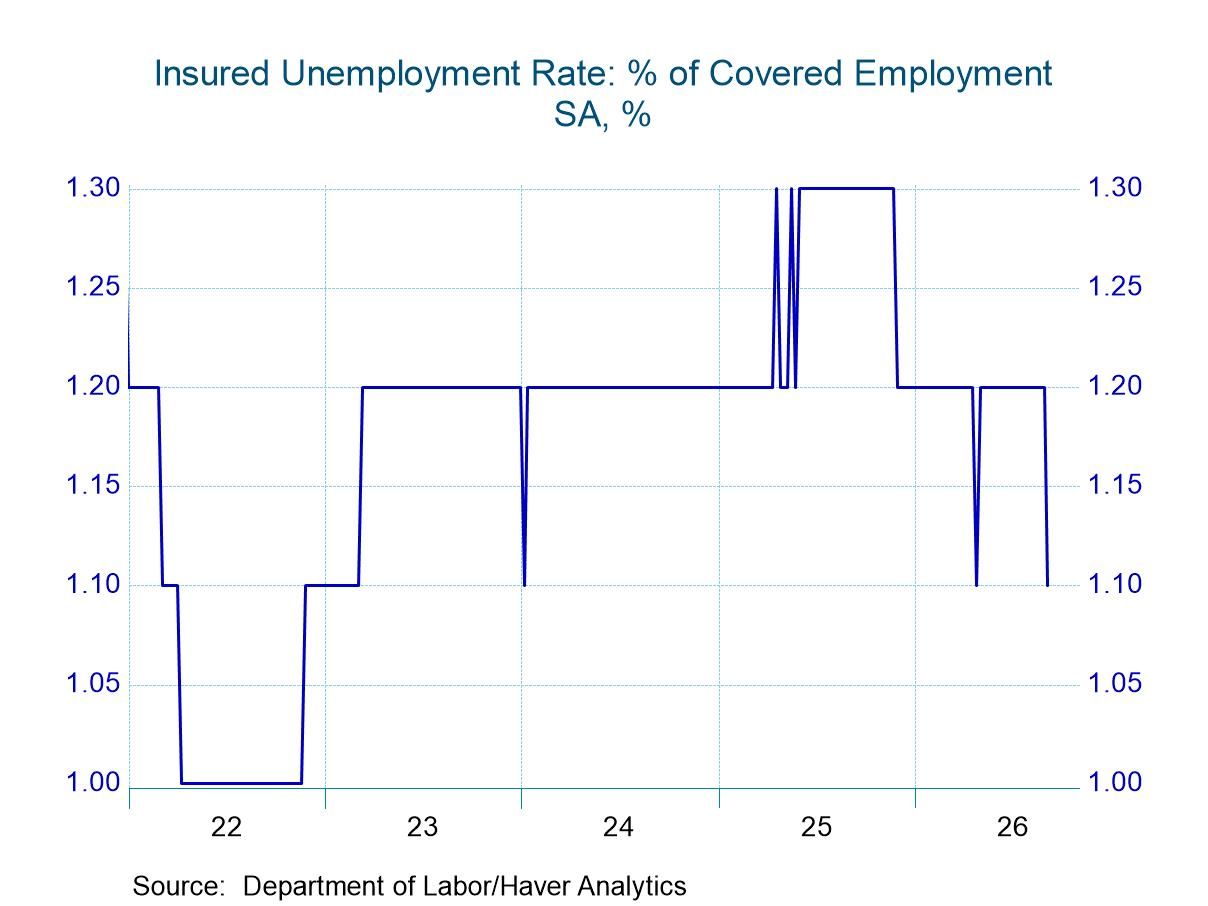
- The insured unemployment rate inched down to 1.1% in the week of September 5, the first drop since April 25.
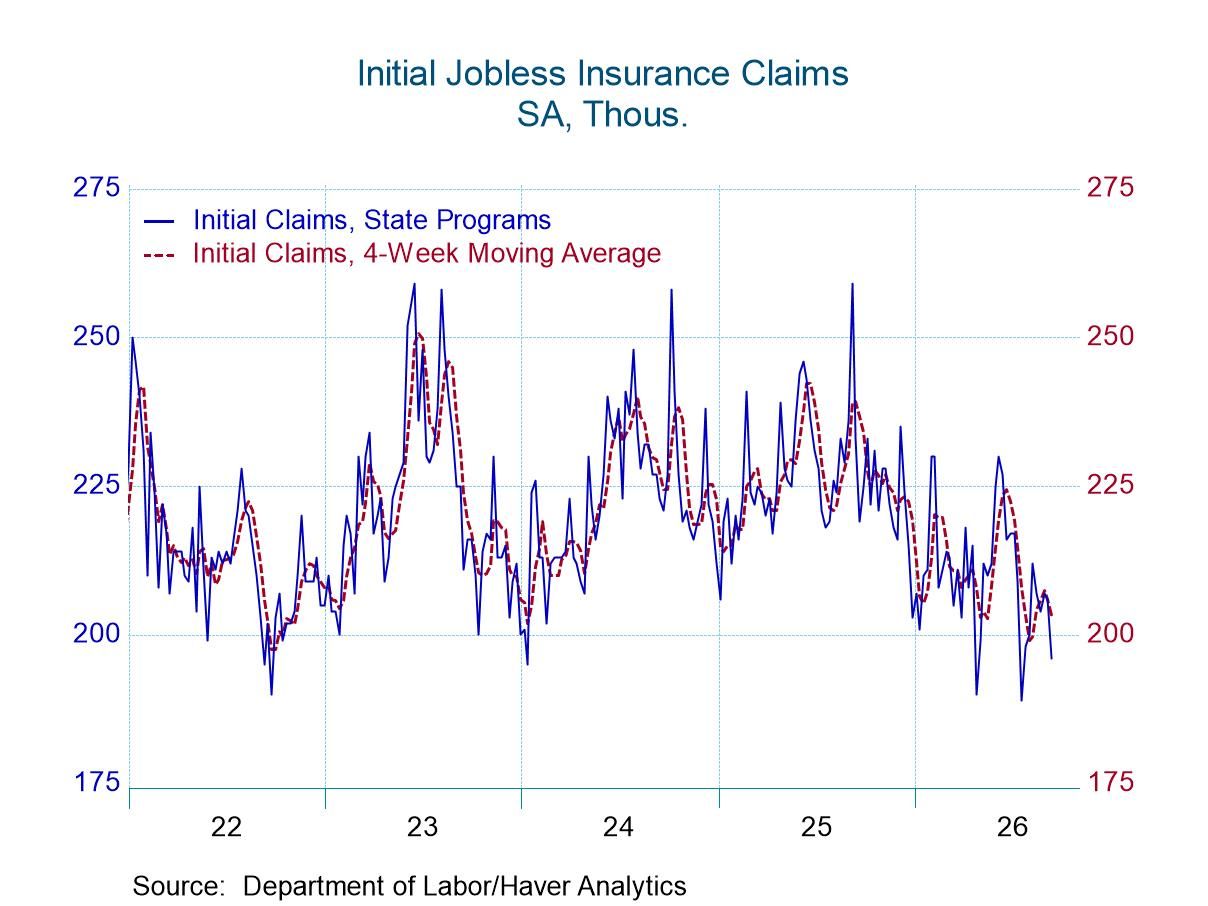
Initial claims for unemployment insurance dropped by 10,000 to 196,000 in the week ending September 12 from an unrevised level of 206,000 in the week ending September 5. The four-week average was 203,250 in the September 12 week, down from 206,000 in the September 5 week, also unrevised. Claims have been largely range-bound at historically low levels between 200,000 and 230,000. The Action Economics/Haver Analytics Survey looked for 206,000 claims to have been filed.
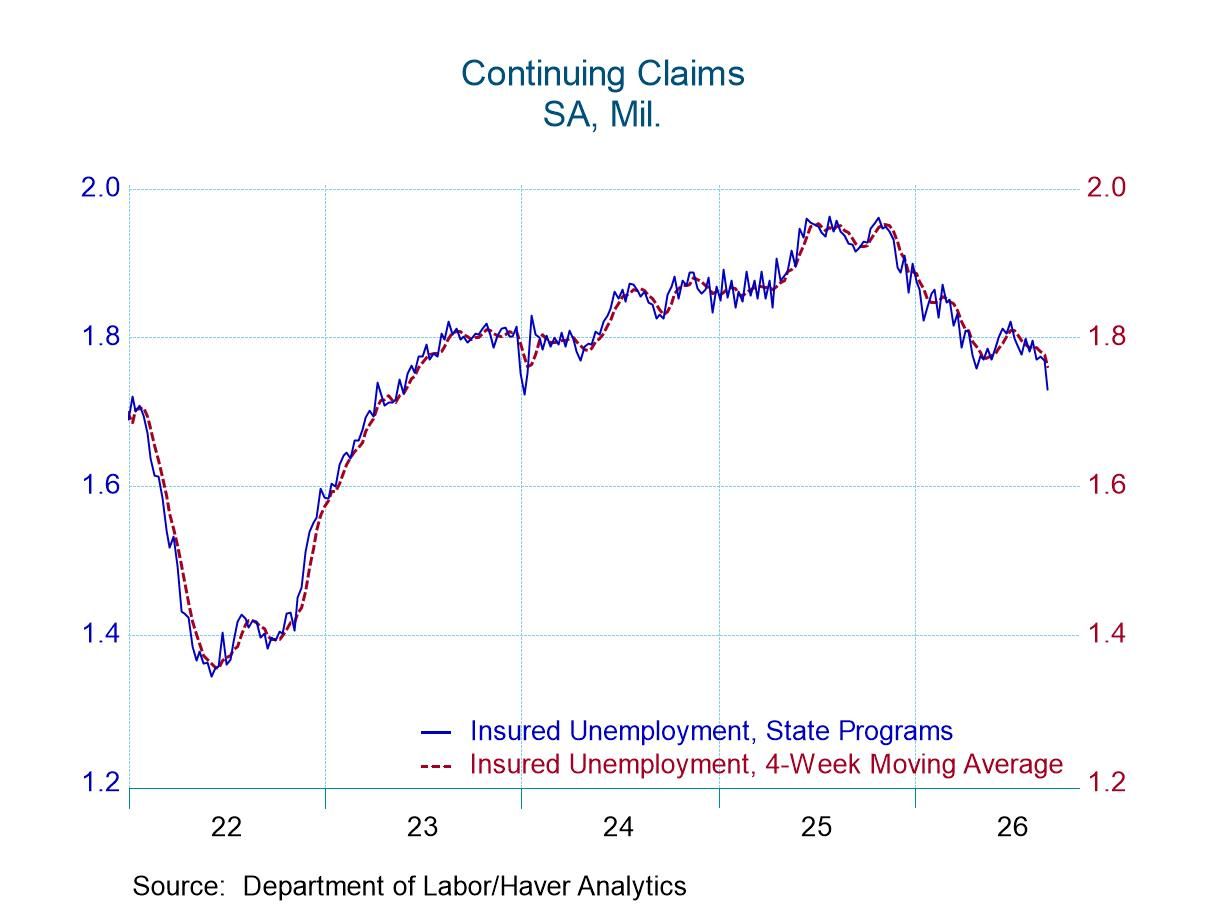
The total number of unemployment insurance beneficiaries—also known as “continuing claims”— dropped 39,000 to 1.730 million in the week ending September 5, down from 1.769 million in the week in the week ending August 29, revised from 1.774 million. The four-week moving average was 1.761 million in the September 5 week, down from 1.778 million in the August 29 week. The insured unemployment rate remained edged down to 1.1% in the September 5 week from 1.2% in the week of August 29, and the first drop since the April 25 week.
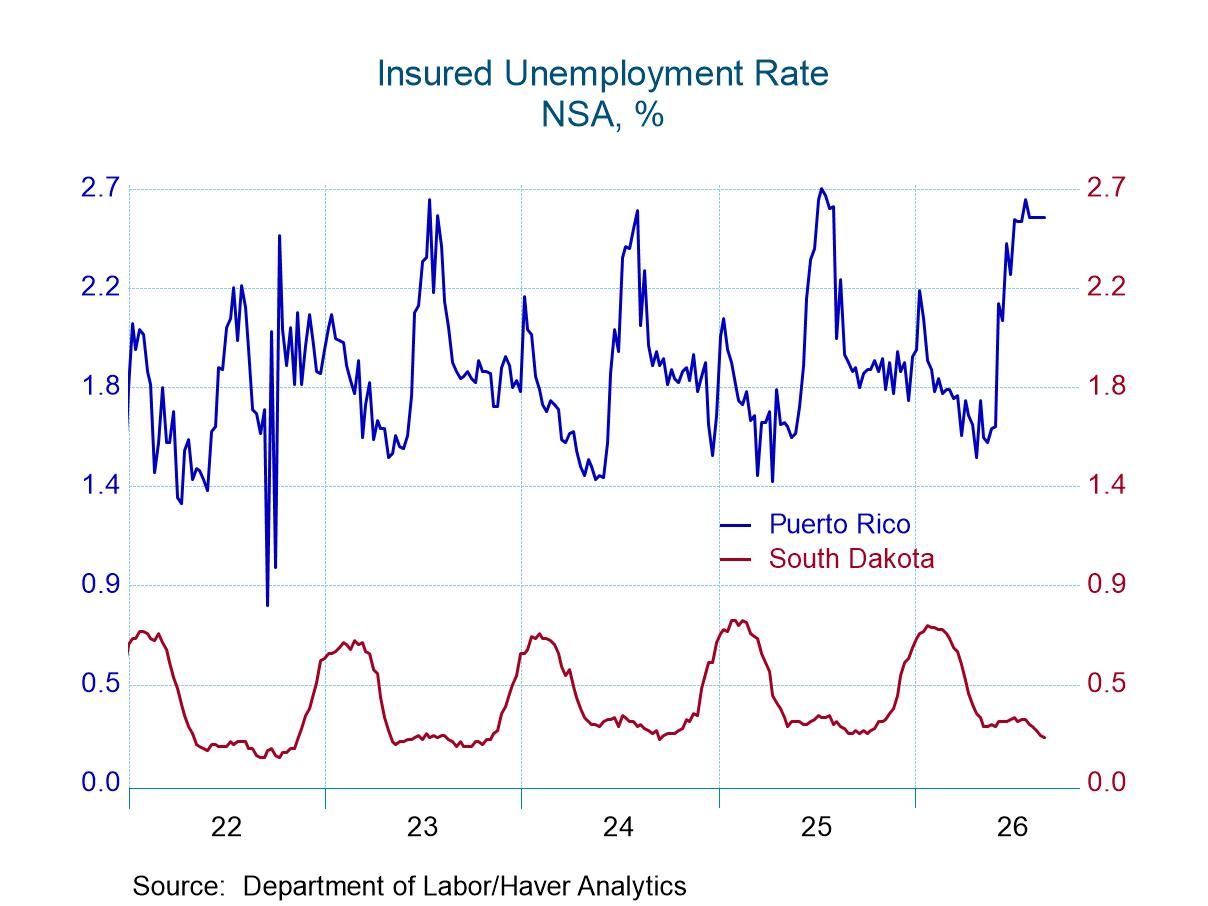
The insured unemployment rate varies greatly across individual states and territories. In the week ending August 29, the highest unemployment rates were in Massachusetts (2.03%), Puerto Rico (2.57%), and New Jersey (2.58%). The lowest rates were in South Dakota (0.21%), Florida (0.34%), Louisiana (0.34%), Alabama (0.35%), Kentucky (0.36%), North Carolina (0.37%), Arkansas (0.42%), Nebraska (0.43%), Iowa and North Dakota (both 0.44%), Tennessee (0.45%), Kansas (0.46%), Idaho (0.47%), and Wyoming (0.48%). Rates in other notable states include Texas (1.01%), Pennsylvania (1.39%), Illinois (1.41%), New York (1.72%) and California (1.78%). These state data are not seasonally adjusted.
Data on weekly unemployment claims are from the Department of Labor itself, not the Bureau of Labor Statistics. They begin in 1967 and are contained in Haver’s WEEKLY database and summarized monthly in USECON. Data for individual states are in REGIONW back to December 1986.

Kathleen Stephansen, CBE
AuthorMore in Author Profile »Kathleen Stephansen is a Senior Economist for Haver Analytics and an Independent Trustee for the EQAT/VIP/1290 Trust Funds, encompassing the US mutual funds sponsored by the Equitable Life Insurance Company. She is a former Chief Economist of Huawei Technologies USA, Senior Economic Advisor to the Boston Consulting Group, Chief Economist of the American International Group (AIG) and AIG Asset Management’s Senior Strategist and Global Head of Sovereign Research. Prior to joining AIG in 2010, Kathleen held various positions as Chief Economist or Head of Global Research at Aladdin Capital Holdings, Credit Suisse and Donaldson, Lufkin and Jenrette Securities Corporation.
Kathleen serves on the boards of the Global Interdependence Center (GIC), as Vice-Chair of the GIC College of Central Bankers, is the Treasurer for Economists for Peace and Security (EPS) and is a former board member of the National Association of Business Economics (NABE). She is a member of Chatham House and the Economic Club of New York. She holds an undergraduate degree in economics from the Universite Catholique de Louvain and graduate degrees in economics from the University of New Hampshire (MA) and the London School of Economics (PhD abd).
More Economy in Brief
 Global