Global| Oct 29 2026
Charts of the Week: Resilience on Narrow Foundations
by:Andrew Cates
|in:Economy in Brief
Summary
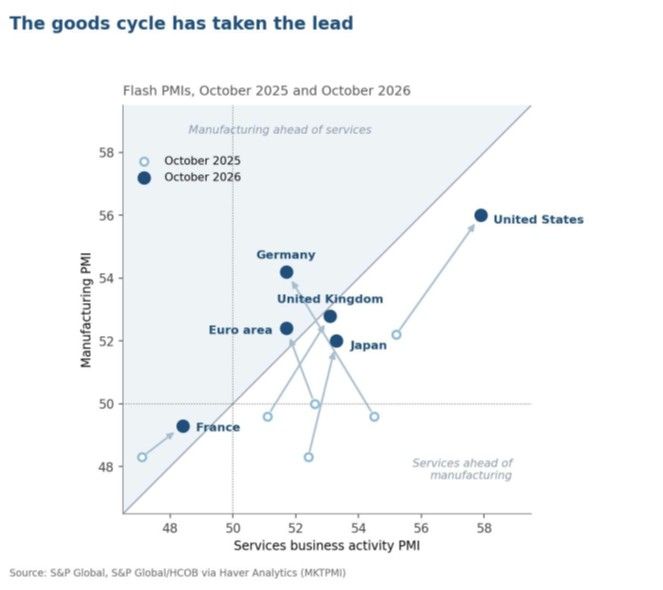
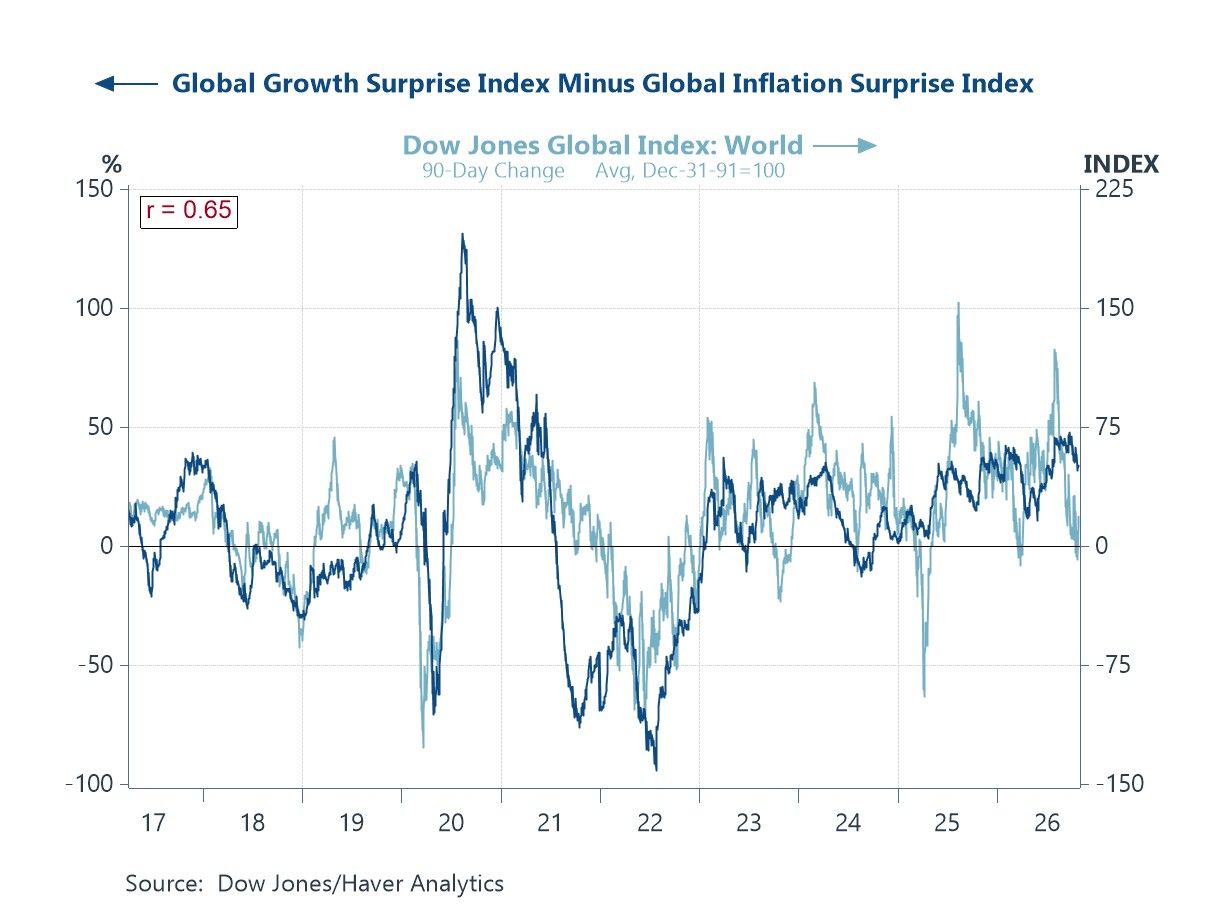
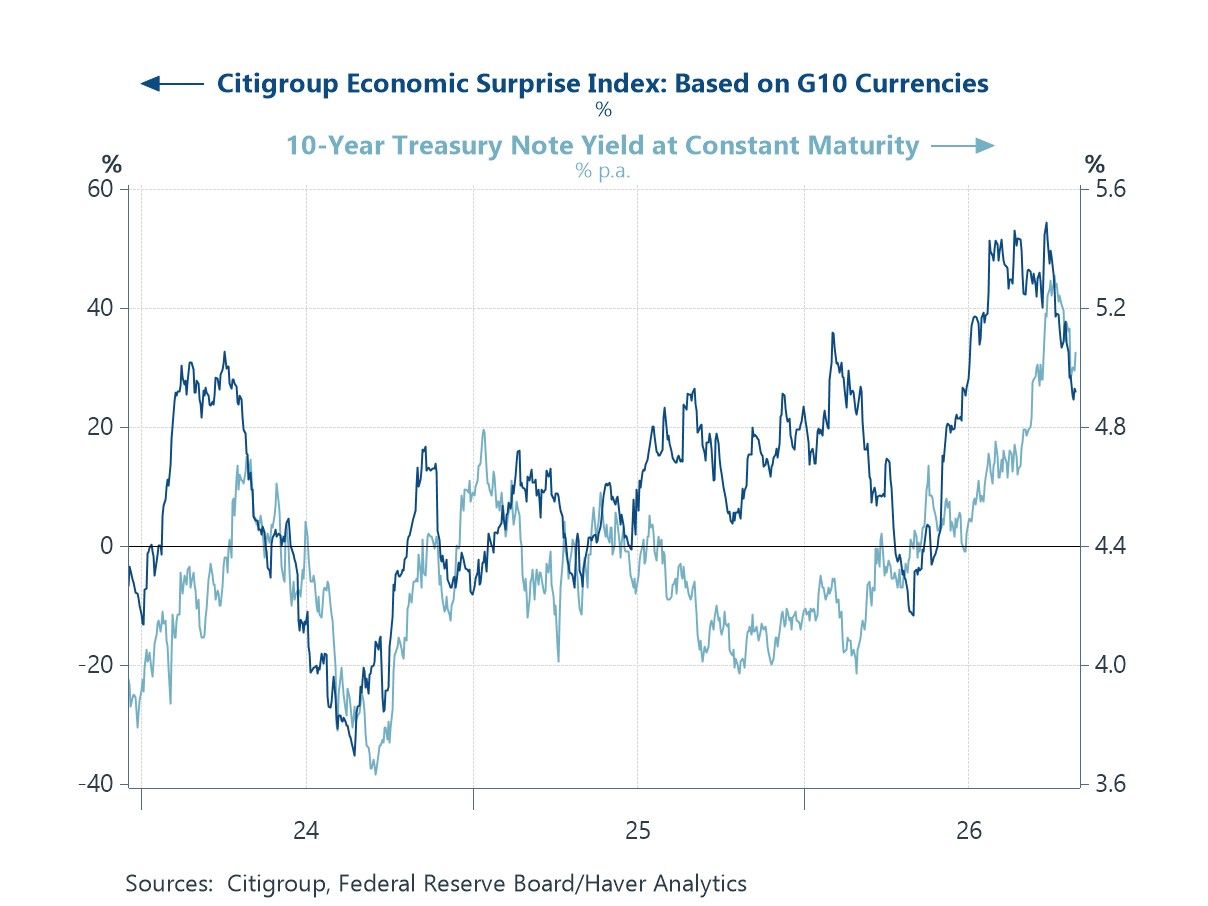
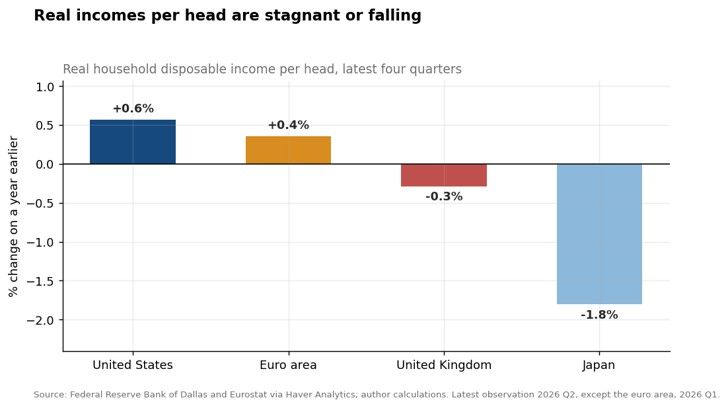
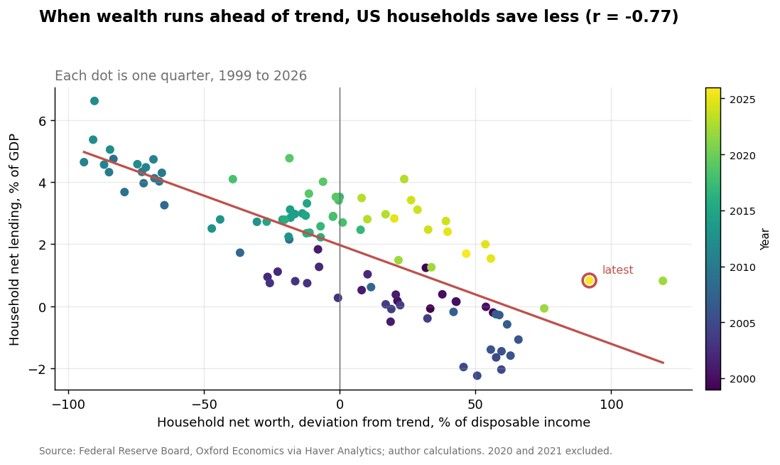
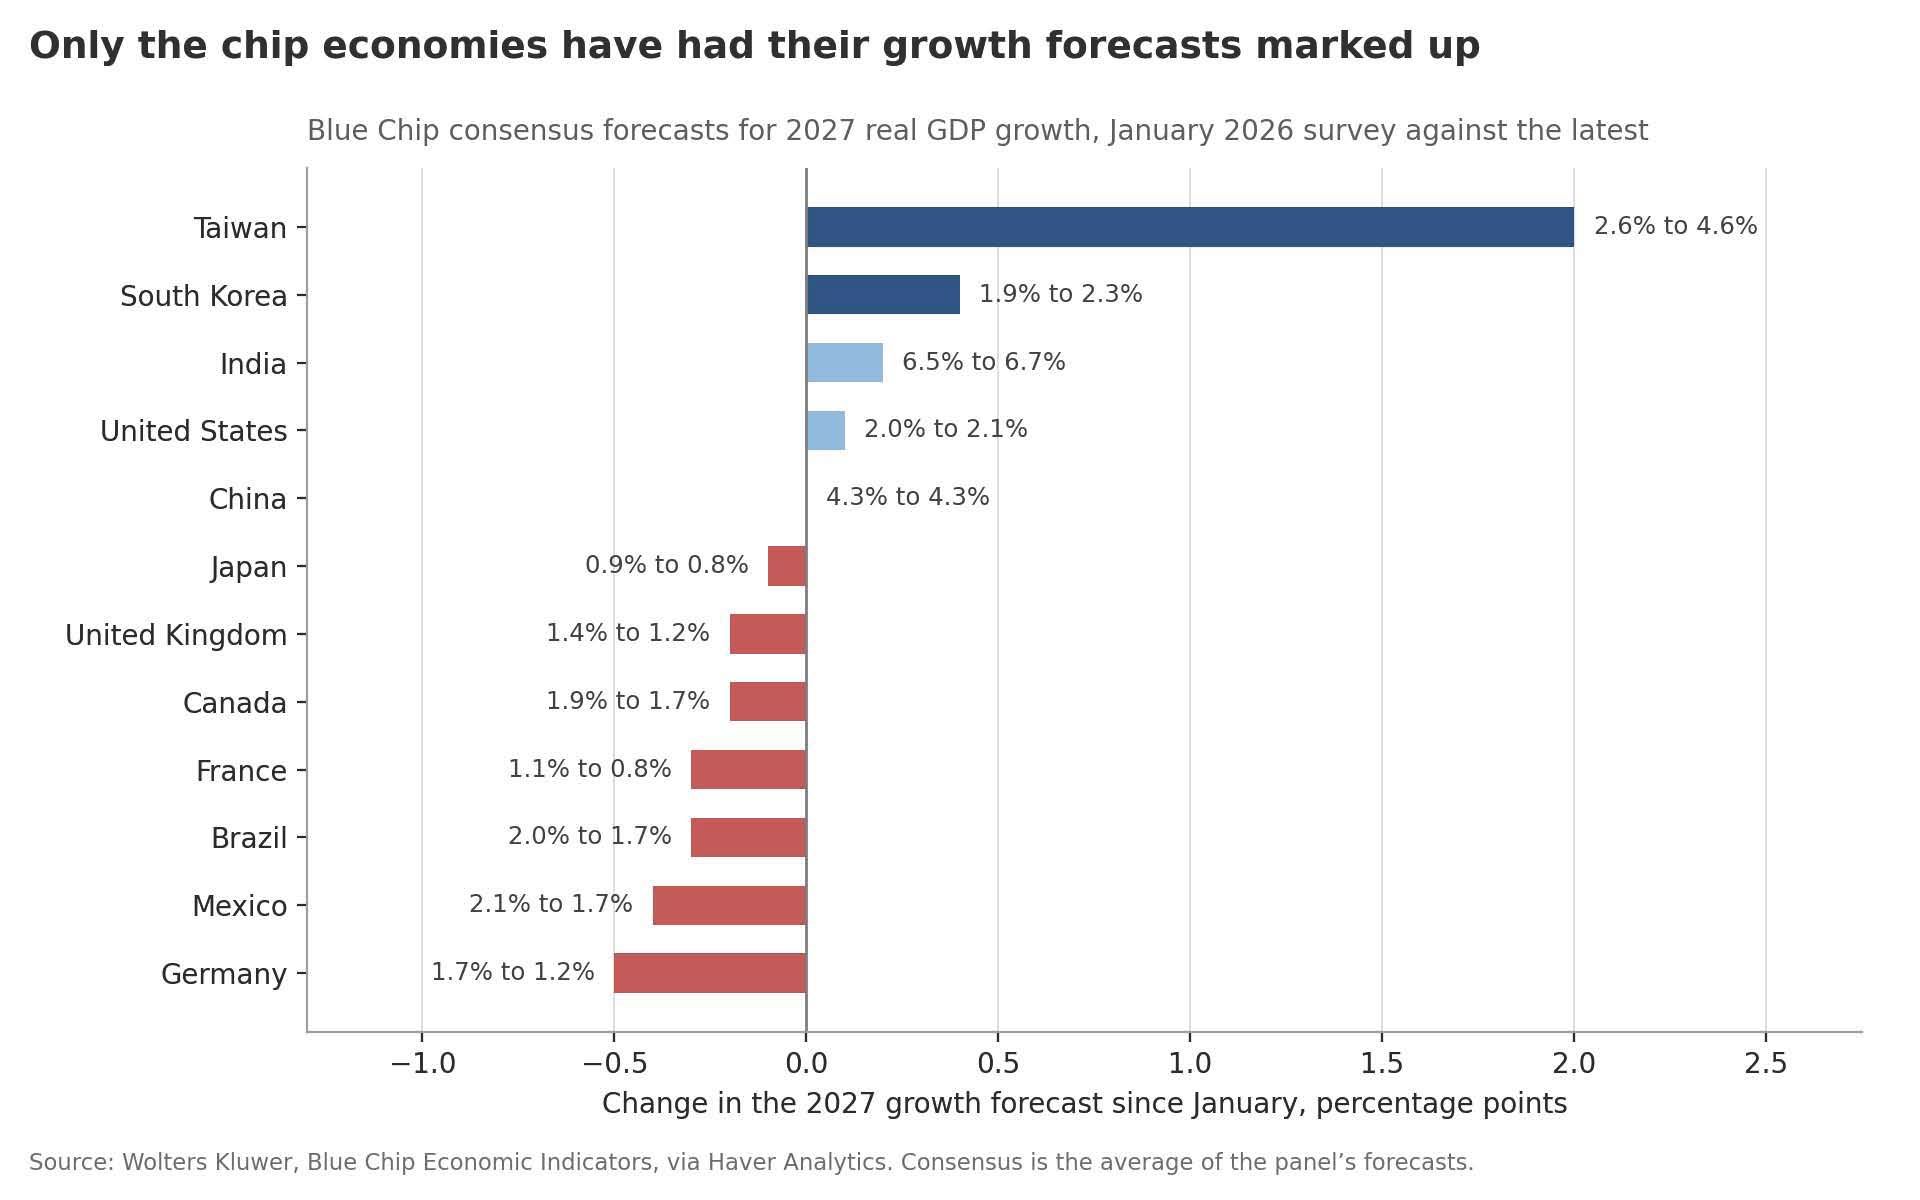
Four central banks are deciding policy this week, and the first two have set the tone. The Federal Reserve left its policy rate unchanged while the Bank of Canada delivered a further quarter-point increase. The European Central Bank reports today and the Bank of Japan at the end of the week. Markets have given them an awkward backdrop. Ten-year Treasury yields have climbed by roughly a third of a percentage point since the summer, touching 5.3 per cent at the start of this month before easing back towards 5 per cent, while equities have gone almost nowhere, the S&P 500 having traded in a narrow range since early August. The October flash surveys, meanwhile, left little doubt that the global expansion is still intact, though factories are now doing more of the work than at any point in the past two years (chart 1). Activity data have been beating expectations by more than prices have, and world equities have broadly moved with that gap (chart 2), yet bond markets have drawn a different inference from the same run of numbers, pushing yields and financing costs higher as the surprises accumulated (chart 3). The composition of the demand behind those numbers is where the discomfort lies. Real household incomes are barely growing in the United States and the euro area and are falling outright in Britain and Japan (chart 4), while American consumption leans to an unusual degree on a stock of household wealth that sits far above its historical relationship with income (chart 5). Forecasters have marked up next year's growth almost exclusively where semiconductors are made (chart 6). The expansion is real. The question for policymakers is how much weight it can bear.
Factories do the lifting The October flash purchasing managers' surveys carried a consistent message. Output is still expanding across most of the advanced world, but the pace eased almost everywhere, and the balance between sectors has shifted. German manufacturing recorded its strongest reading in years and now sits comfortably above German services; the same ordering holds in Japan and, more narrowly, across the euro area as a whole. A year ago factories were the laggard in every one of these economies. The United States remains the outlier in both level and mix, with services still ahead and composite output far above anything in Europe, while France slipped back below the expansion threshold and Australia fell further still. Germany's ifo survey, released in the same week, pointed the same way: a fourth consecutive improvement in business climate, driven by expectations rather than by any assessment of present conditions, which in fact slipped. Firms might be positioning for a recovery they cannot yet see in their order books.
Chart 1: Flash manufacturing and services PMIs, October 2025 and October 2026
Good news on growth, less bad news on prices For most of this year the global data have surprised on the upside for activity more than for inflation, and equity markets have moved with that gap. The pattern is not new, but its persistence through an energy price shock is notable. Core CPI inflation has been stubbornly unremarkable: around two and a half per cent in the United States, the euro area and Japan, with none of the three moving materially higher over the past six months even as headline rates climbed. Unit labour costs tell a similar story outside Japan, where they are rising faster and accelerating. On the evidence so far, the energy shock has not been spreading into wages, services prices or expectations in the way that would compel further restraint.
Chart 2: Global growth surprises relative to inflation surprises, and world equity prices
The bond market draws a different inference The rise in bond yields reflects the financing demands of the current expansion as well as expectations for monetary policy. Upside surprises across the G10 have coincided with a climb in the ten-year Treasury yield, which remains well above its level at the start of the year despite retreating from its peak. Investment upswings typically require substantial capital, but the scale of spending on AI infrastructure is adding to demand for finance at a time when governments also face large borrowing needs. Spending on data centres, computing equipment and the electricity infrastructure to run them requires funding today against returns expected much later. Higher yields raise borrowing costs and reduce the present value of those prospective returns, making the investment harder to justify.
Chart 3: G10 economic surprises and the ten-year Treasury yield
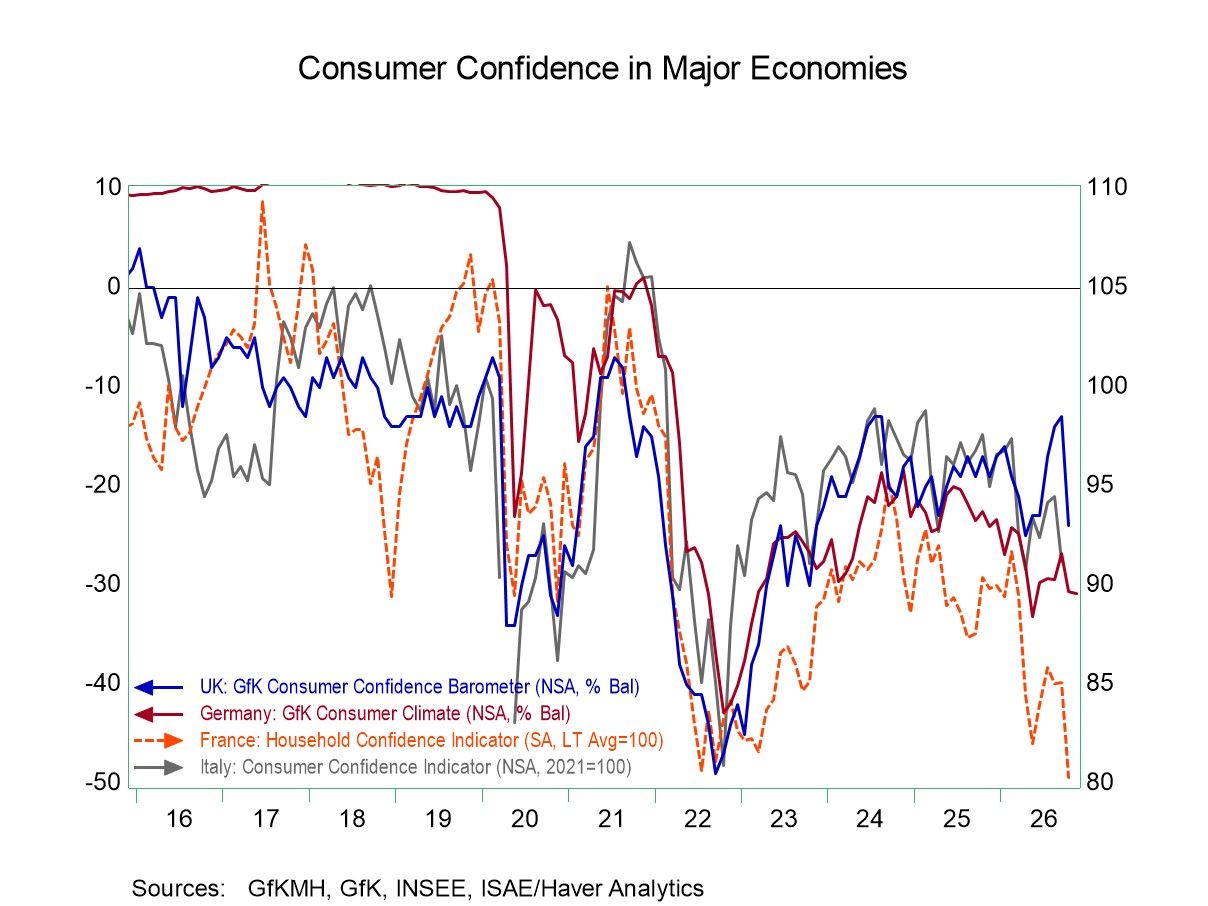
Incomes are not the engine Strip the expansion back to the household and the picture thins considerably. Real disposable income per head is growing by a little over half a per cent in the United States and less than that in the euro area; in Britain and Japan it is falling. Consumption has nonetheless held up, which means that saving has given way. The October confidence surveys suggest households themselves are not comfortable with the arrangement. German consumer climate weakened further to among its lowest readings on record, British confidence dropped sharply, and French and euro area measures both deteriorated. American households are the exception only in part: the Conference Board's headline rose on a firmer assessment of current conditions, while its expectations component sits below the level the Conference Board itself associates with recession risk, and the Michigan measure remains pinned near its historical floor.
Chart 4: Real household disposable income per head, latest four quarters
Spending the portfolio In the United States the gap between weak income growth and resilient consumption has been bridged by wealth. The relationship in the data is unusually tight: when household net worth runs ahead of its trend relationship with income, households save less out of current income, and when it falls behind, they save more. The latest observation sits at the far right of more than a hundred quarters of history, with net worth some ninety percentage points of disposable income above trend, and almost all of that excess held in equities. This is not a borrowing story and it need not end badly. But it does mean that consumption is now underwritten by asset valuations rather than by earned income, and that a sustained fall in equity prices would transmit to slower spending through the saving rate rather than through the credit channel.
Chart 5: US household net lending against the deviation of net worth from trend
The revisions point to one place The narrowness shows up in the forecasts as clearly as in the data. Since January, the Blue Chip consensus for next year's growth has been raised meaningfully only for Taiwan and South Korea, with marginal upgrades for India and the United States. Germany, France, Mexico, Brazil, Canada, Britain and Japan have all been marked down. The upgrades track the semiconductor supply chain almost exactly. That concentration is visible in the American capital stock too, where spending on information processing equipment and software has risen by more than forty per cent since the end of 2023 while every other category of business investment has fallen, and which now accounts for a substantially larger share of real business investment than it did before the pandemic. An expansion resting on one capital spending cycle, one stock market and a falling saving rate is a resilient one, but it is not a broad one. That is the case for central banks to tread carefully before leaning against it further.
Chart 6: Change in Blue Chip consensus forecasts for 2027 real GDP growth

Andrew Cates
AuthorMore in Author Profile »Andy Cates joined Haver Analytics as a Senior Economist in 2020. Andy has more than 25 years of experience forecasting the global economic outlook and in assessing the implications for policy settings and financial markets. He has held various senior positions in London in a number of Investment Banks including as Head of Developed Markets Economics at Nomura and as Chief Eurozone Economist at RBS. These followed a spell of 21 years as Senior International Economist at UBS, 5 of which were spent in Singapore. Prior to his time in financial services Andy was a UK economist at HM Treasury in London holding positions in the domestic forecasting and macroeconomic modelling units. He has a BA in Economics from the University of York and an MSc in Economics and Econometrics from the University of Southampton.
More Economy in Brief