U.S. GDP Jumped 3.4% in Q3 with Strong Domestic Demand
by:Sandy Batten
|in:Economy in Brief
Summary
- The quarterly gain was led by personal consumption, business spending on equipment, and inventory rebuilding.
- Net exports subtracted 3.3%-points from overall growth, the third largest quarterly drag in the history of the series.
- Domestic demand growth accelerated to well above trend.
- Reflecting the retreat in energy prices in Q3, GDP inflation decelerated markedly.
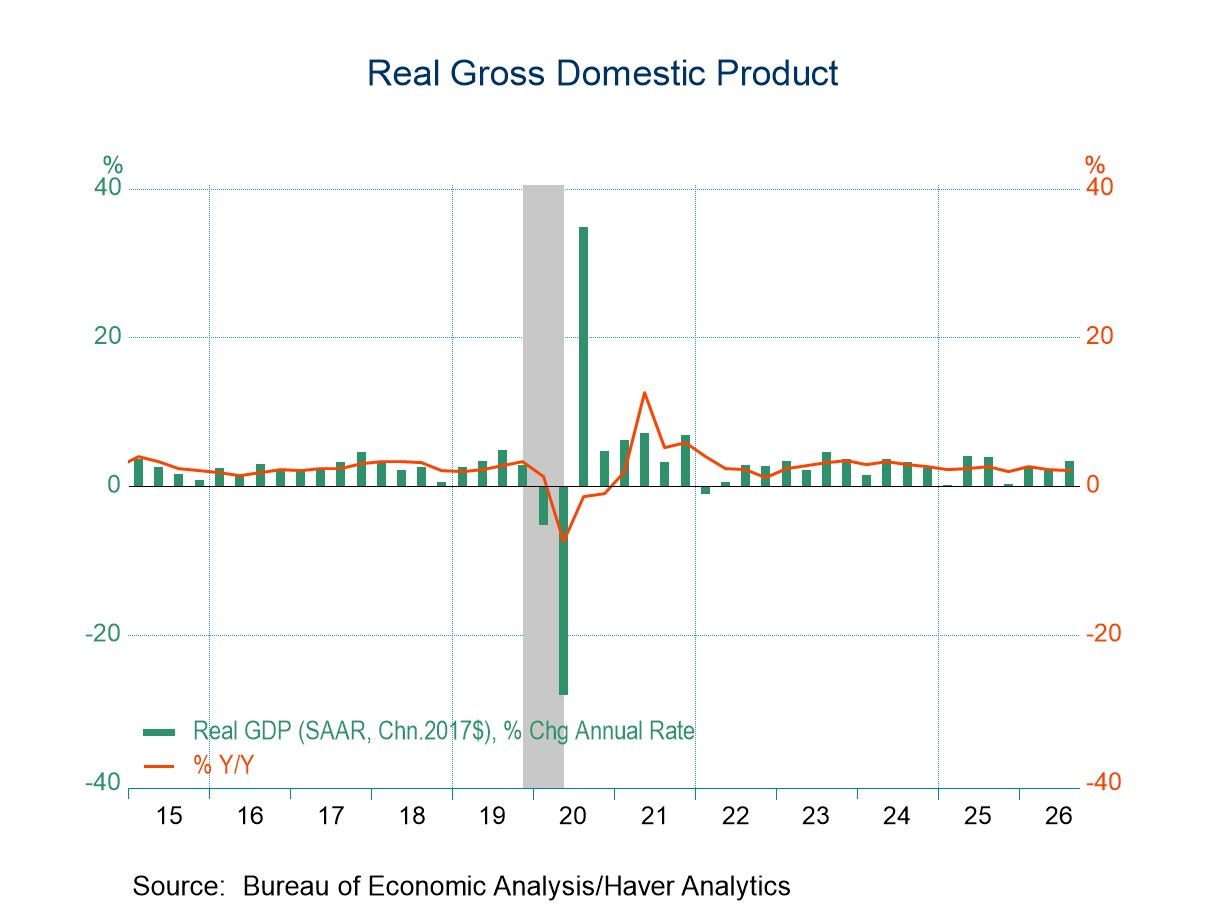
Real GDP grew 3.4% q/q saar in Q3 following a 2.2% increase in Q2 and a 2.5% gain in Q1, according to the Advance release from the BEA. The Action Economics Forecast Survey looked for a 3.1% quarterly gain. Over the first three quarters of this year, GDP has grown at a 2.7% annual rate, well above its longer-term trend. Compared with a year ago, GDP was up 2.1% in Q3, Domestic demand was very strong in Q3. Final sales to domestic purchasers jumped 5.0% q/q (2.9% y/y), its fastest quarterly pace since the economy reopened from the Covid shutdown, up from 3.8% in Q2 and 2.3% in Q1. Final sales to private domestic purchasers (the Federal Reserve’s preferred measure of aggregate demand) rose 4.9% at an annual rate in Q3 (3.3% y/y) versus 4.6% in Q2 and 1.8% in Q1. For the first three quarters of 2026, final sales to domestic purchasers rose 3.7% at an annual rate while final sales to private domestic purchasers increased 3.8%.
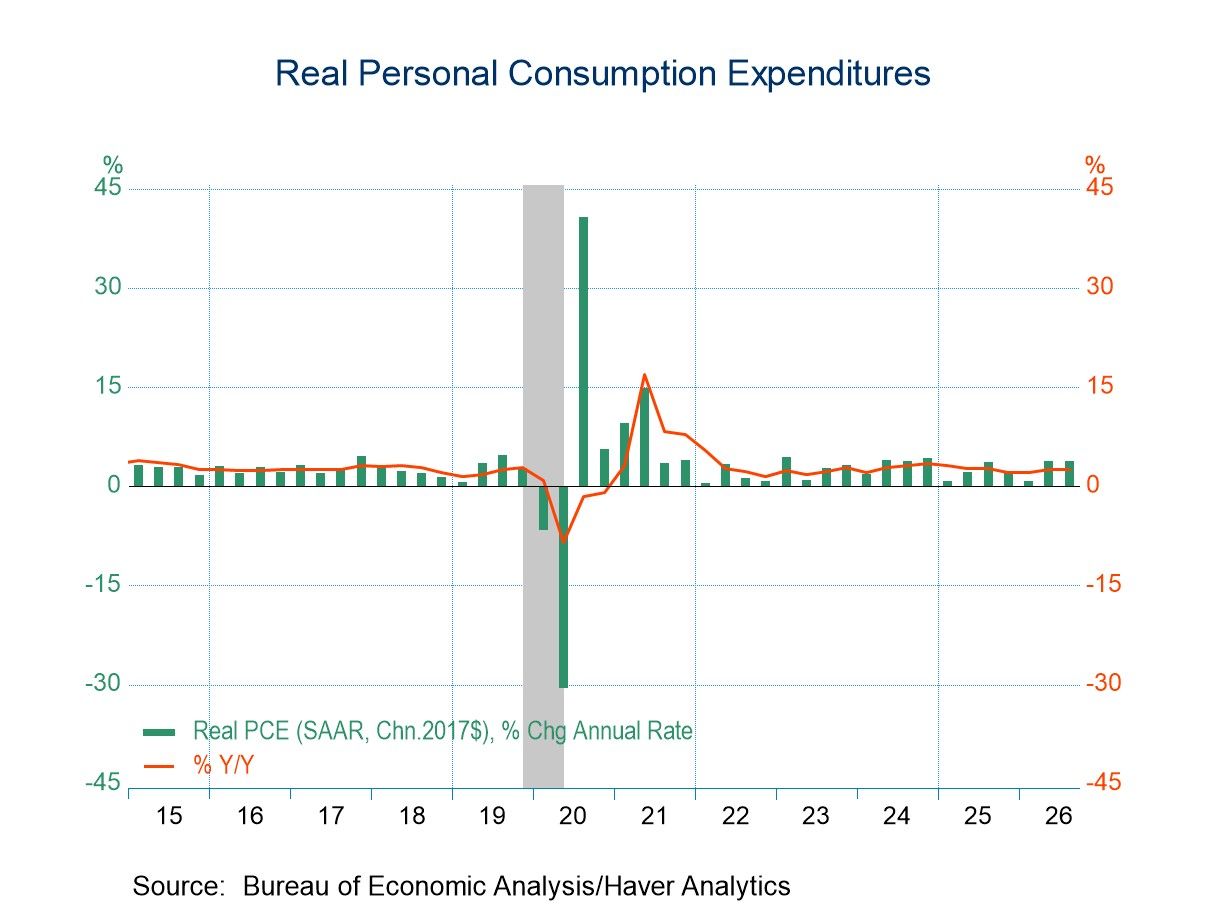
Personal consumption expenditures and business spending on equipment and intellectual property continued to provide much of the boost to overall GDP growth in Q3. PCE grew 3.8% q/q saar in Q3, accounting for 2.5%-points of overall GDP growth, the same increase and contribution as in Q2. The composition of the Q3 increase was somewhat different from that in Q2. Spending on goods slowed to 3.0% from 4.5% in Q2, reflecting slower spending growth for both motor vehicles and furnishings, and a decline in spending on recreational goods and vehicles. By contrast, spending on services picked up to 4.1% in Q3, its fastest quarterly pace Q2 2022, from 3.4% in Q2. One note of caution: the continued strength in consumer spending has come at the expense of saving with the saving rate declining to 4.1% in Q3, its lowest reading since Q4 2022 and calling into question the sustainability of the recent strength in spending.
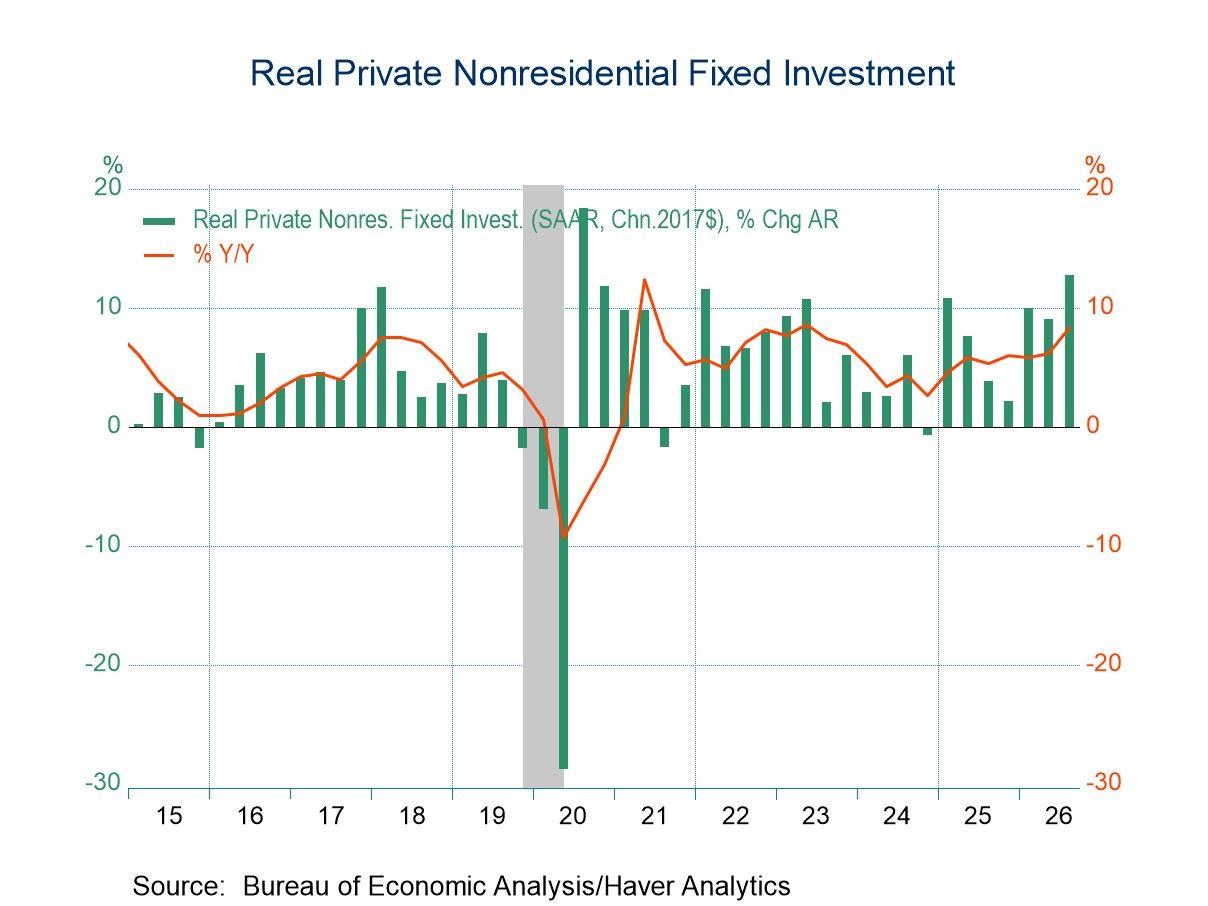
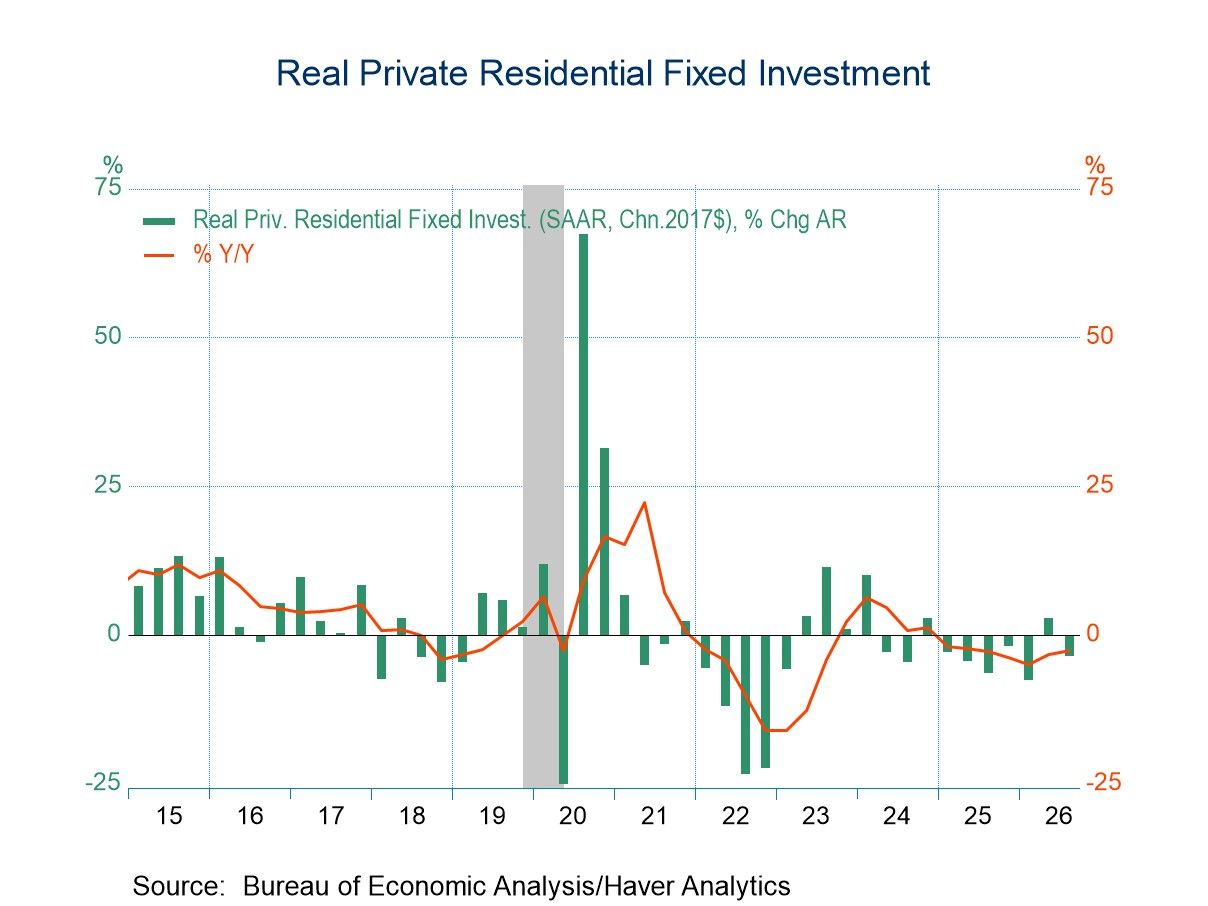
Business spending on equipment remained very strong in Q3, posting its third consecutive double-digit quarterly gain. Equipment spending jumped 20.9% q/q saar in Q3 on top of a 13.4% quarterly gain in Q2 and a 15.5% quarterly increase in Q1. The Q3 increase was the largest since Q3 2020 and was led by a 37.3% annual rate surge in spending on information processing equipment. Business spending on intellectual property increased a solid 8.4% in Q3 though a slowdown from the 9.2% in Q2 and 15.6% in Q1, due mostly to a slowdown in spending on software from very lofty levels. Together, these two added 1.6%-points to total GDP growth. Business construction spending also made a meaningful contribution to overall growth in Q3 for the first time in six quarters. It rose 5.4% and added 0.2%-point to GDP growth. Quarterly gains, apart from a decline in manufacturing, were widespread across sectors with a particularly large increase in construction of data centers (128% annual rate gain). After a surprising 2.8% q/q increase in Q2, residential construction fell 3.4% in Q3, its sixth quarterly decline in the past seven quarters.
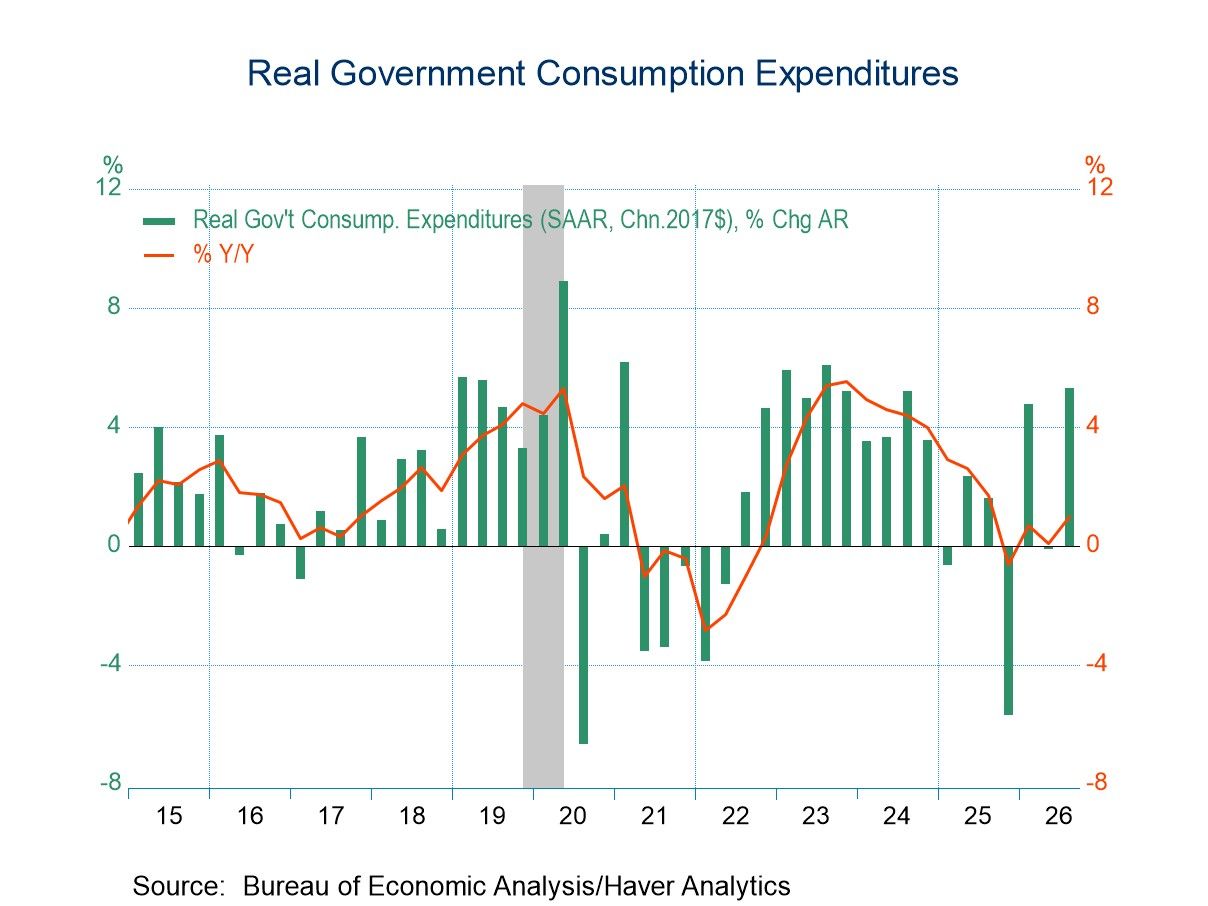
Inventories returned to a growth supporter in Q3 after having declined in each of the preceding five quarters. Inventories increased $20.3 billion (2017$) in Q3 and added 1.6% points to overall GDP growth. Government spending also contributed to growth in Q3 after having been essentially unchanged in Q2. Total government spending increased 5.3% q/q saar in Q3, adding 0.9%-point to GDP growth, versus a 0.1% quarterly decline in Q2. Federal government spending rebounded, jumping 15.8% q/q after a 2.4% quarterly decline in Q2, reflecting sizeable increases in both defense (11.7%) and nondefense (22.2%) spending. By contrast, spending by state and local governments was essentially unchanged in Q3 following a 1.2% gain in Q2.
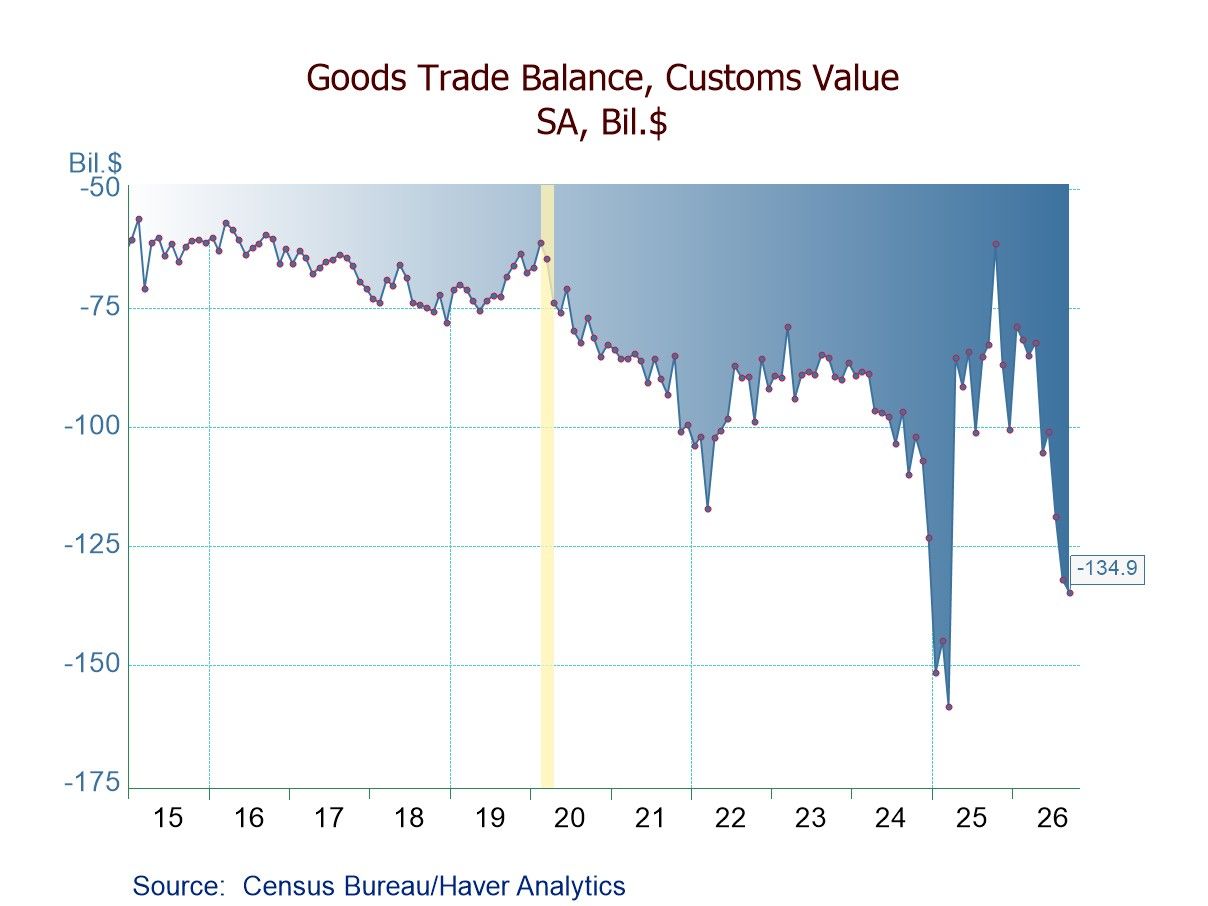
As was widely anticipated from the quarterly trade reports, the trade balance widened markedly in Q3 with net exports subtracting 3.3%-points from overall GDP growth, the third largest quarterly subtraction in the history of the series dating back to 1947, on top of a 1.1%-point subtraction in Q2. Imports jumped 19.7% q/q saar, largely reflecting a 58.7% annual rate increase in imports of capital goods. It seems that the rising pace of AI build outs is being supplied predominantly by foreign production—notably semiconductors. Imports of consumer goods edged up only 1.0%. By contrast, exports declined 5.7%, the first quarterly decline in three quarters, with weakness relatively widespread across major sectors.
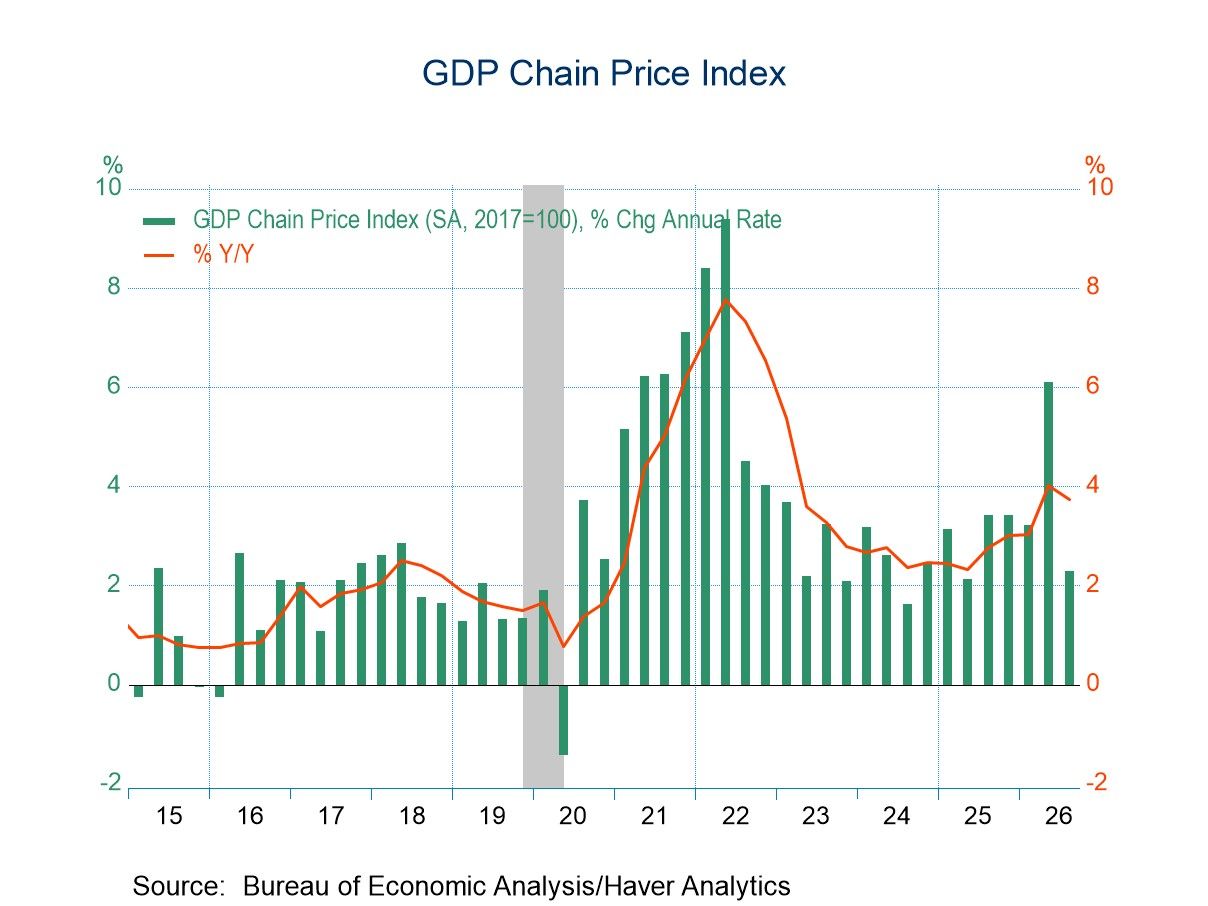
With energy prices receding in Q3 following their Q2 surge, quarterly GDP inflation slowed accordingly. The rise in the GDP price index slowed to 2.3% q/q saar in Q3 from 6.1% in Q2. Energy prices fell 7.4% q/q at an annual rate in Q3. PCE inflation (the measure targeted by the Fed) slowed to 2.1% from 5.0% while core PCE inflation (excluding food and energy prices) slowed to 2.5% from 3.3%.
The GDP data can be found in Haver’s USECON and USNA databases. USNA contains virtually all of the Bureau of Economic Analysis detail in the national accounts. The Action Economics consensus estimates can be found in AS1REPNA.

Sandy Batten
AuthorMore in Author Profile »Sandy Batten has more than 30 years of experience analyzing industrial economies and financial markets and a wide range of experience across the financial services sector, government, and academia. Before joining Haver Analytics, Sandy was a Vice President and Senior Economist at Citibank; Senior Credit Market Analyst at CDC Investment Management, Managing Director at Bear Stearns, and Executive Director at JPMorgan. In 2008, Sandy was named the most accurate US forecaster by the National Association for Business Economics. He is a member of the New York Forecasters Club, NABE, and the American Economic Association. Prior to his time in the financial services sector, Sandy was a Research Officer at the Federal Reserve Bank of St. Louis, Senior Staff Economist on the President’s Council of Economic Advisors, Deputy Assistant Secretary for Economic Policy at the US Treasury, and Economist at the International Monetary Fund. Sandy has taught economics at St. Louis University, Denison University, and Muskingun College. He has published numerous peer-reviewed articles in a wide range of academic publications. He has a B.A. in economics from the University of Richmond and a M.A. and Ph.D. in economics from The Ohio State University.
More Economy in Brief
 Global