Housing Starts: Upward Revisions to June & July, but a Drop in August
Summary
- A drop in multi-family activity in August offset a gain in the single-family sector.
- Q3 shaping up to be another soft quarter for housing.
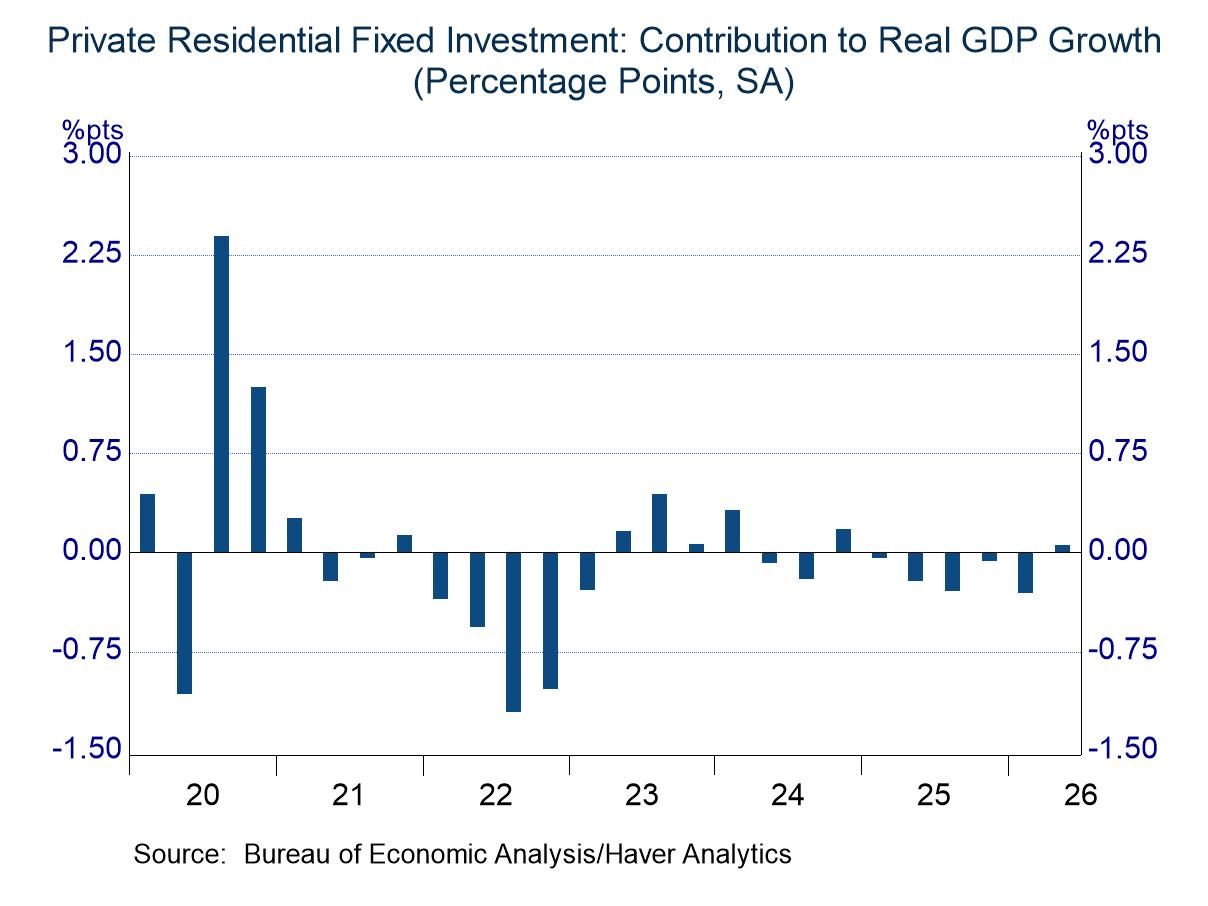
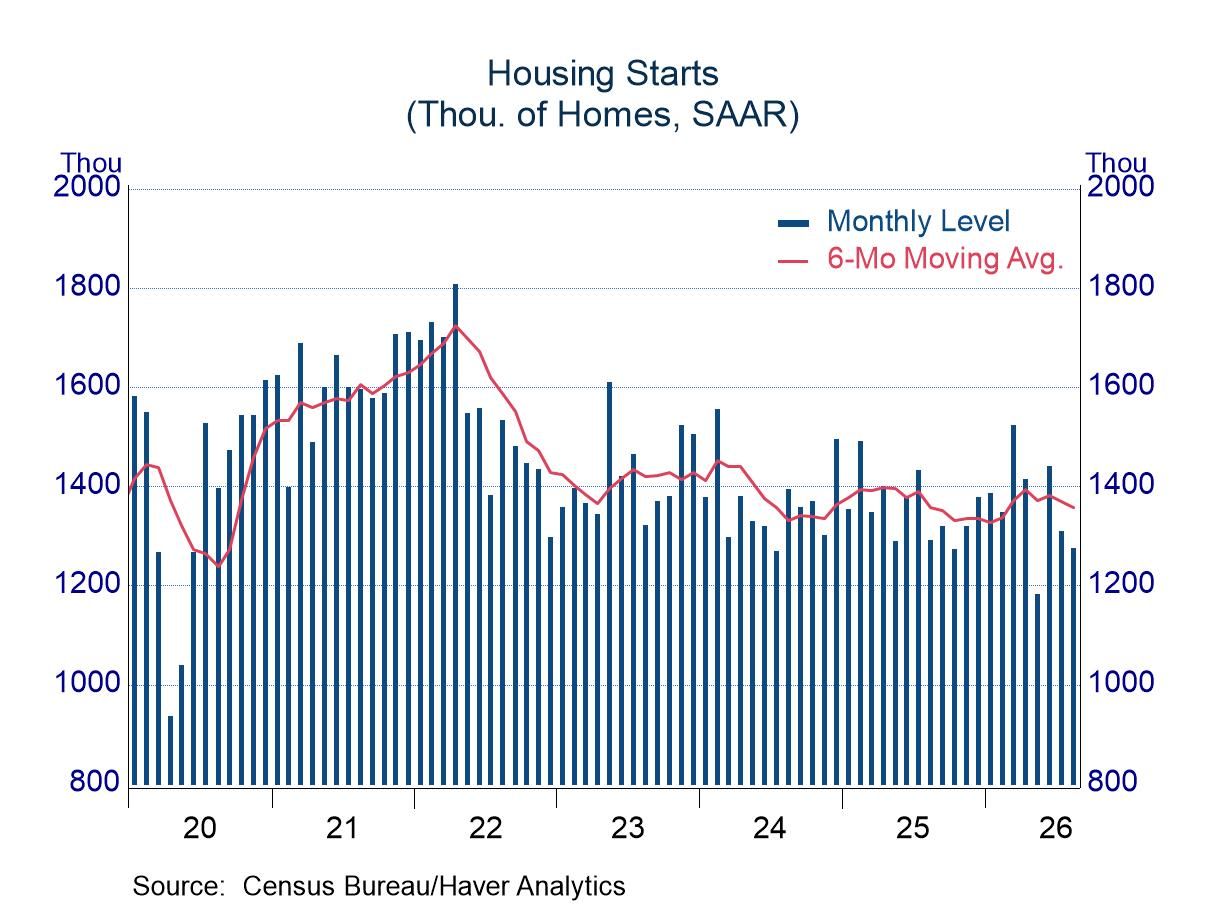
Housing activity has been sluggish in the past few years, with private residential construction making negative contributions to GDP growth in seven of the past 10 quarters. The constraints have been small, averaging -0.06 percentage point, but a drag nonetheless (chart, upper left). The third quarter is on track for another negative contribution, as housing starts in July and August trail the average in the prior quarter by 3.9%.
Total housing starts in August were soft, declining 2.6%. The drop occurred from an upward revised reading in July (5.7% firmer than previously believed), but the initial reading was not impressive, and the adjusted level was still in the low portion of the recent range. The drop in August pushed total starts further into the low portion of the range (the fourth lowest since the start of 2023; chart, upper right).
It is tempting to dismiss the decline in August as random volatility, as the change was dominated by a retreat in the volatile multi-family sector (off 21.7%). We have seen similar degrees of multi-family noise in other recent months (-41.4% in May and a rebound of 83.3% in June). As such, there is a good chance that September will show a pickup in multi-family starts. However, a focus on trends still suggests a soft tone in housing.
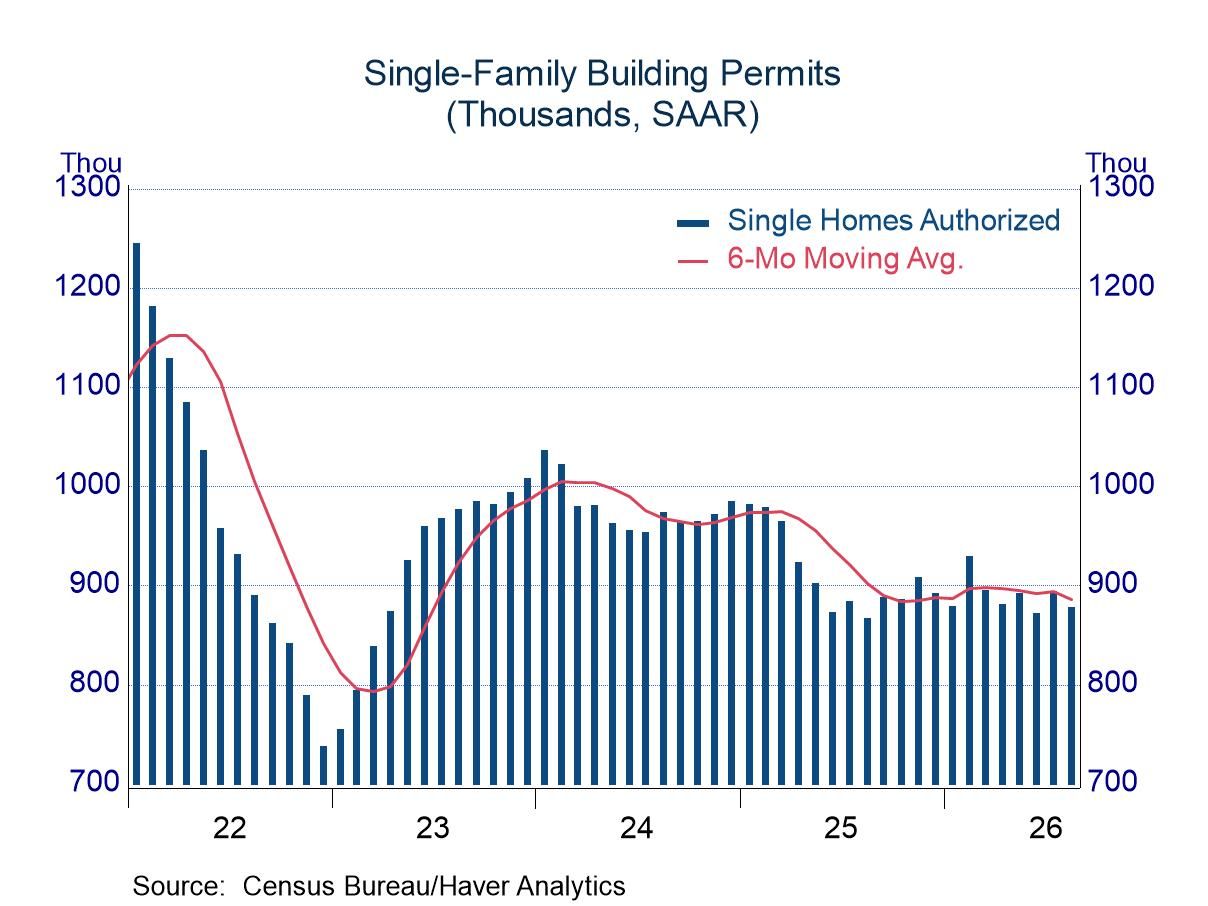
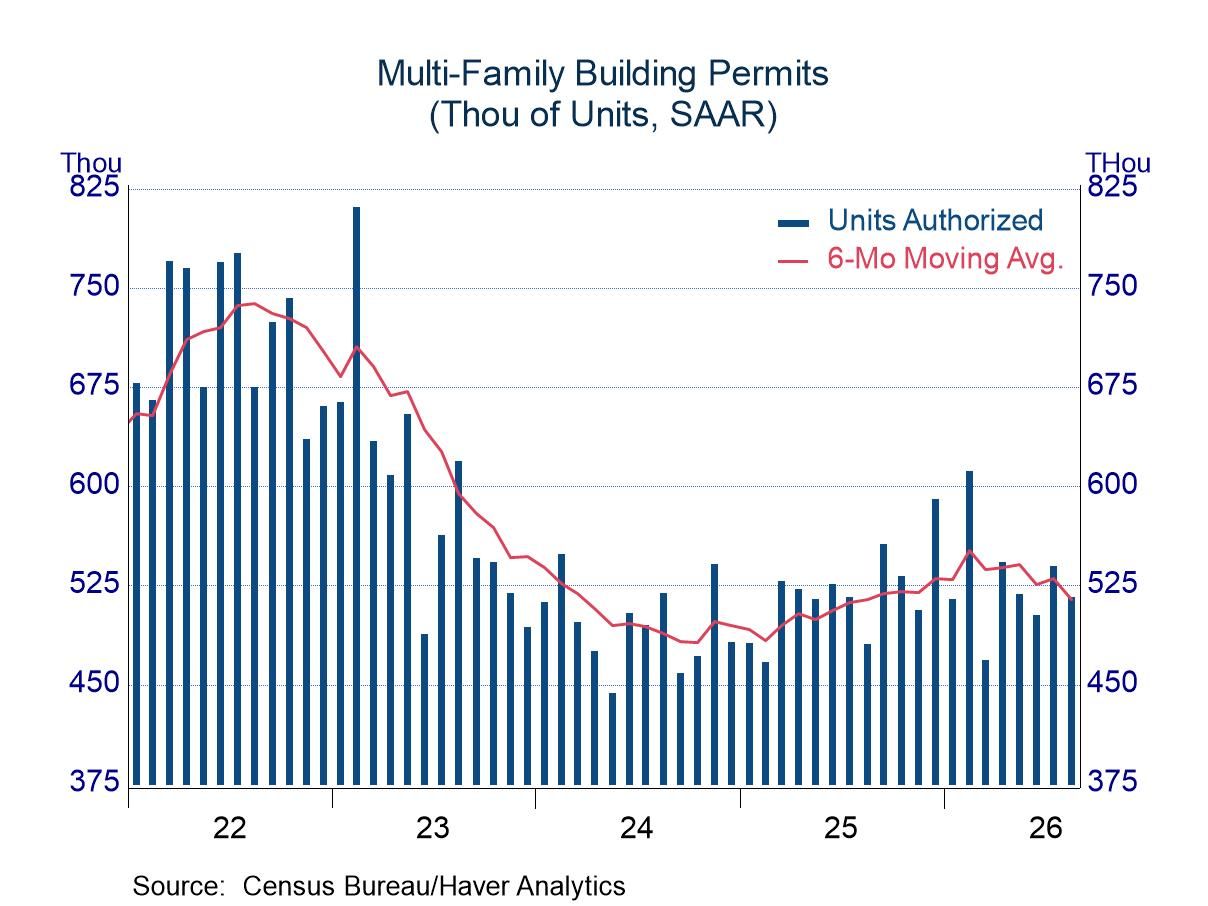
In seeking to identify housing trends, building permits, because they are less volatile, provide more insight than starts do. Single-family permits trended lower during much of 2024 and early 2025, and they have moved sideways since late last year, signaling little chance of a positive contribution to economic growth (chart, lower left). Multi-family permits drifted upward during 2025, but they have turned a corner so far this year, as shown by the six-month average in the lower right chart. The recent increase in long-term interest rates (up approximately one-half percentage point since June) leads one to worry about a softening in housing trends.
The housing starts and permits figures can be found in Haver’s USECON database. The expectations figure is contained in the AS1REPNA database.

Michael J. Moran
AuthorMore in Author Profile »Before joining Haver Analytics in 2025, Michael J. Moran was the chief economist of Daiwa Capital Markets America Inc. He was responsible for preparing the firm’s economic forecast and interest rate outlook. He traveled frequently to visit the clients of Daiwa Capital Markets and wrote weekly economic commentary. Mr. Moran also was involved in the flux of financial markets, as he spent a portion of each day on Daiwa’s trading floor interpreting economic statistics and Federal Reserve activity for traders and salespeople. Mr. Moran is quoted frequently in the financial press, and he appears regularly on cable news shows. He also has published articles in several journals and periodicals. Before joining Daiwa Capital Markets America, Mr. Moran worked as an economist at the Federal Reserve Board in Washington, D.C. where he analyzed a broad range of issues dealing with the financial sector of the economy and regularly briefed the Board of Governors. He was on the faculty of Pennsylvania State University from 1979 to 1980 and taught on a part-time basis at George Washington University from 1980 to 1987.
Mr. Moran received his Ph.D. in economics from Pennsylvania State University in 1980 and a B.S. in business administration from the University of Bridgeport in 1975. He was a CFA charter holder from 2002 until 2016.
More Economy in Brief
 Global