

Personal Income, Consumption, and Prices in June
Summary
- (Temporary?) relief on price pressures
- Respectable income gain and active spending by consumers
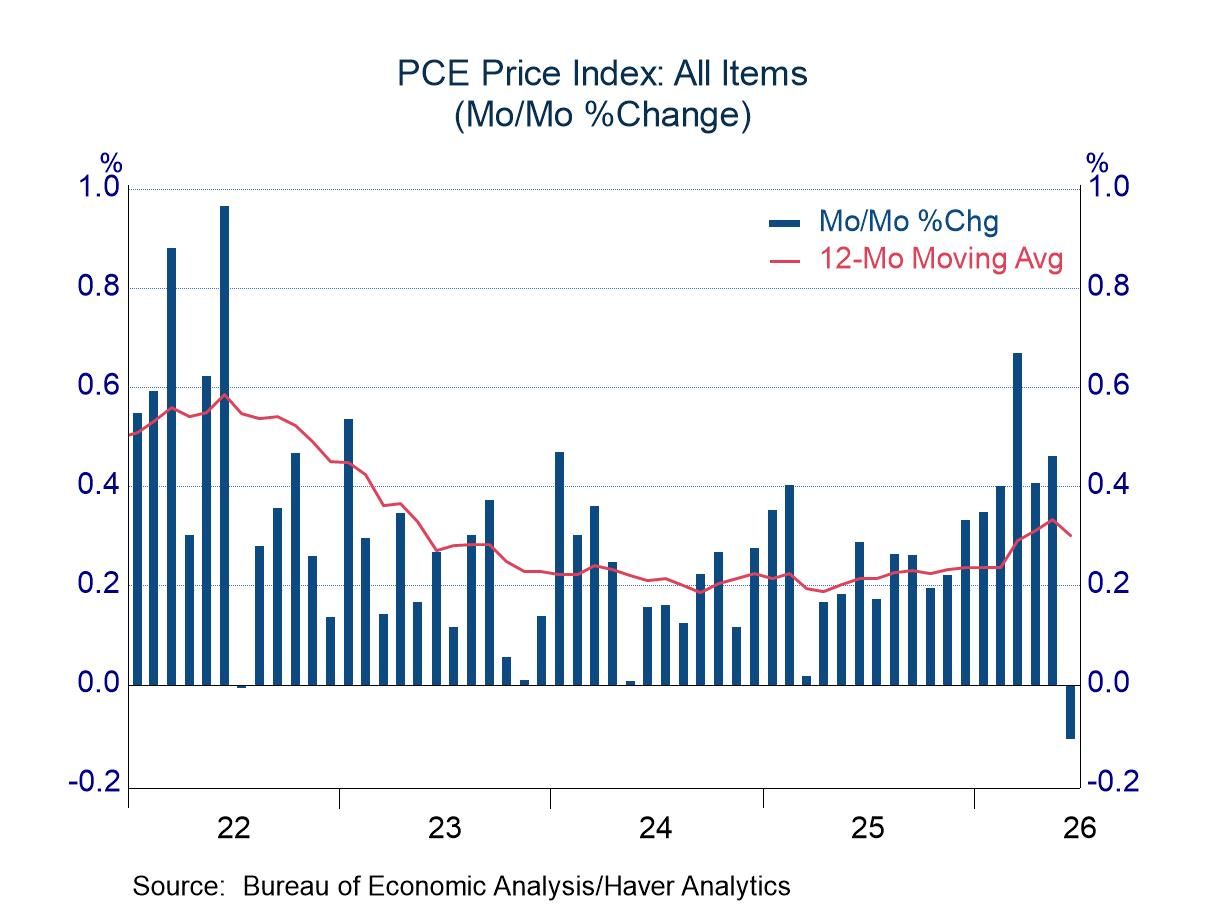
The price index for personal consumption expenditures, the inflation measure targeted by the Federal Reserve, fell 0.1% in June, led by a drop of 5.9% in the energy component. The decline pushed the year-over-year increase to 3.7%, down from 4.1% in May but still above readings of 2.9% in January and February, before the Iran conflict became a factor.
The drop in the energy component would be more encouraging were it not for the re-escalation of fighting with Iran and renewed pressure on oil prices. The average prices of crude oil and gasoline in July are likely to be below those in June, raising the prospect of another drop in the energy component of the PCE price index. However, prices near the end of the month climbed above the June average, leaving upside risks for August.
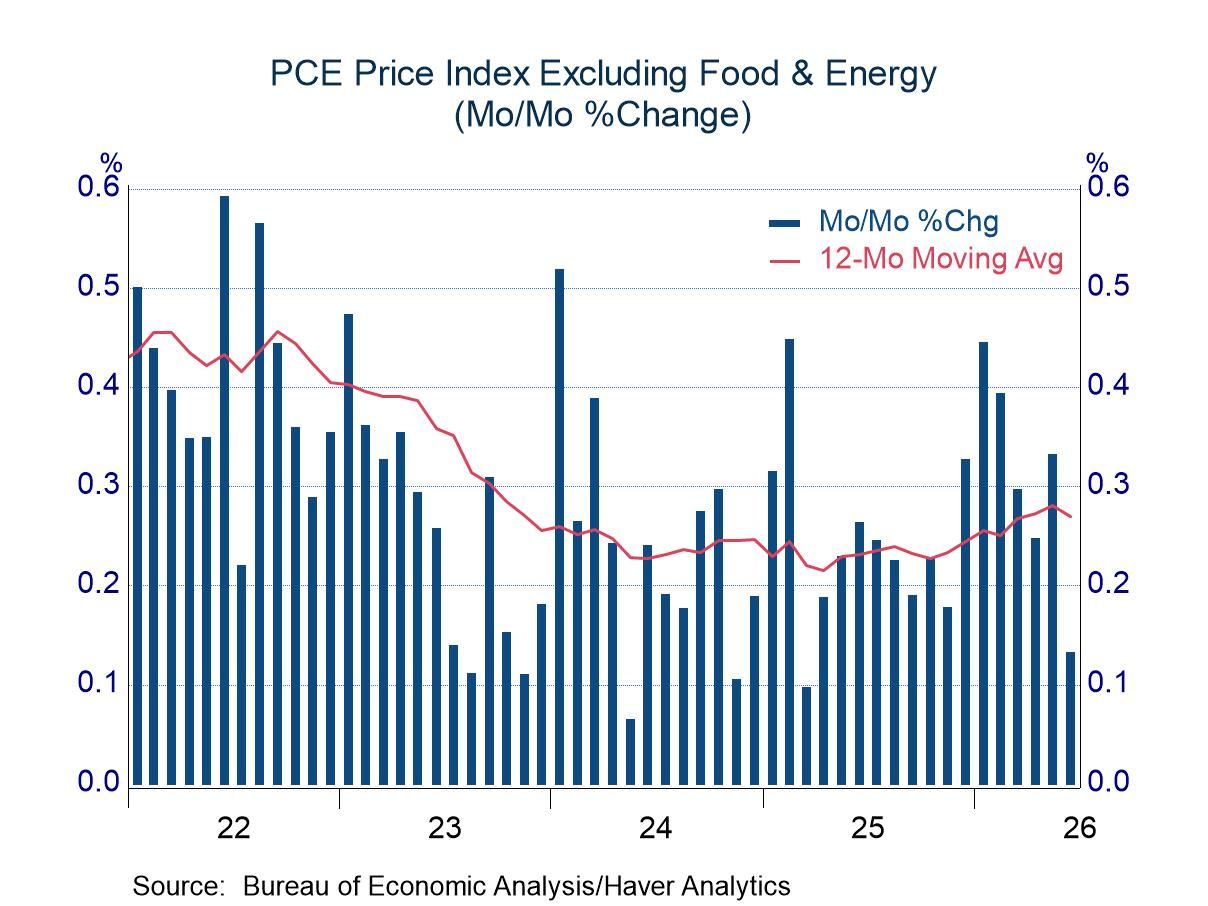
While the energy component dominated the change in the headline price index, other items also were restrained. Food prices rose 0.3%, although they almost rounded down to 0.2% (0.253%) and the monthly change was comfortably within the range of the past few years. The core index (excluding food and energy) rose only 0.1%, matching the lightest readings in the post-pandemic period (although a few observations were smaller if rounded to more than one decimal point). The core index has risen 3.3% in the past year, down from 3.4% in May, but still far above the Federal Reserve’s target of 2.0%.
The Fed pays close attention to a subcomponent of the core index (services excluding energy and housing), which has been responsible for much of the advance in the core index in recent years. This measure, too, was restrained in June (0.1%), but the year-over-year change of 3.8% remained near the top of the range of the past two years.
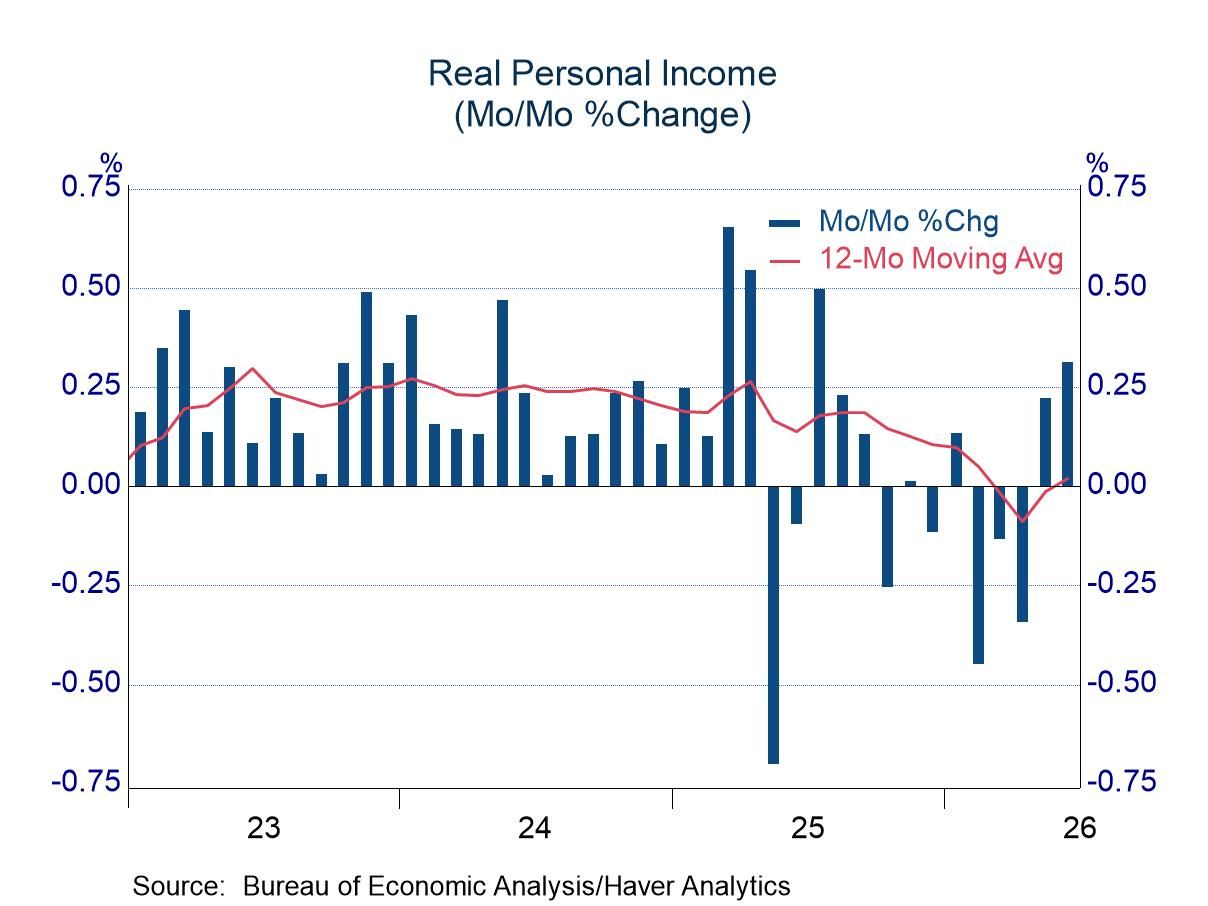
Personal income rose 0.2% in June, with employee compensation, non-farm proprietors’ income, and dividends all posting favorable results. The increase translated into a gain of 0.3% after adjusting for inflation, following an advance of 0.2% in May. The back-to-back increases are notable in that they perhaps signal the end of a soft patch that began in the closing months of 2025. The growth of real personal income slipped into negative territory in March, influenced by the surge in energy prices, but growth had been decelerating since October of last year and had slipped to a pace of less than 1.0% before the conflict with Iran became a factor. Results in the past two months suggest that real income growth might be returning to a firm path.
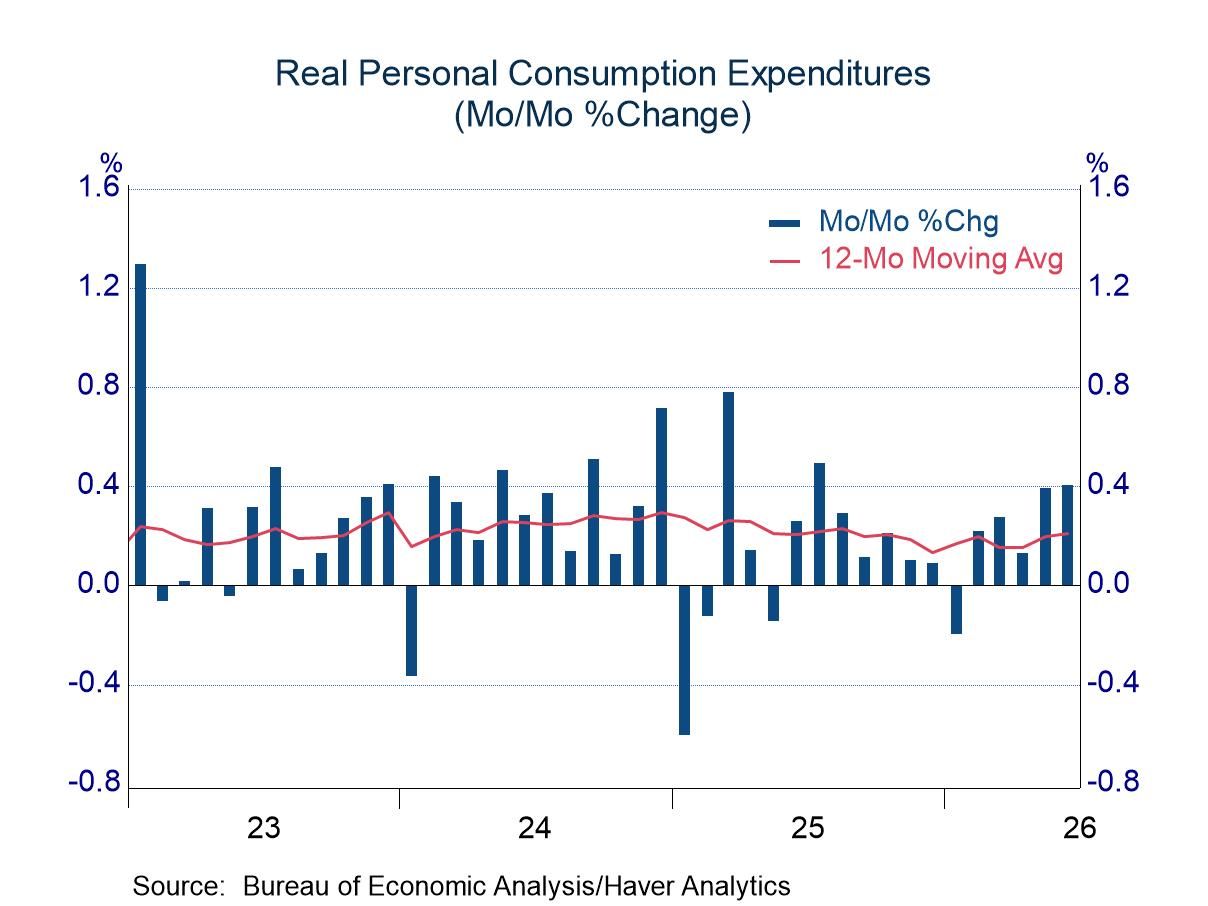
Real income growth in the past two months certainly supported spending by households, as real consumption expenditures rose 0.4% in both May and June. For the second quarter, the GDP report published today showed annual growth of 3.2%, a brisk pace. Moreover, the firm results at the end of the quarter brighten prospects for the third quarter. With real outlays in June already above the average for Q2, the summer quarter is likely to show a higher average than that in Q2. Indeed, even if real PCE remains unchanged over the July-September period, the average for Q3 would translate to real PCE growth of approximately 2.0% (annual rate).
The active spending by consumers has provided solid support for the economy, but it has come at the expense of an eroding saving rate. The saving rate averaged 5.5% in 2023 and 2024, peaking at 6.4% in January 2024. Deceleration since then left the saving rate at 2.7% in June. One could put either a positive or negative spin on the downward trend. An optimist could argue that wealth gains from the stock market are allowing many households to live the high life. Others might counter that affordability issues leave households with little ability to save. These explanations for a low saving rate are not mutually exclusive; both are likely having an influence.
Data on weekly unemployment claims are from the Department of Labor itself, not the Bureau of Labor Statistics. They begin in 1967 and are contained in Haver’s WEEKLY database and summarized monthly in USECON. Data for individual states are in REGIONW back to December 1986.

Michael J. Moran
AuthorMore in Author Profile »Before joining Haver Analytics in 2025, Michael J. Moran was the chief economist of Daiwa Capital Markets America Inc. He was responsible for preparing the firm’s economic forecast and interest rate outlook. He traveled frequently to visit the clients of Daiwa Capital Markets and wrote weekly economic commentary. Mr. Moran also was involved in the flux of financial markets, as he spent a portion of each day on Daiwa’s trading floor interpreting economic statistics and Federal Reserve activity for traders and salespeople. Mr. Moran is quoted frequently in the financial press, and he appears regularly on cable news shows. He also has published articles in several journals and periodicals. Before joining Daiwa Capital Markets America, Mr. Moran worked as an economist at the Federal Reserve Board in Washington, D.C. where he analyzed a broad range of issues dealing with the financial sector of the economy and regularly briefed the Board of Governors. He was on the faculty of Pennsylvania State University from 1979 to 1980 and taught on a part-time basis at George Washington University from 1980 to 1987.
Mr. Moran received his Ph.D. in economics from Pennsylvania State University in 1980 and a B.S. in business administration from the University of Bridgeport in 1975. He was a CFA charter holder from 2002 until 2016.
More Economy in Brief
 Asia
Asia
