U.S. GDP Increased 1.5% in Q2
by:Sandy Batten
|in:Economy in Brief
Summary
- The quarterly gain was led by personal consumption and business spending on equipment and intellectual property.
- Inventory investment and net exports were meaningful drags on overall growth.
- Domestic demand growth accelerated to well above trend.
- Reflecting the jump in energy prices after the escalation of the US-Iran conflict, GDP inflation accelerated markedly.
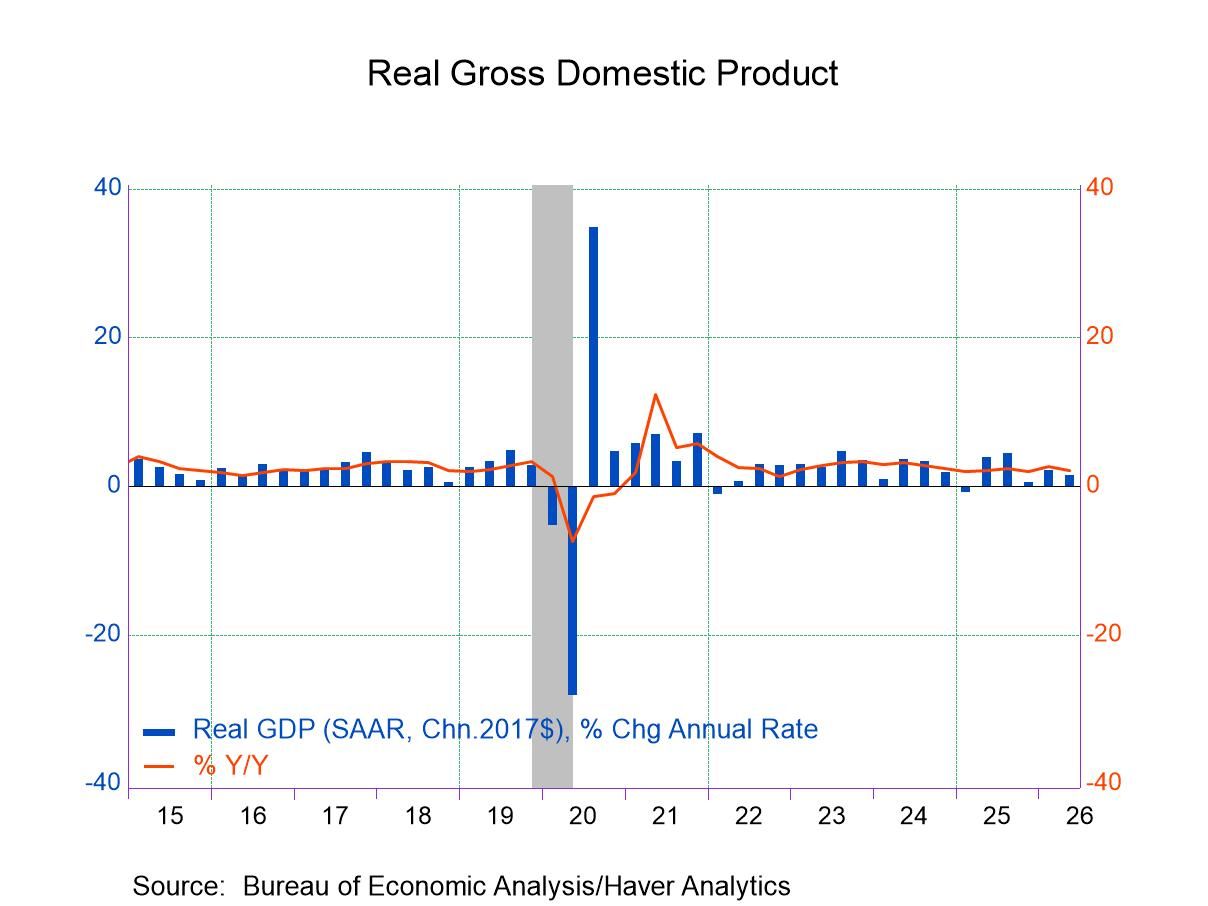
Real GDP grew 1.5% q/q saar in Q2 following a 2.1% increase in Q1, according to the Advance release from the BEA. The Action Economics Forecast Survey looked for a 2.3% quarterly gain. Compared with a year ago, GDP was up 2.1%. The slightly subpar performance in the second quarter was due mostly to significant drags exerted by trade and inventory investment. A 11.5% quarterly surge in imports widened the trade deficit markedly resulting in net exports subtracting 1.0%-point from overall growth. Inventory investment declined $50.8 billion (2017$) in Q2, subtracting 0.7%-point. This was the fifth consecutive quarter in which inventories declined, a very unusual occurrence when the economy is not in a recession.
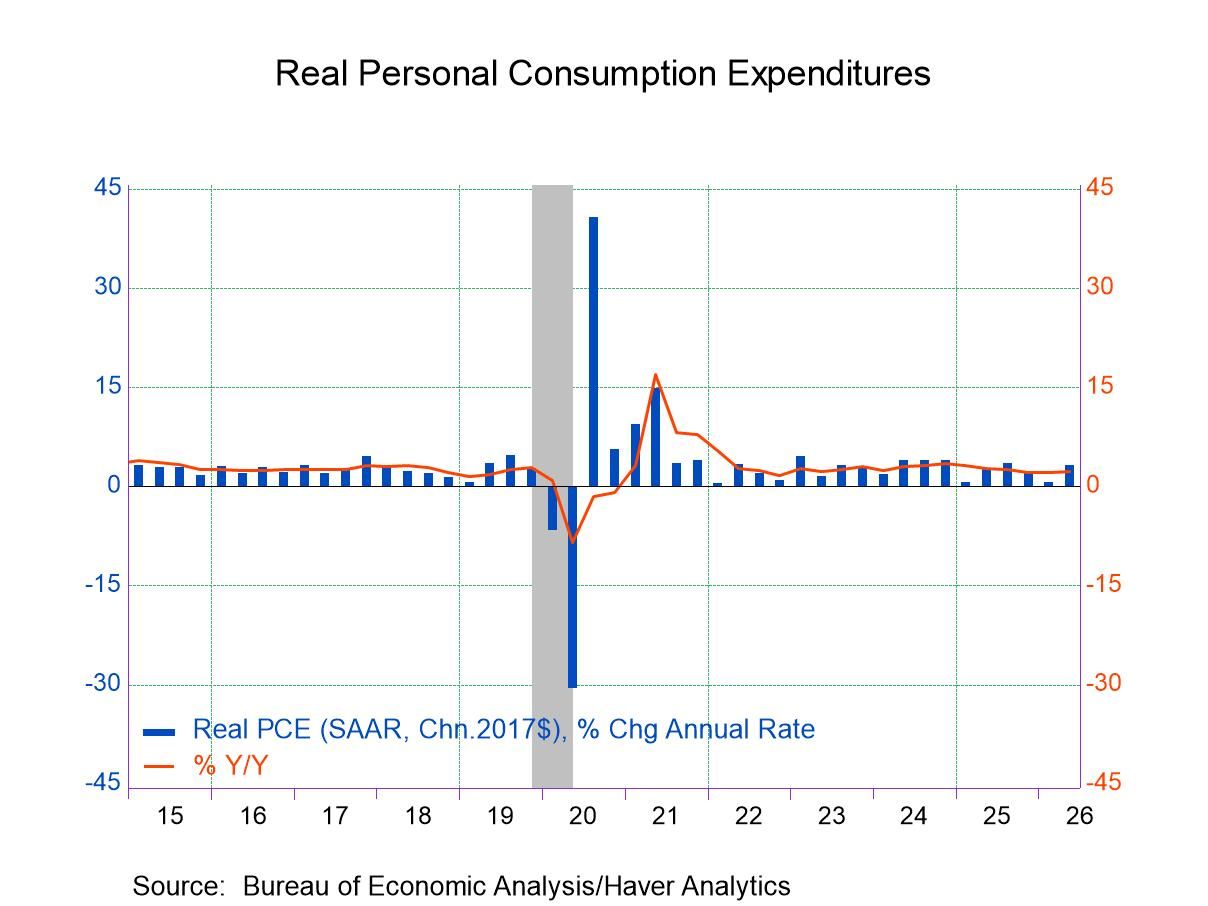
Personal consumption expenditures and business spending on equipment and intellectual property provided much of the boost to overall GDP growth in Q2. PCE grew 3.2% q/q saar in Q2, accounting for 2.1%-points of overall GDP growth, after a tepid 0.5% quarterly increase in Q1. The Q2 rebound was led by a 5.2% quarterly jump in spending on goods (a 6.8% rise in spending on durables and a 4.4% increase in spending on nondurables) although spending on services rose a solid 2.2%. Larger-than-normal income tax refunds this year likely played a key role in the rebound in PCE in Q2.
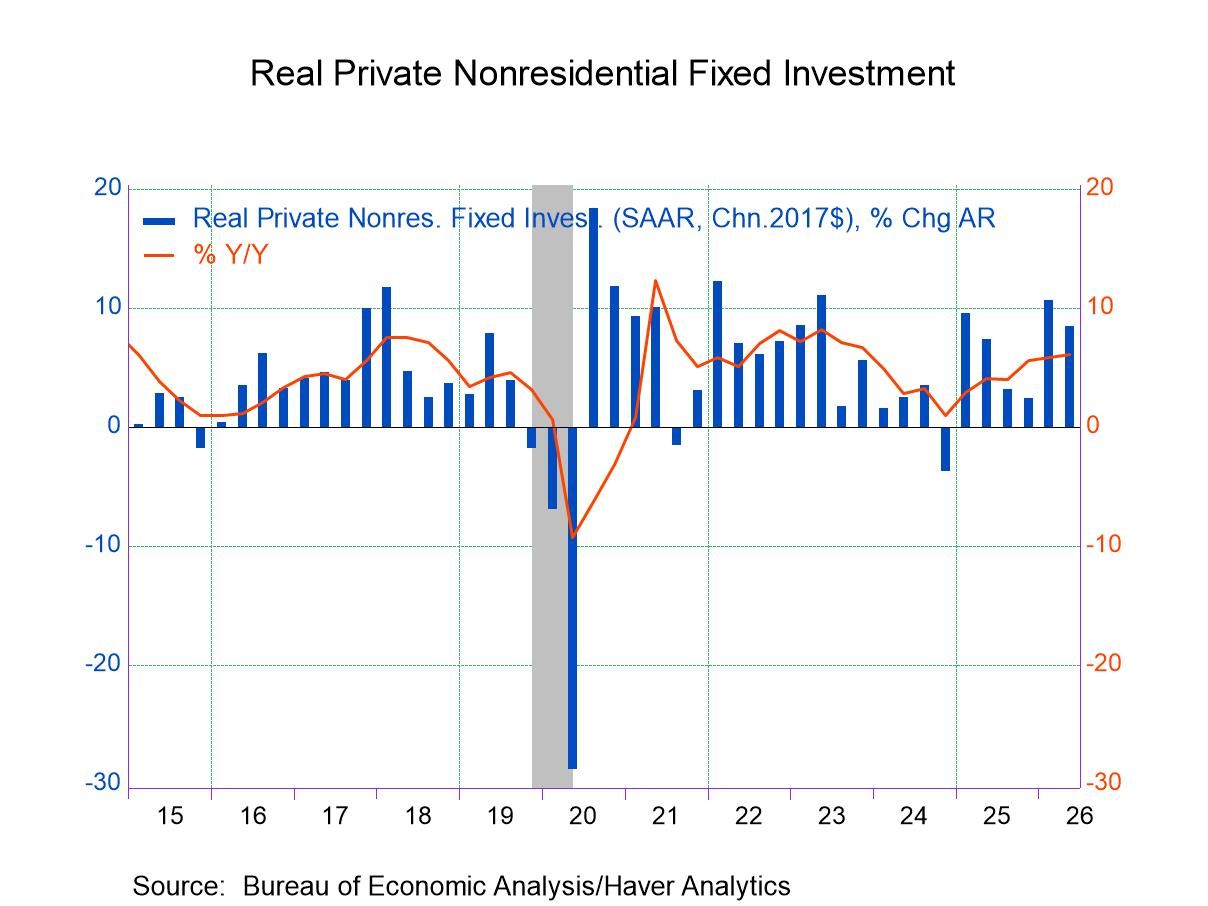
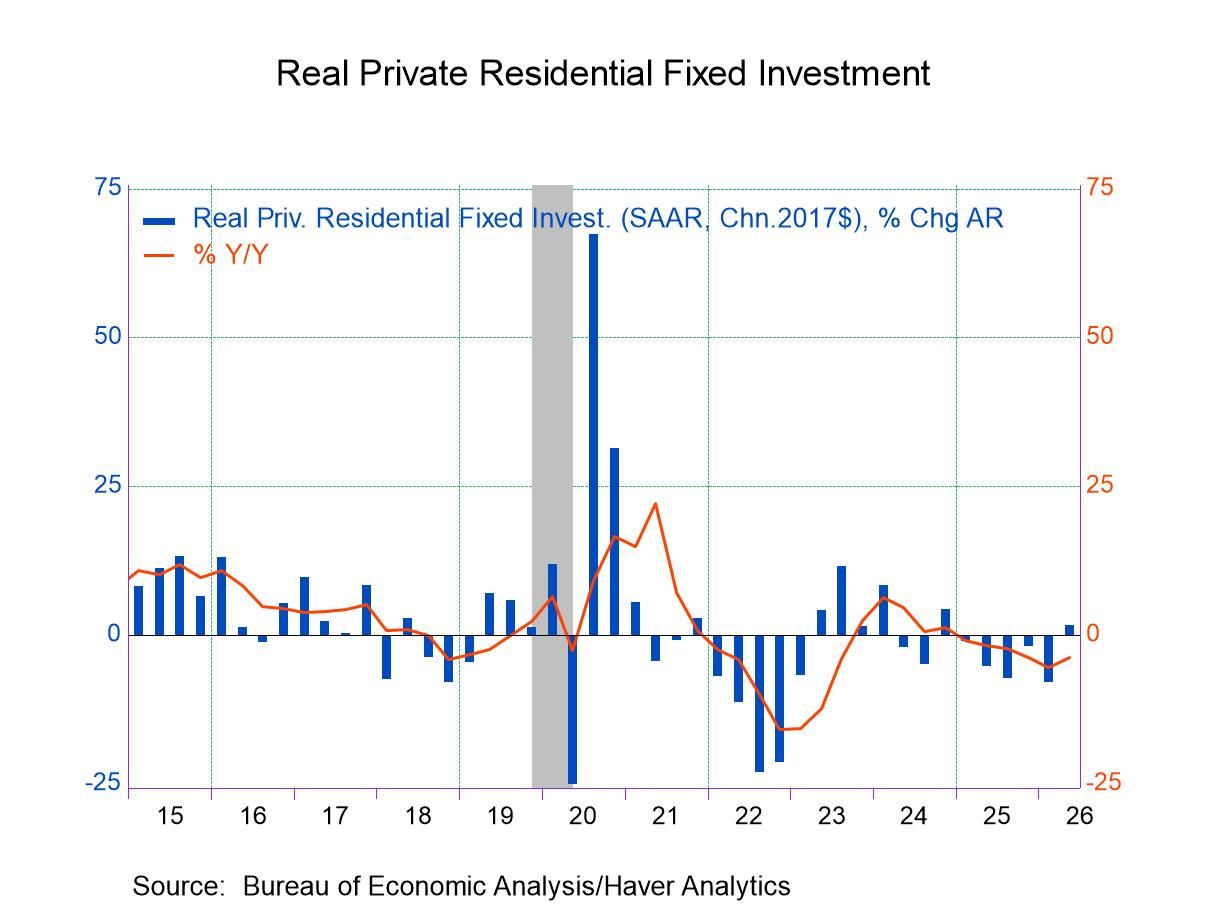
Business spending on equipment posted a second consecutive double-digit quarterly gain in Q2, increasing 15.2% on top of a 15.8% quarterly gain in Q1. Business spending on intellectual property increased a solid 8.8% in Q2 though a slowdown from the 13.8% quarterly jump in Q1, due mostly to a slowdown in spending on software. Together, these two added 1.3%-points to total GDP growth. Surprisingly, residential construction added marginally to GDP growth in Q2, posting its first quarterly gain in six quarters. It edged up 1.5% q/q and contributed just 0.1%-point to total GDP growth.
In addition to the drags from weaker inventory investment and a wider trade deficit, business construction spending and federal government spending also subtracted from Q2 GDP growth. In sharp contrast to the strength of business spending on equipment and intellectual property, business construction spending fell 5.0% q/q in Q2, its tenth consecutive quarterly decline, and subtracted 0.1%-point from total growth. Building of data centers has been vigorous, but softness in offices and manufacturing facilities has dwarfed the strength in this relatively new area.
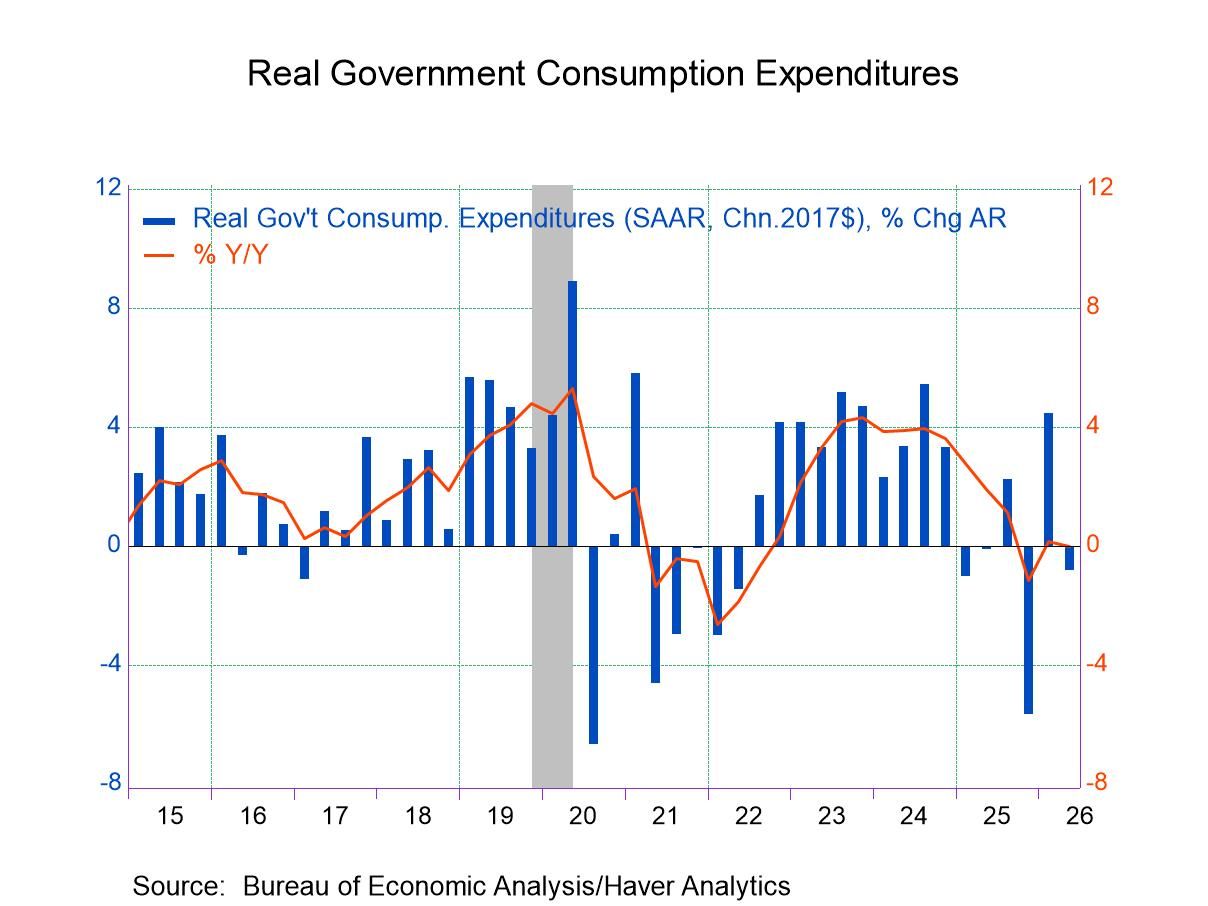
Total government spending fell 0.8% q/q in Q2 after a 4.4% rebound in Q1, subtracting 0.1%-point from overall growth. A 12.8% q/q slump in federal government nondefense spending accounted for the decline in total government spending. Federal defense spending rose 2.4% and state and local government spending increased 1.1%. Federal defense spending most likely will pick up further in coming quarters because of the escalating conflict in the Middle East.
Led by the solid gains in personal consumption expenditures and business spending, domestic demand posted stellar growth in Q2. Real final sales to domestic purchasers (GDP less inventory investment and net exports) increased a well above trend 3.1% q/q saar in Q2 after a 2.2% quarterly increase in Q1. Compared to a year ago, this measure of domestic demand was up 2.2%. Real final sales to private domestic purchasers (the Fed’s preferred measure of domestic demand) jumped 3.9% q/q in Q2, its largest quarterly gain since Q1 2023, to be up 2.6% from a year ago.
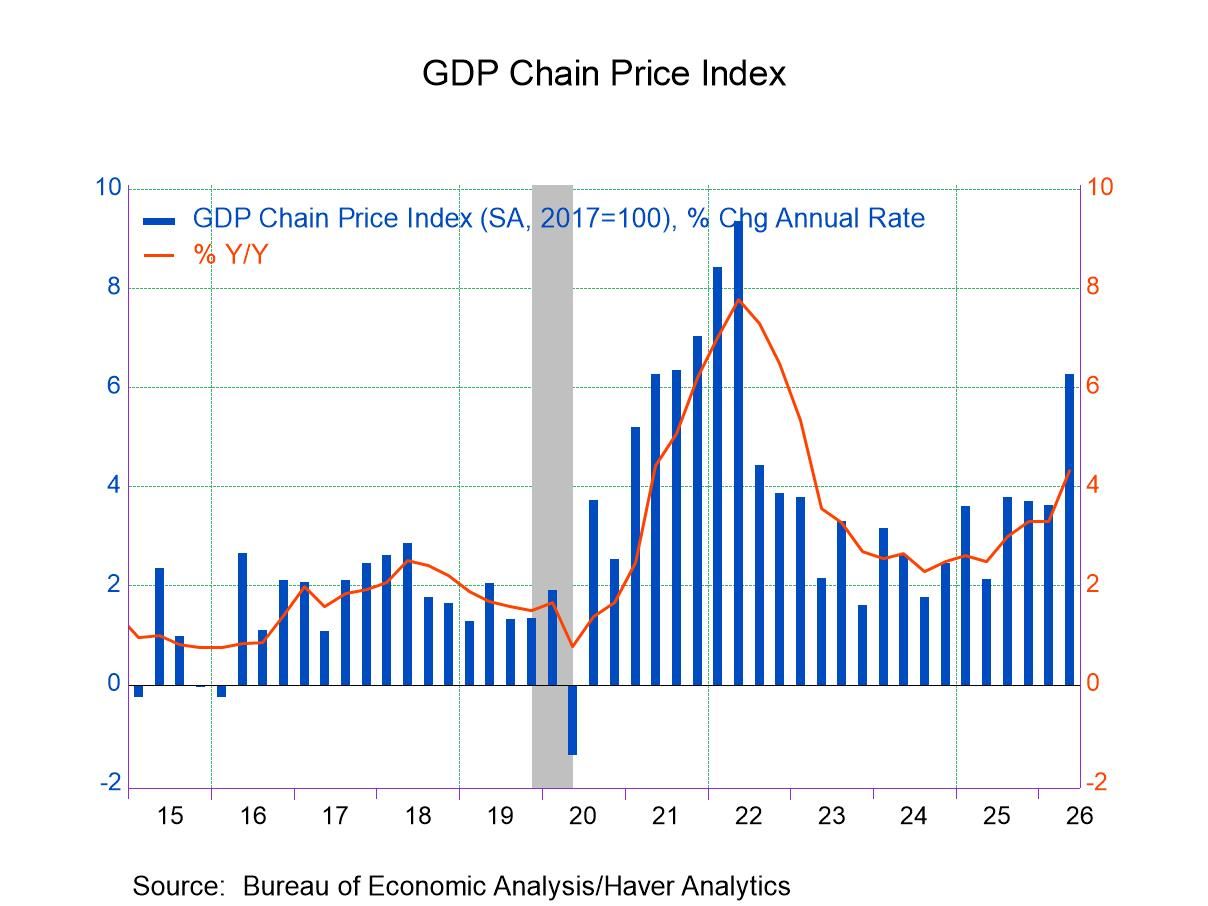
As was generally expected given the surge in energy prices following the escalation of the US-Iran conflict in early March, the GDP price index jumped 6.2% q/q saar in Q2 after rising 3.6% in Q1, reflecting an 87% annualized rise in energy prices. The PCE price index also reflected the jump in energy prices, rising 5.1% q/q in Q2 versus 4.6% in Q1. The performance of the core GDP and PCE price indexes (that is, excluding food and energy prices) was less worrisome. The core GDP price index was up 4.4% in Q2 versus a 3.2% quarterly gain in Q1. However, core PCE price inflation slowed to 3.4% in Q2 from 4.4% in Q1.
The GDP data can be found in Haver’s USECON and USNA databases. USNA contains virtually all of the Bureau of Economic Analysis detail in the national accounts. The Action Economics consensus estimates can be found in AS1REPNA.

Sandy Batten
AuthorMore in Author Profile »Sandy Batten has more than 30 years of experience analyzing industrial economies and financial markets and a wide range of experience across the financial services sector, government, and academia. Before joining Haver Analytics, Sandy was a Vice President and Senior Economist at Citibank; Senior Credit Market Analyst at CDC Investment Management, Managing Director at Bear Stearns, and Executive Director at JPMorgan. In 2008, Sandy was named the most accurate US forecaster by the National Association for Business Economics. He is a member of the New York Forecasters Club, NABE, and the American Economic Association. Prior to his time in the financial services sector, Sandy was a Research Officer at the Federal Reserve Bank of St. Louis, Senior Staff Economist on the President’s Council of Economic Advisors, Deputy Assistant Secretary for Economic Policy at the US Treasury, and Economist at the International Monetary Fund. Sandy has taught economics at St. Louis University, Denison University, and Muskingun College. He has published numerous peer-reviewed articles in a wide range of academic publications. He has a B.A. in economics from the University of Richmond and a M.A. and Ph.D. in economics from The Ohio State University.
More Economy in Brief


 Global