Global| Sep 10 2026
Charts of the Week: The Reflationary Turn
by:Andrew Cates
|in:Economy in Brief
Summary
Financial markets have entered September in an awkward mood. Global equities have advanced, but long-term bond yields have risen towards multi-decade highs as the European Central Bank meets this week and the Federal Reserve and Bank of Japan prepare to follow. The common thread is a turn towards reflation: growth is firming while inflation remains stubborn. Growth surprises have improved relative to inflation surprises, supporting equities (chart 1), while policy uncertainty has retreated from its peak but remains unusually high (chart 2). Most major economies are now on the expansionary side of the growth-inflation cycle (chart 3). Yet supply-chain pressure is returning (chart 4), inflation has become more responsive to tight labour markets since 2020 (chart 5), and the rise in bond yields has been driven largely by higher real rates rather than inflation expectations (chart 6).
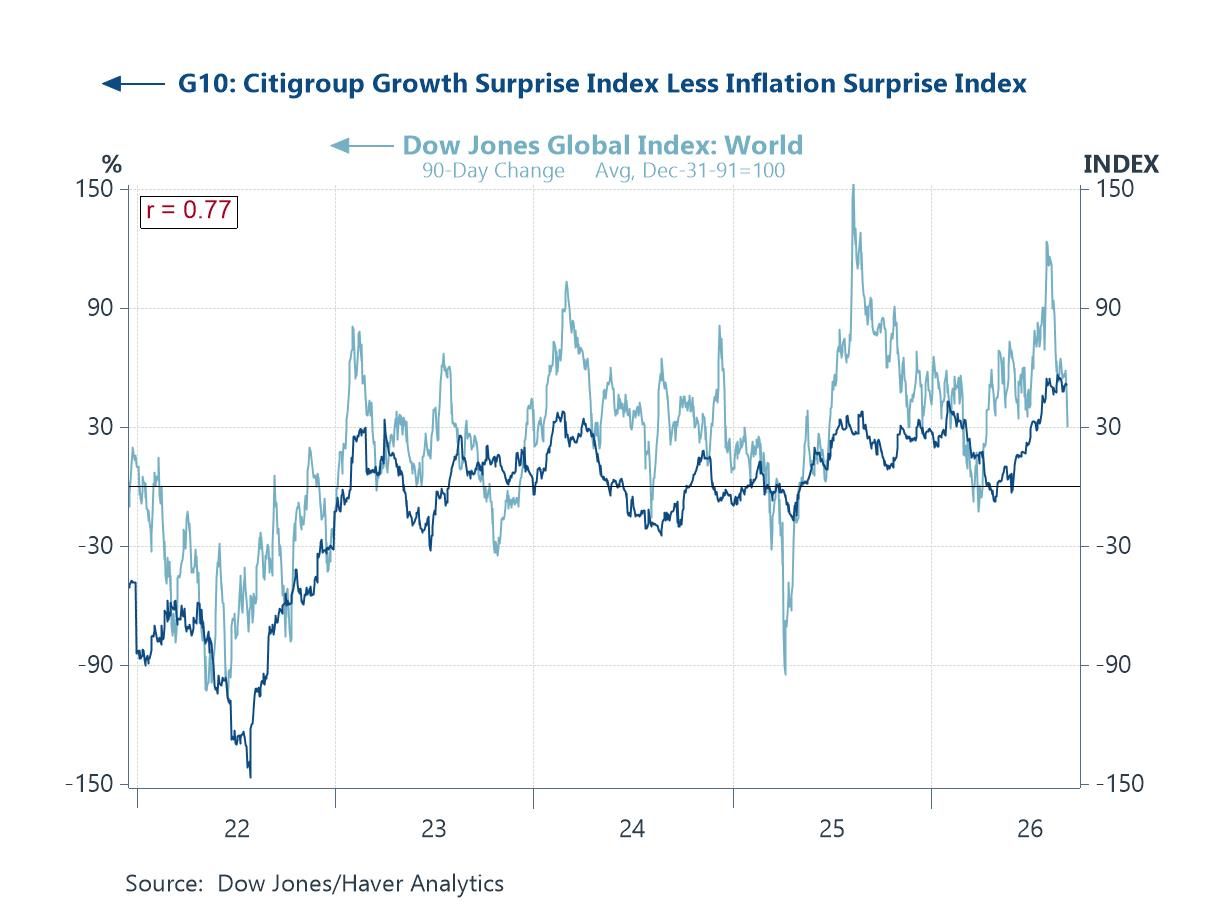
Growth surprises support the equity rally The balance of economic news has become more favourable for equities in recent weeks. Across the G10, growth data have increasingly beaten expectations, Incoming inflation data in the meantime have been surprising to the downside. And that differential (growth surprise compared with inflation surprise) has moved closely with global share prices. The relationship is intuitive: investors welcome stronger activity when it is not matched by a comparable rise in price pressure. And that helps explain why equities have remained resilient despite rising bond yields. But it is also a fragile configuration. This week's US producer- and consumer-price releases will show whether the improvement in US growth can continue without prompting a less benign reassessment of inflation and monetary policy.
Chart 1: G10 growth-minus-inflation surprises and world equities
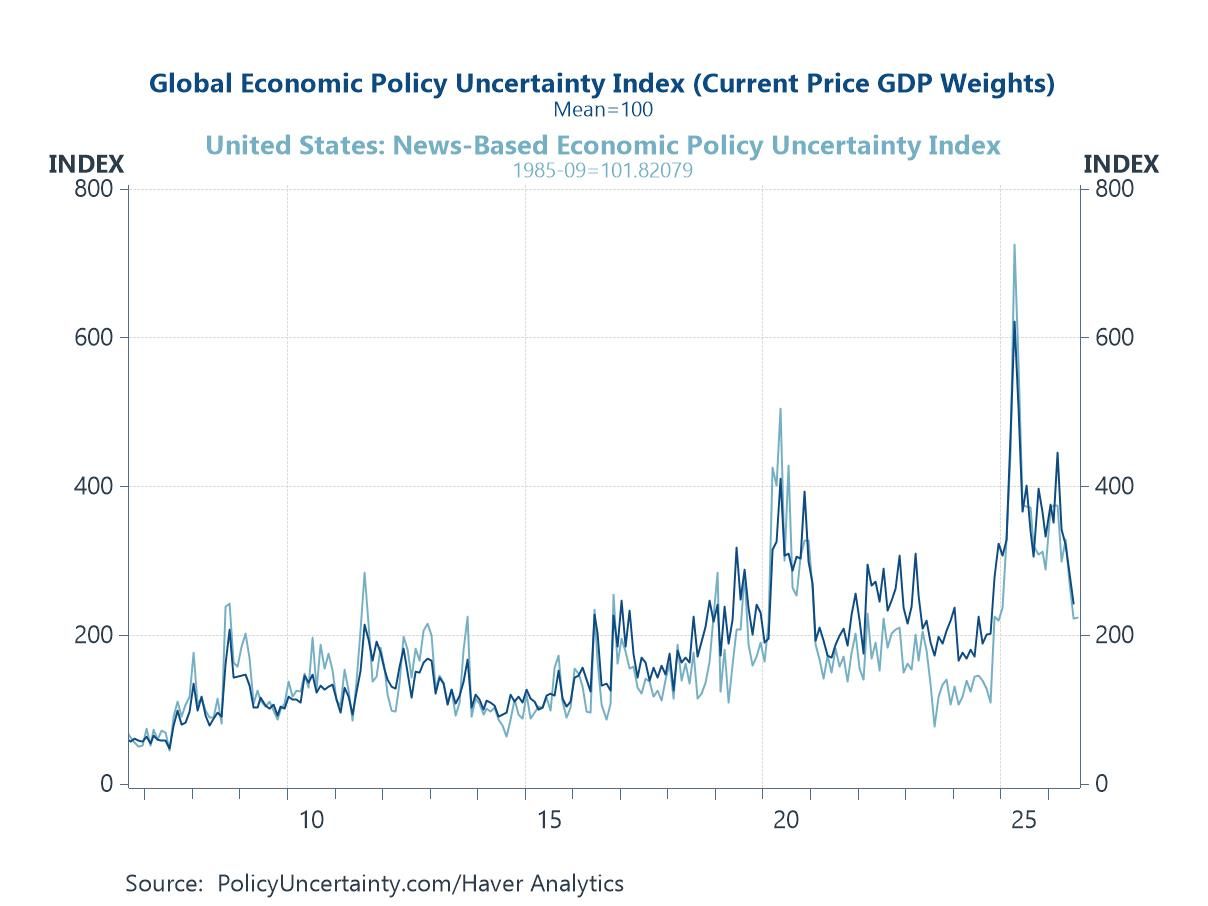
Uncertainty recedes, but remains high Some of that underlying resilience in the world economy arguably reflects a modest clearing of the policy fog. Global and US measures of economic policy uncertainty have fallen sharply from the peaks reached earlier this year. But both indices remain far above their long-run norms. The retreat has coincided with stronger equity markets, though the level still matters. Firms making investment decisions face continuing uncertainty over trade rules, costs and financing conditions. The economic outlook may have improved, but it rests on a policy environment that remains unusually unsettled.
Chart 2: Global and US economic policy uncertainty
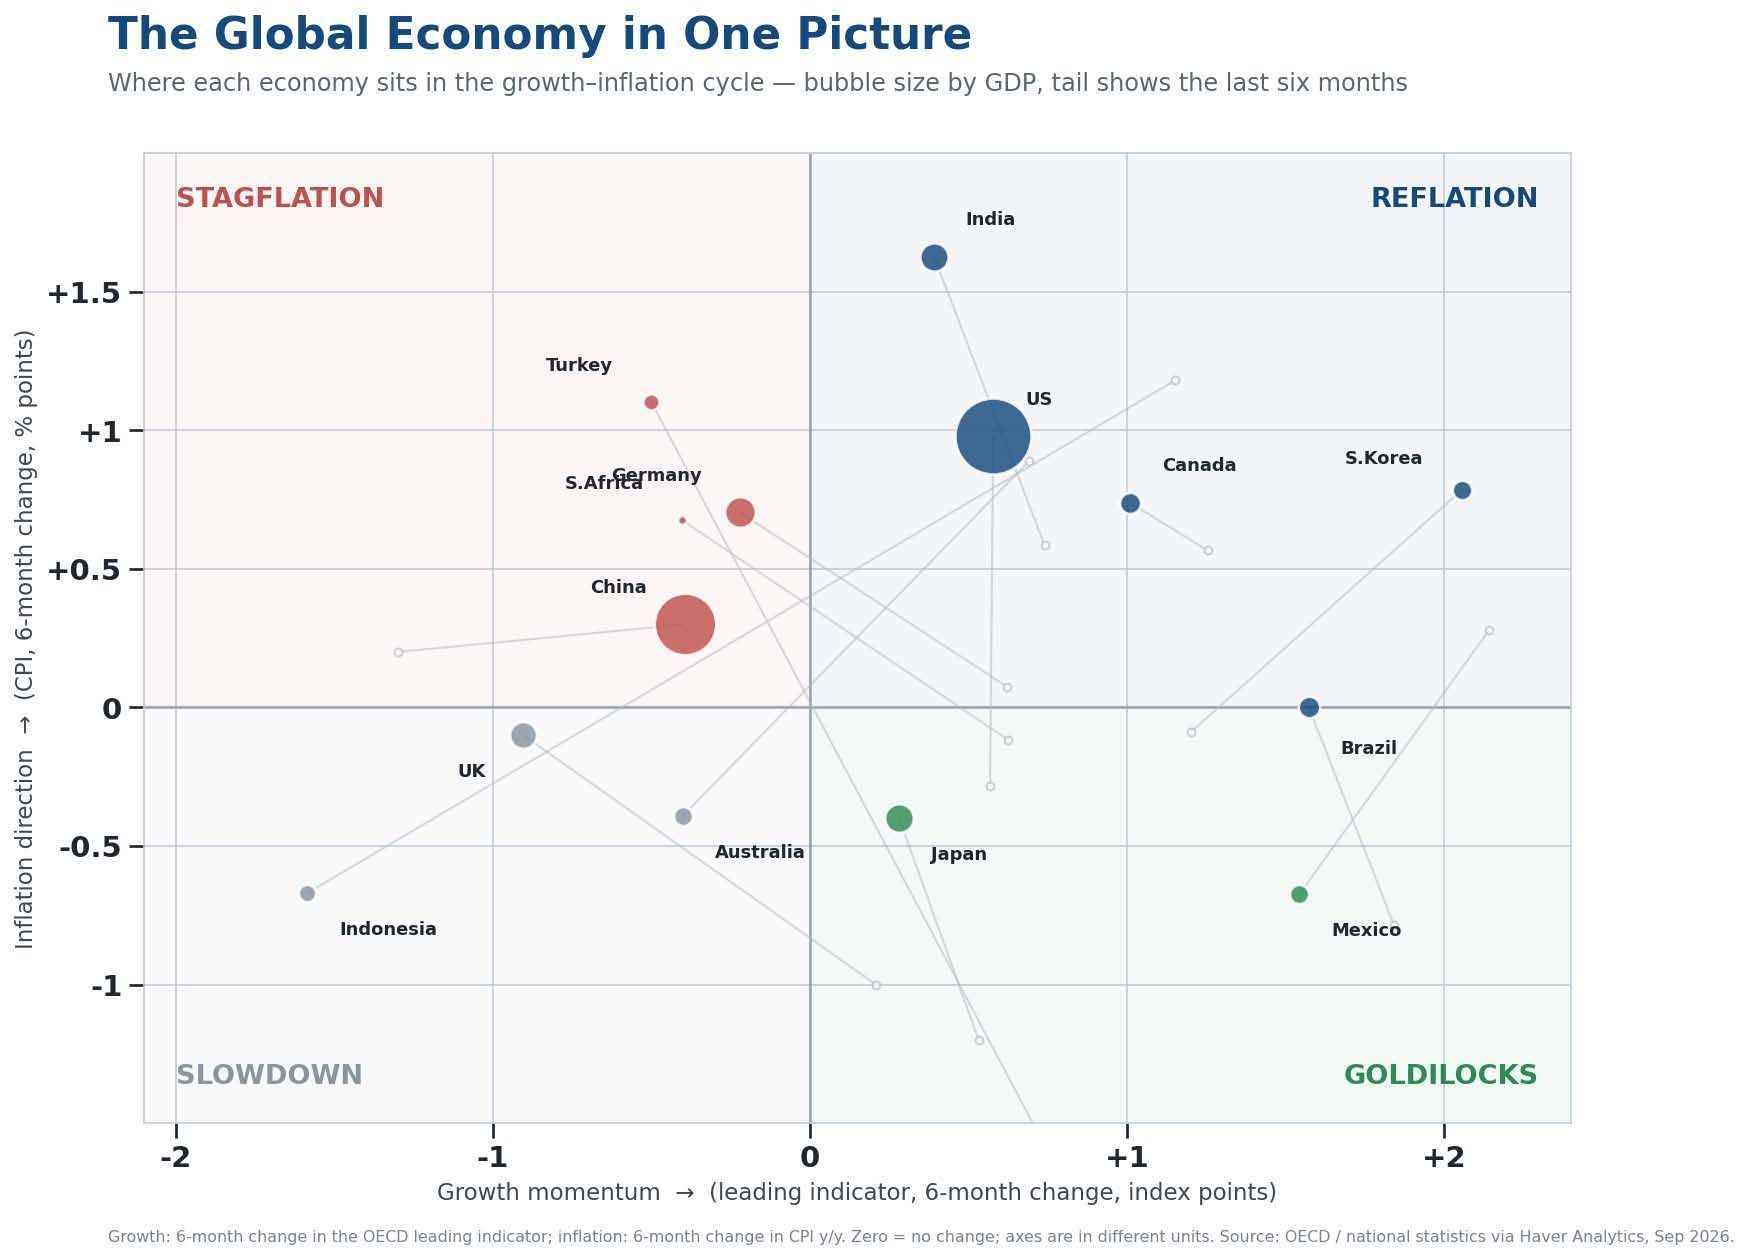
A world tilting towards reflation An AI-generated global growth-inflation map (see chart 3 below) points to an increasingly reflationary world economy. Built from OECD and national statistics, it positions each major economy by two gauges of momentum over the past six months — the change in its OECD composite leading indicator, a guide to the direction of growth, on one axis, and the change in consumer-price inflation on the other — with each bubble scaled to the size of the economy. The four quadrants that result correspond to reflation, where both are rising; stagflation, where growth fades while inflation climbs; a benign mix of firmer growth and easing prices; and a broad slowdown. The United States, India and South Korea sit in the first of these, where both growth and inflation momentum are strengthening. Japan and Mexico occupy the more benign position of improving activity and easing price pressure, while the United Kingdom, Australia and Indonesia remain in the slowdown quadrant. China is different again: growth momentum has weakened while inflation momentum has risen from an exceptionally subdued starting point. These positions describe changes over the past six months, not the level of growth or inflation. Even so, the dispersion might make a synchronised global monetary cycle less likely. Central banks are confronting quite different domestic conditions.
Chart 3: The global economy in the growth-inflation cycle; bubble size by GDP
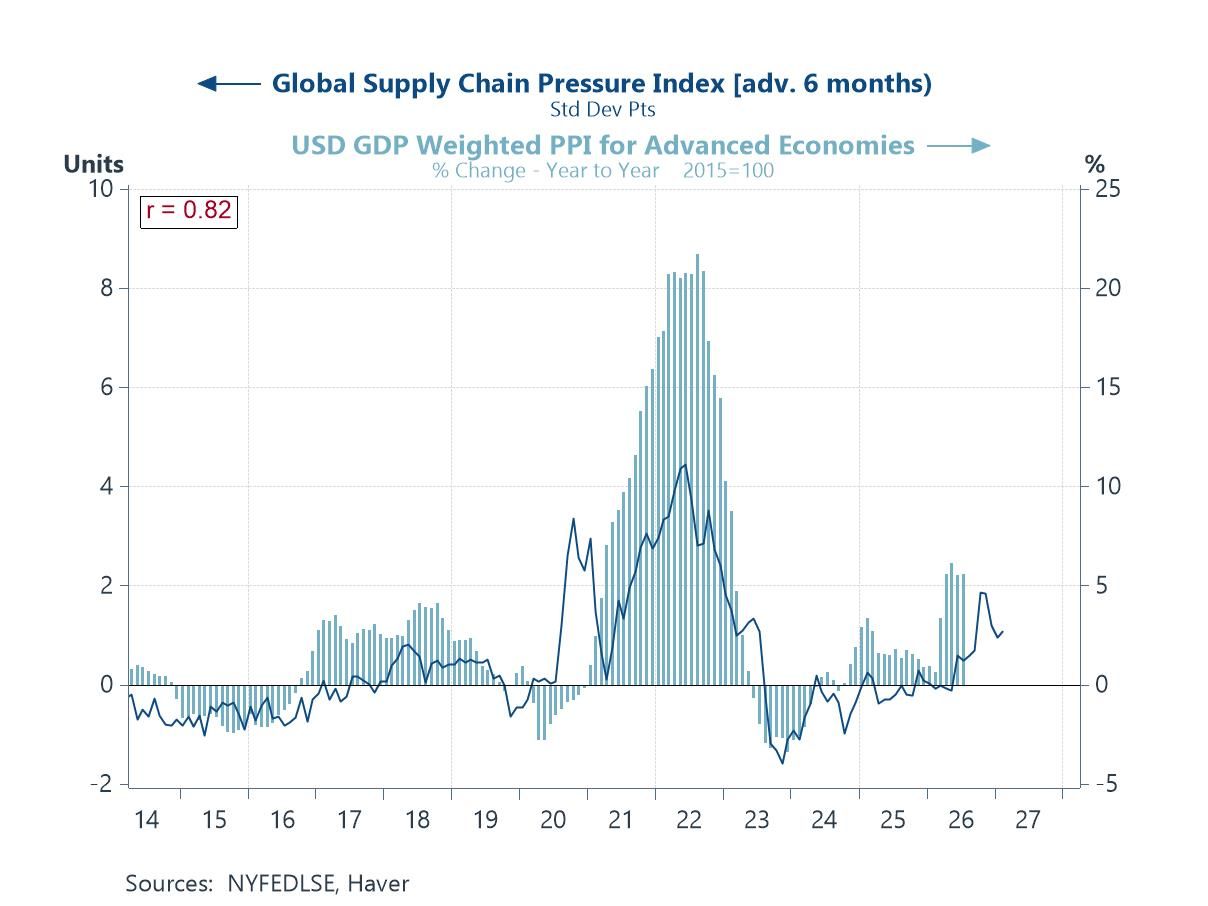
Supply pressure stirs again The reflationary turn also has a supply-side dimension. Global supply-chain pressure has risen again after the long normalisation that followed the disruption of 2021 and 2022. The index has historically led producer-price inflation in advanced economies by about six months, so its latest increase points to firmer price pressure in the production pipeline. This is a signal rather than a forecast: companies can absorb some higher costs in their margins, and the pass-through to consumers depends on demand. But it suggests that the goods disinflation which helped pull headline inflation lower may be losing force.
Chart 4: Global supply-chain pressure (advanced six months) and advanced-economy producer prices
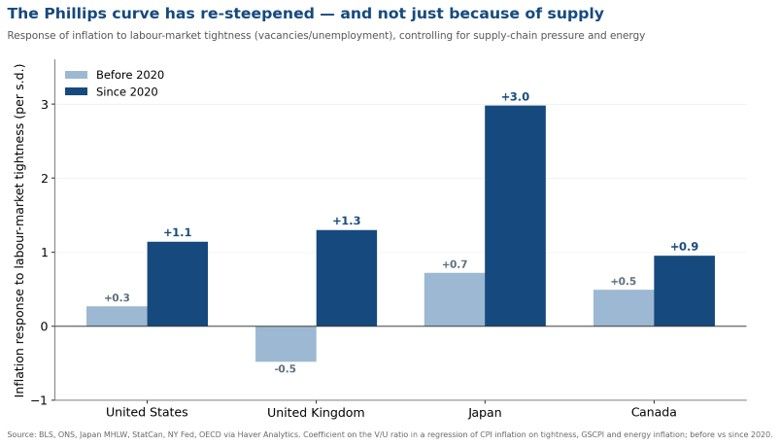
The Phillips curve steepens Renewed supply pressure matters more when domestic economies have little spare capacity. The Phillips curve, which describes the relationship between labour-market tightness and inflation, appears to have steepened since 2020 across the United States, the United Kingdom, Japan and Canada. Chart 5 below is built by regressing consumer-price inflation on the ratio of job vacancies to unemployment — a cleaner gauge of tightness than unemployment alone — while controlling for global supply-chain pressure and energy prices, and then comparing the estimated sensitivity before and since 2020. On that basis the result remains after allowing for supply-chain and energy shocks. In other words, a given increase in the ratio of job vacancies to unemployment is now associated with a larger rise in inflation than it was before the pandemic. Supply shocks still matter, but they may pass into wages and prices more readily when labour markets are tight. The final stage of disinflation could therefore prove more costly than the first.
Chart 5: The re-steepened Phillips curve
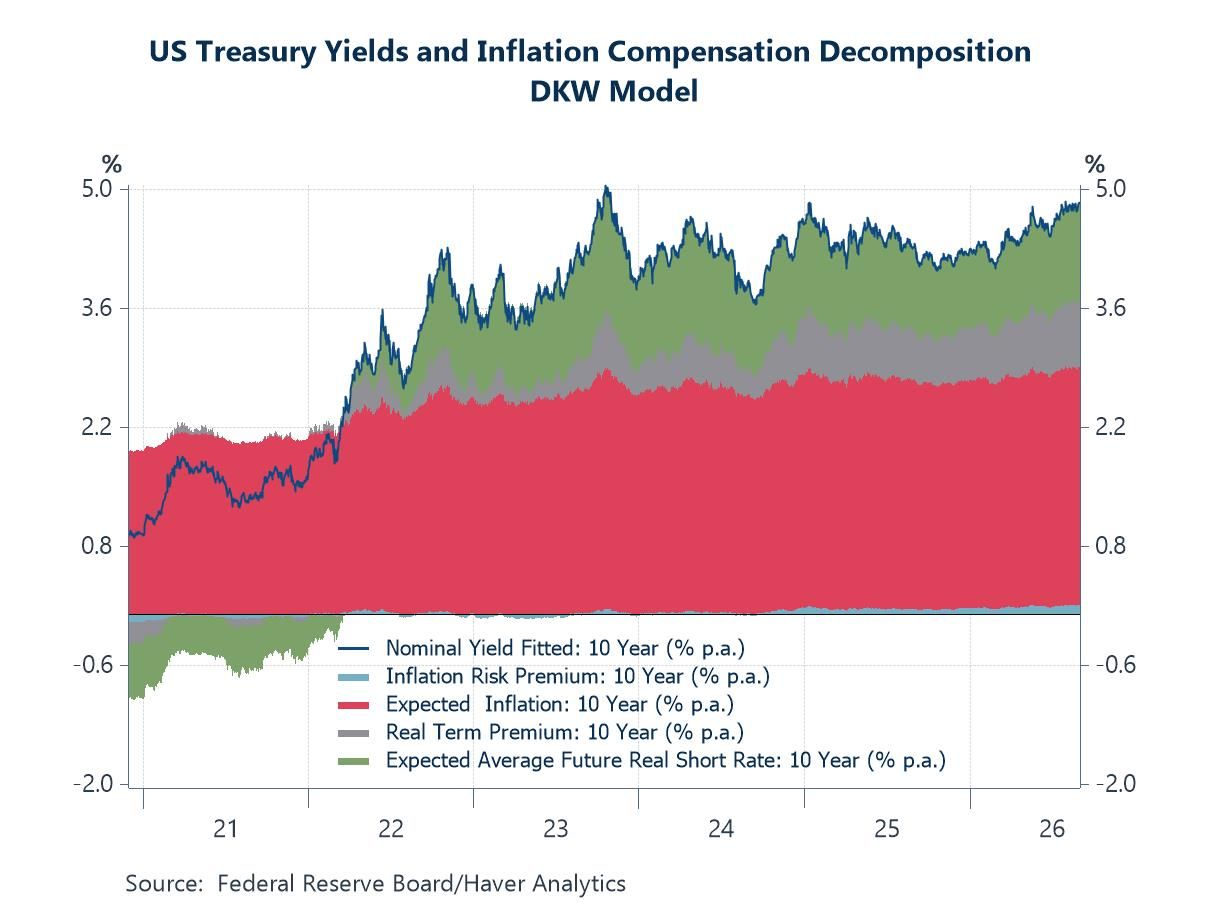
The rise in yields is a real-rate story This backdrop helps explain the move in the bond market. The recent rise in the US 10-year Treasury yield towards 5 per cent has not been driven mainly by inflation expectations, which remain broadly stable. The Federal Reserve's DKW model instead attributes much of the increase to higher expected real short-term rates and a larger real term premium, the extra return investors demand for holding long-dated debt. Markets are repricing the real cost of capital rather than signalling a collapse in the inflation anchor. Heavy government borrowing and strong investment in defence and artificial intelligence fit that account. But the distinction offers limited comfort if renewed supply pressure and stronger demand eventually begin to lift inflation expectations as well.
Chart 6: Decomposition of the US 10-year Treasury yield (DKW model)

Andrew Cates
AuthorMore in Author Profile »Andy Cates joined Haver Analytics as a Senior Economist in 2020. Andy has more than 25 years of experience forecasting the global economic outlook and in assessing the implications for policy settings and financial markets. He has held various senior positions in London in a number of Investment Banks including as Head of Developed Markets Economics at Nomura and as Chief Eurozone Economist at RBS. These followed a spell of 21 years as Senior International Economist at UBS, 5 of which were spent in Singapore. Prior to his time in financial services Andy was a UK economist at HM Treasury in London holding positions in the domestic forecasting and macroeconomic modelling units. He has a BA in Economics from the University of York and an MSc in Economics and Econometrics from the University of Southampton.
More Economy in Brief