

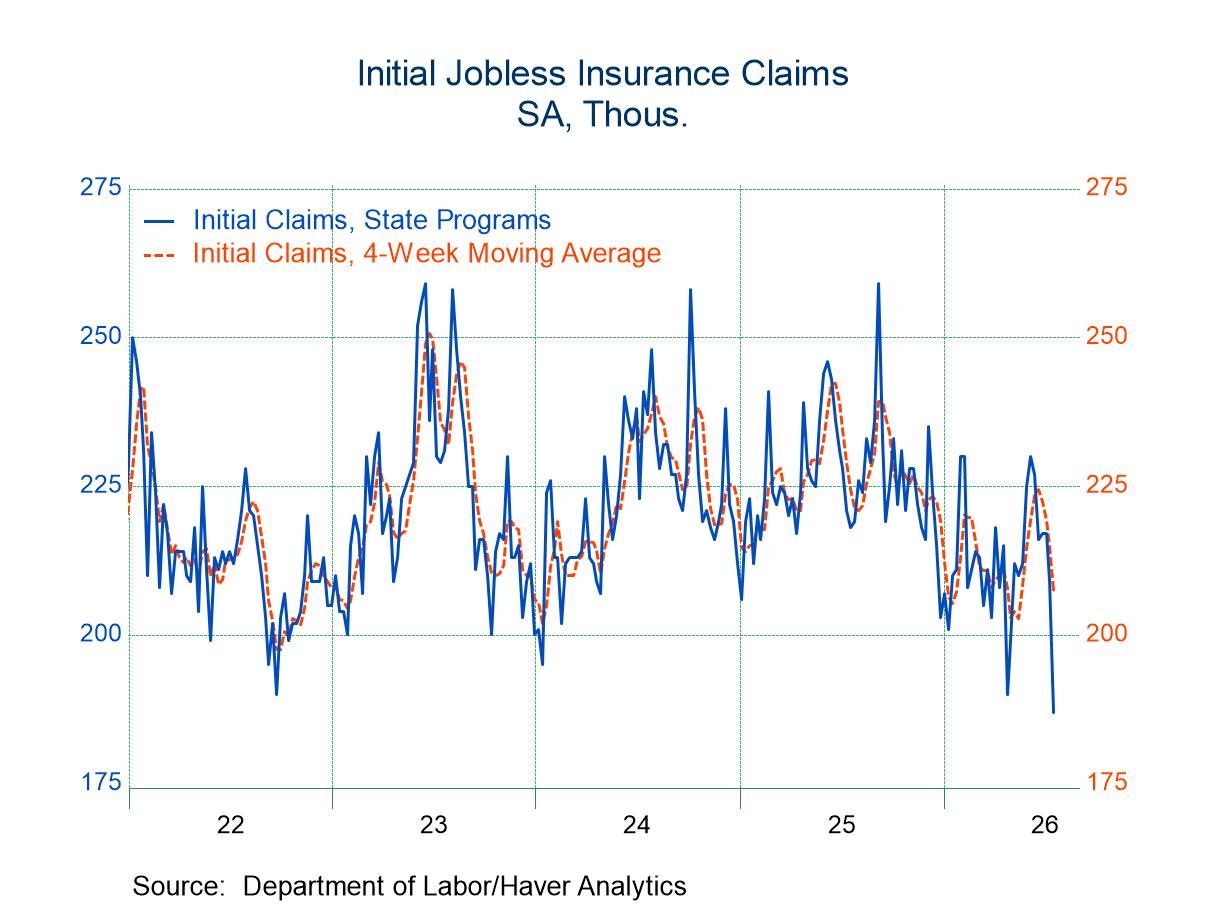
- New claims dropped by 22,000 to 187,000 in the week ending July 18, the lowest level since 1969.
- Continuing claims declined by 2,000 to 1.796 million in the week ending July 11.
- The insured unemployment rate was unchanged at 1.2% in the week of July 11.
United Kingdom| Jul 22 2026
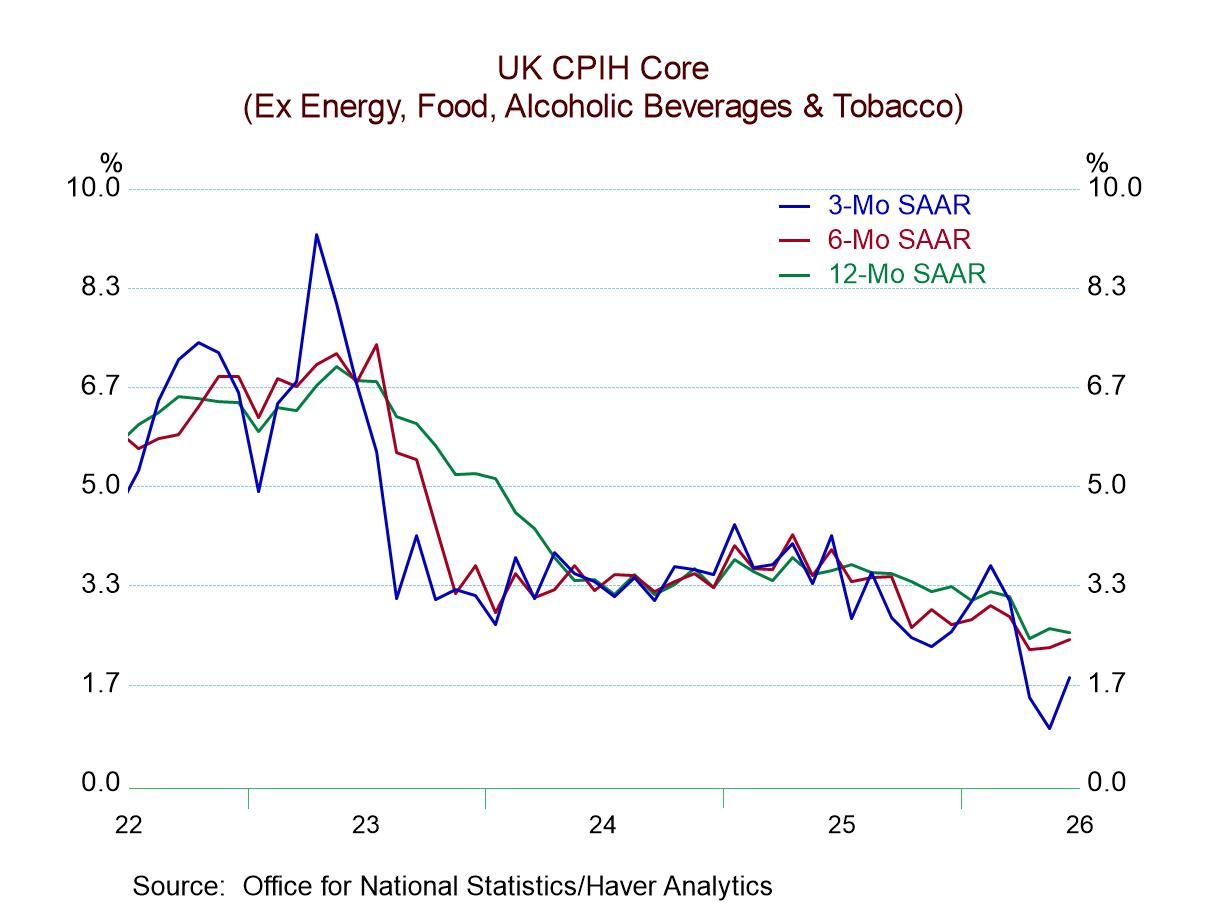
U.K. Headline and Core Inflation Rates Slow Sequentially as BOE Gets Ready to Meet
More Commentaries
 Germany| Jul 20 2026
German PPI Shows Pressure but Backs Off in June
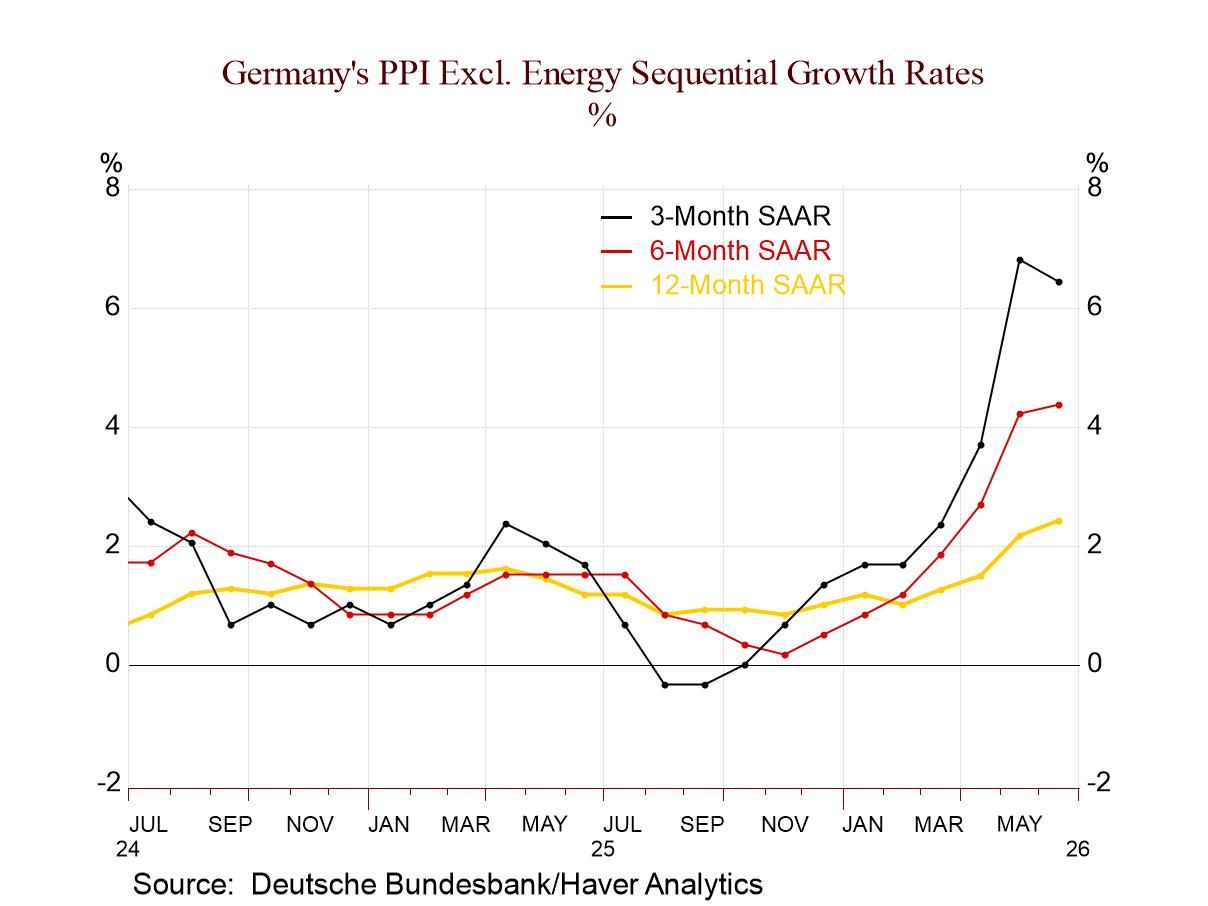
The German PPI excluding construction fell by 0.3% in June following three months of increases. Sequentially, the PPI is accelerating, with a 1.8% rise over 12 months, a gain at a 4.3% annual rate over six months, and a gain at a 4.8% annual rate over three months. They are joined by PPI excluding energy index, which also shows an accelerating pattern, rising 2.4% over 12 months, at a 4.4% annual rate over six months, and then at a 6.4% annual rate over three months.
The inflation picture for in June is fine if you restrict your view to the headline, where it dropped by 0.3%. However, the PPI excluding energy rose by 0.3% in June after rising by 0.7% in May and by 0.5% in April, definitely a string of unruly increases for producer prices in Germany.
Sector trends: The sector inflation metrics are not seasonally adjusted; as a result, a sequential trend may not be as reliable. On the other hand, when data aren't seasonally adjusted, it's often because the statistical authorities haven't detected stable patterns of seasonality and so they present the data as not seasonally adjusted. Let’s look at the sector trends, NSA. For consumer goods, prices fall by 1.7% over 12 months, followed by a 0.2% annualized fall over six months and at a 0.3% annual drop over three months. The pattern is not particularly reassuring as the pace of decline is waning sequentially, although consumer goods are producing declines and showing price weakness. Investment goods, on the other hand, show prices steadily expanding, by 2.1% over 12 months, by 3.2% annually over six months but then stepping back slightly toward a 2.4% annual gain over three months. Not surprisingly, the inflation fire is really cooking under intermediate goods, where raw materials have a bigger role. Intermediate goods prices are up by 5.1% over 12 months; unadjusted prices are up at a 10.9% annual rate over six months and then at a 13.8% annual rate over three months. This is clearly the source of the price pressure in the PPI.
Energy prices: Energy prices are only part of the problem, however, and we can see in the energy prices at the bottom of the table that they are producing some strange and unstable price trends. Brent oil prices measured in euros fell 17% month-to-month in June after rising by 0.8% in May and by 1.6% in April. Sequentially, Brent prices are up by 20.2% over 12 months and up at a 94.1% annual rate over six months, but then they fall to a 47.6% annual rate over three months. Against that background, prices in the second quarter compared to the first quarter show an increase at a 141.3% annual rate. These metrics explain why it's hard to pin down the oil-price impact on the PPI. The quarter-to-quarter changes are enormous, the three-month change is extremely weak, but that follows an extraordinary annualized gain over six months, and in June alone oil prices fell sharply by 17%. It is hard to keep track of the oil-price passthrough cycle. So, we're going to have to wait for these trends to sort themselves out to get a better fix on the impact of oil and energy prices. However, we know that the recent good news on oil has since been rescinded as the Strait of Hormuz, which was briefly open, is shut again and the U.S. and Iran have scrapped their fledgling ceasefire agreement.
Euro area—what matters: Policy in the euro area is made based upon inflation for the whole union, not just for Germany, but it pays closer attention to the CPI than the PPI. Germany is still the largest economy in the monetary union, and its CPI is up 2.3% over 12 months, up at a 2.5% annual rate over six months, and rising at a 0.3% annual rate over three months. The CPI excluding energy for Germany is considerably more stable, up by 2.3% over 12 months and then rising at a 2% annual rate over both six months and three months. German ex-energy CPI prices appear to be calm, with inflation arrested; however, we can't say the same thing for the PPI ex-energy, with the inflation rate in a clear accelerating mode.
 Asia| Jul 20 2026
Economic Letter from Asia: Two Speed Ahead
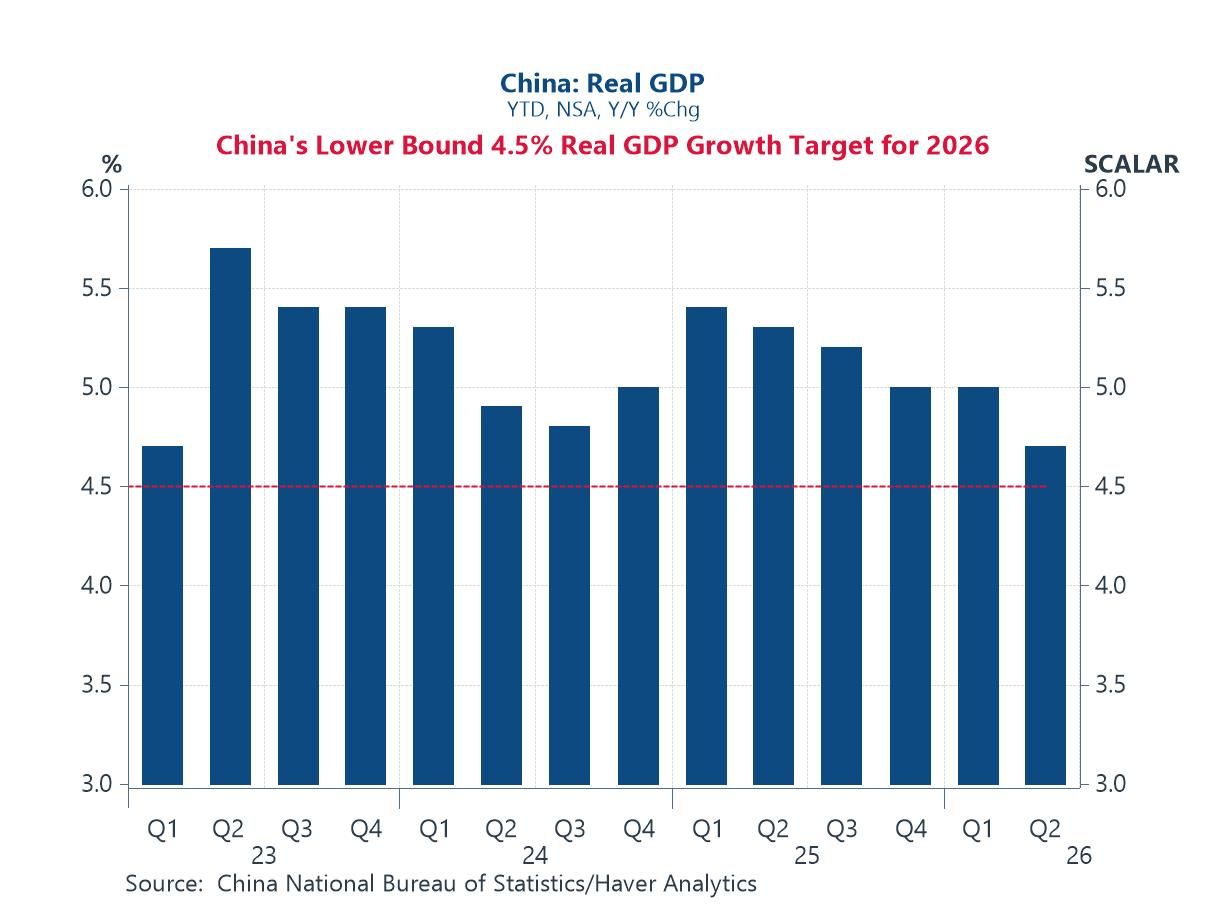
In this week's Letter, we examine China's increasingly two-speed economy, where robust AI-driven exports mask faltering domestic demand and a stalled rebalancing. Q2 GDP growth slowed to 4.3% y/y from 4.8%, dragging the year-to-date (ytd) rate towards the lower bound of its 4.5% to 5% target (chart 1). Beneath the headline, a two-speed split has widened, with external-oriented sectors holding up while more inward-focused prints such as retail sales and fixed asset investment weaken (chart 2).
Exports have kept climbing even as rebalancing stalls, with the export share of GDP rising to about 21% and consumption stuck near 40% (chart 3). With consumption hard to lift, tilting away from exports would sacrifice China's main growth driver, making rebalancing a difficult path. That export strength owes much to the AI boom, as integrated circuits added nearly 6.5 ppts to June's 27% y/y growth (chart 4). Part of the surge, though, likely reflects importer front-loading ahead of expected tariff hikes and the coming holiday seasons. Domestically, however, growth in retail sales had floundered, dragged down by autos, furniture and appliances, while trade-in subsidies likely delivered only one-off, front-loaded gains (chart 5). All while a fragile consumer climate, unsettled by the ongoing property crisis, continues to hold spending back. That crisis runs deep, with property price declines now into a fifth year and no clear bottom in sight (chart 6).
China’s Q2 GDP China's Q2 GDP results disappointed when posted last week, with growth slowing to 4.3% y/y from Q1's 4.8%. That drop dragged the y/y ytd growth rate towards the lower bound of the 4.5% to 5% target for the year (chart 1). The reading followed a run of soft monthly data, leaving investors increasingly concerned about domestic growth. Even so, China continues to benefit from more robust growth in its externally oriented sectors. This increasingly two-speed dynamic, alongside a persistent lack of economic rebalancing, remains a concern for investors. It has left them looking to Chinese authorities for signs of fresh stimulus to keep the economy on track for its full-year target. We return to these themes in later sections.
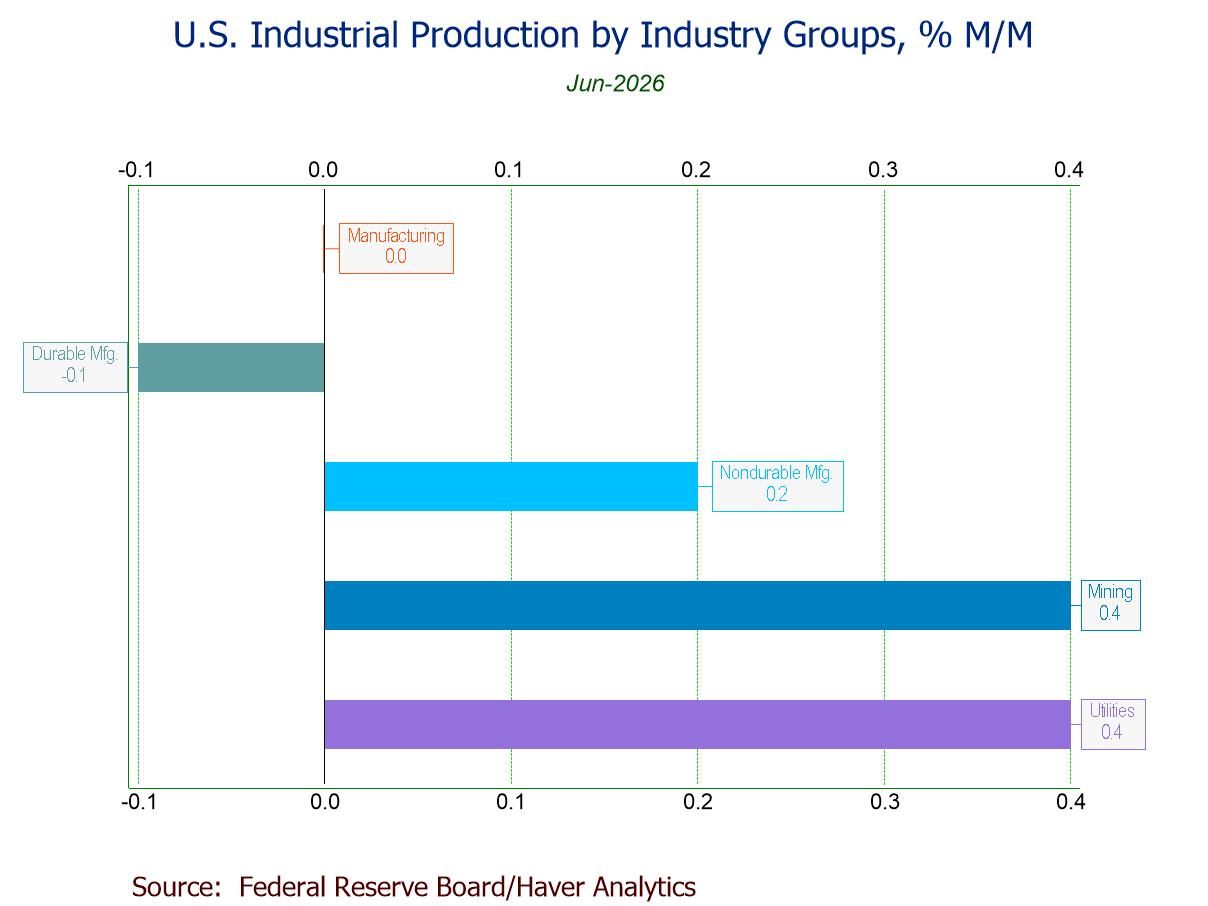
- June IP +0.1% (+1.1% y/y), fourth m/m increase in five months.
- Manufacturing unchanged (+1.1% y/y), w/ durables -0.1% and nondurables +0.2%.
- Selected high-tech +0.5%, eighth gain in nine mths.; motor vehicles +0.7%, sixth rise in seven mths.
- Mining +0.4% (+2.4% y/y), third consecutive m/m increase.
- Utilities +0.4% (+0.3% y/y), led by a 0.9% rebound in electric utilities output.
- Key categories in market groups post mixed results.
- Capacity utilization steady at 76.1%; mfg. capacity utilization marginally down to 75.7%.
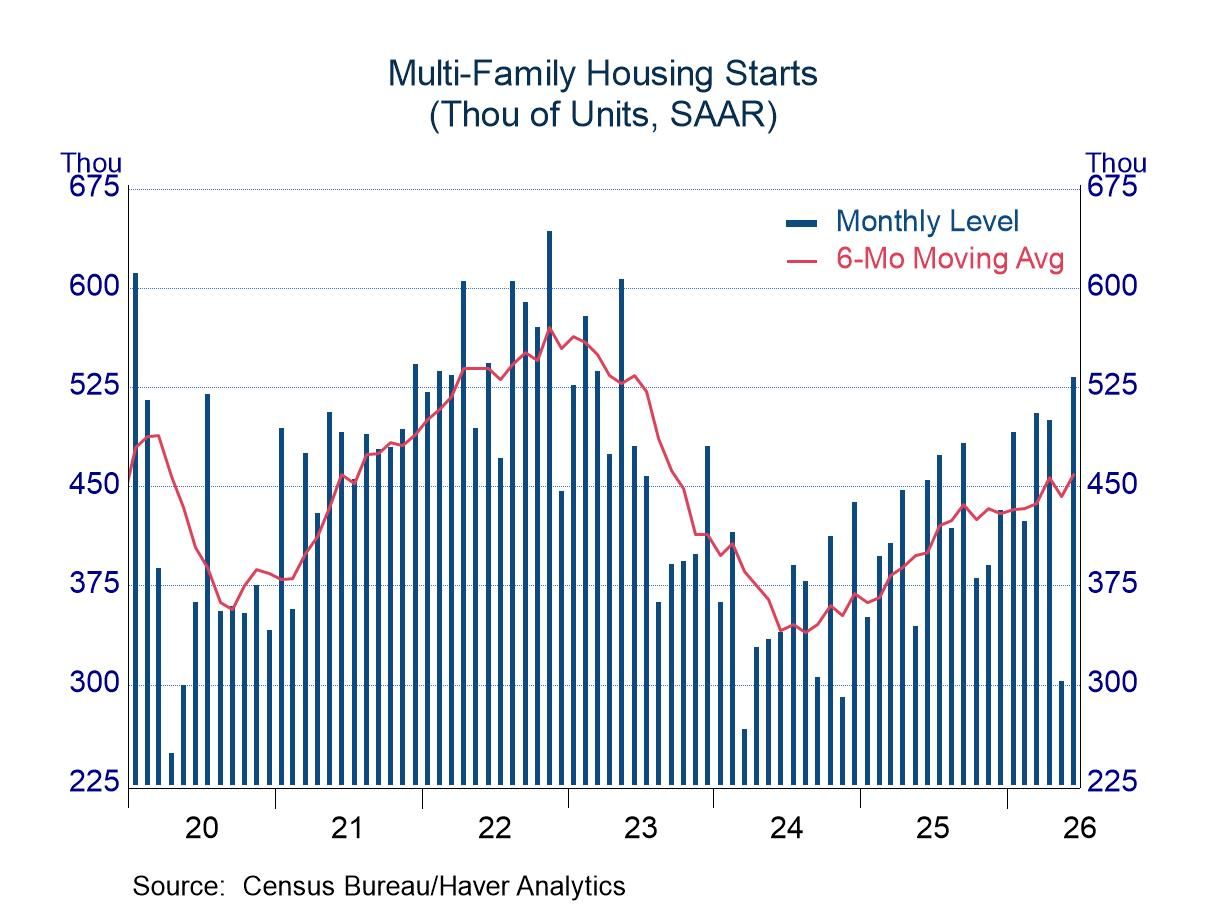
- Multi-Family starts rebounded from a soft reading in May.
- Single-family activity dipped from upwardly revised levels; softish trend overall.
 Europe| Jul 17 2026
HICP Detail in EMU Shows Inflation Lurking
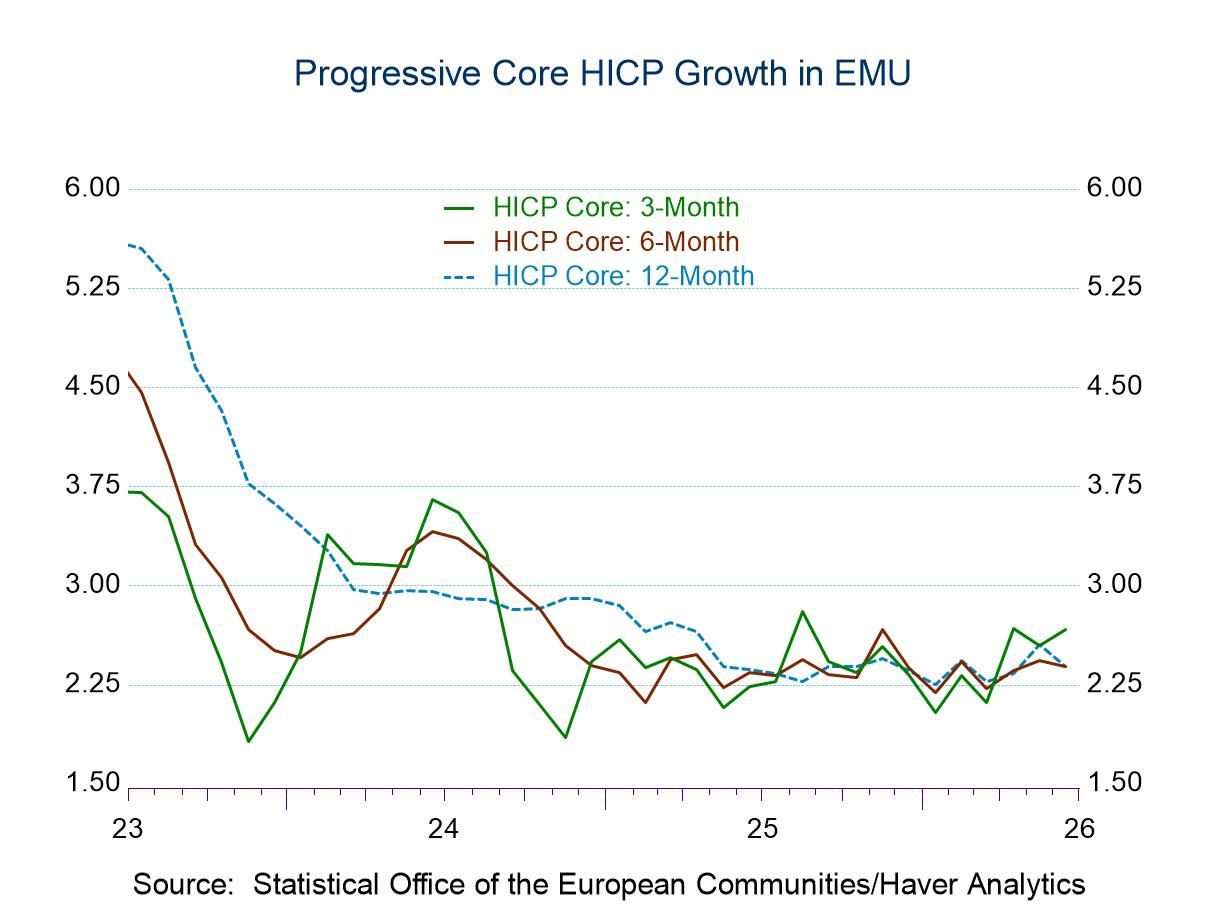
Inflation in EMU The recent inflation data in the European Monetary Union is emblematic of the kind of issues that central banks typically have to deal with. Casual central bank observers think of central banks as “leaning against the wind,” meaning that they raise rates when inflation is high and then cut rates when the economy gets weak. Indeed, this is largely what central banks do. However, they also try to be anticipatory when they can, seeking to get ahead of surges in inflation and periods when the economy is going to weaken. It's very hard to forecast those shifts in the best of circumstances, and so a great deal of the judgment that central banks form comes from the near-term trends, even though central banks are aware that the most recent data can also be some of the most volatile and prone to revision. With these sorts of caveats, we look at the recent inflation data from the European Monetary Union, and we see less than straightforward trends.
At its last meeting, the European Central Bank got out in front of events and started raising rates ahead of any action by the Federal Reserve. In June, its year-over-year HICP and core HICP rates both decelerated compared to their May values, with the headline easing to 2.8% from 3.2% and the core to 2.4% from 2.6%. Having inflation rates move in the opposite direction of policy, even in the short run, can create rough sledding for a central bank that is, in any event, trying to look at the broader trend rather than the most recent wiggle in the inflation rate.
The good, the bad, and the unexpected If we go back to December, we see the HICP in the monetary union at 2%, followed by 1.7% in January and 1.9% in February. At that point, things seemed to be well in hand. The problem was that the core inflation rate in December was 2.3%; while it fell to 2.2% in January, it popped back up to 2.4% in February. So, February was one of those uncomfortable months where both the headline and core rates were popping up, but the headline rate was still below the 2% target that the ECB seeks to attain. After February, of course, the world changed; the war in Iran spiked up oil prices and that's when inflation rate in the monetary union rose to 2.6% in March, 3% in April, and 3.2% in May. June inflation has backed down from those higher rates of change; however, conditions in the Middle East that had prompted some release of air from the inflation balloon in June have reversed, and so, the outlook once again is for oil prices to remain high and for inflation to remain troublesome.
Inflation still percolates At the bottom of the table, I show the percentage of categories with inflation accelerating over three months, and since February, that percentage is over 50% in each month. The percentage of categories with inflation accelerating over six months strings out to three months in a row. The decision by the ECB to raise rates is entirely understandable given these trends. In addition, and perhaps less tethered to any particular monetary rule, included in the right-hand column, the inflation ranking in June is compared to data back to the year 2001, a roughly 25-year period. Over this timeline, the headline HICP ranks in the 83rd percentile and the core rate in the 82nd percentile. In both cases, we're looking at inflation being higher only 17% or 18% of the time during this span, which once again marks this as a strong inflation period.
 USA| Jul 16 2026
U.S. Retail Sales in June Slowed by Drop in Gasoline Sales
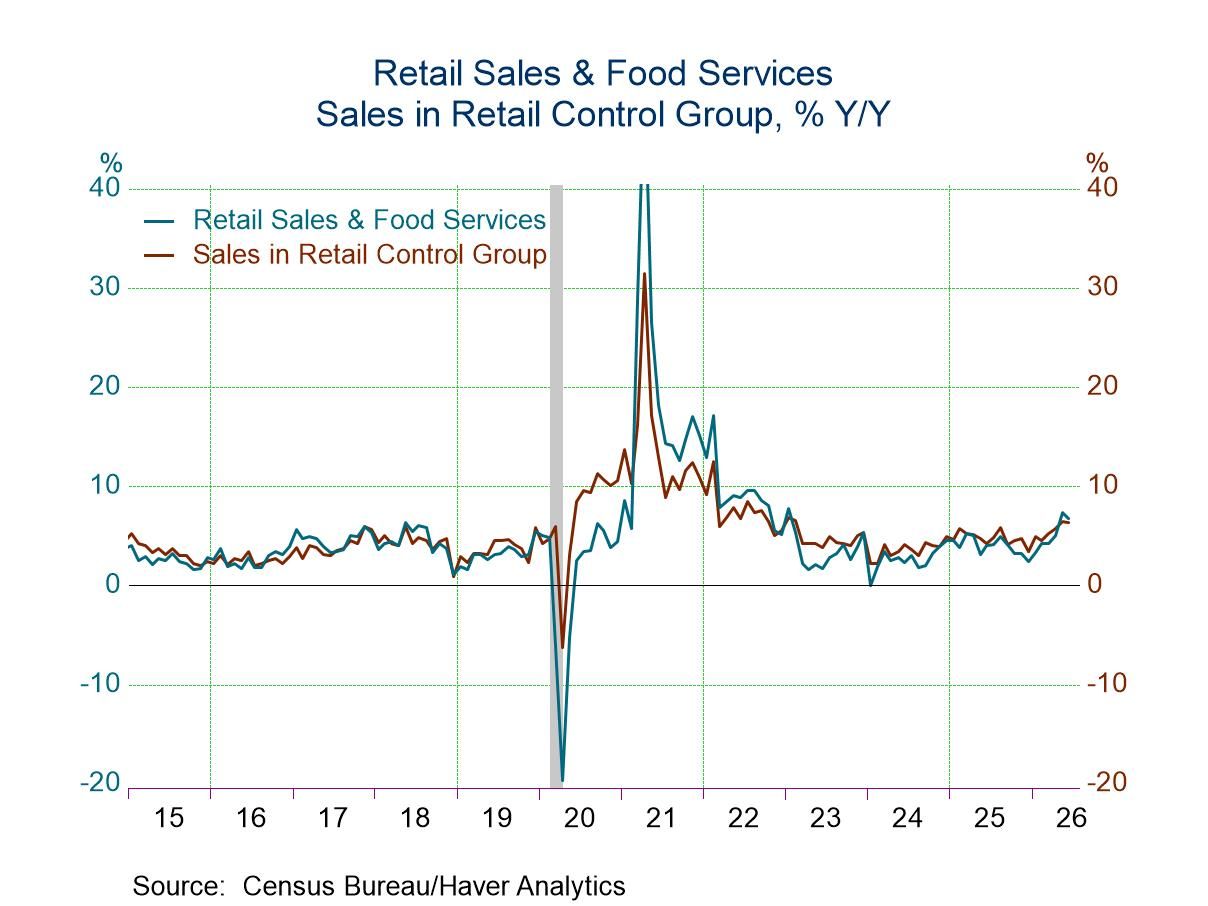
- Total sales increased 0.2% m/m in June, slightly below expectations, with an upward revision to May.
- Gasoline sales plunged 5.3% m/m, reflecting lower prices.
- Excluding gasoline sales, remaining sales rose a solid 0.7% m/m in June after a 0.9% monthly gain in May.
- Sales of the retail control group that is used to construct PCE rose 0.5% m/m in June and were up 9.2% at an annual rate in Q2 from Q1.
by:Sandy Batten
|in:Economy in Brief
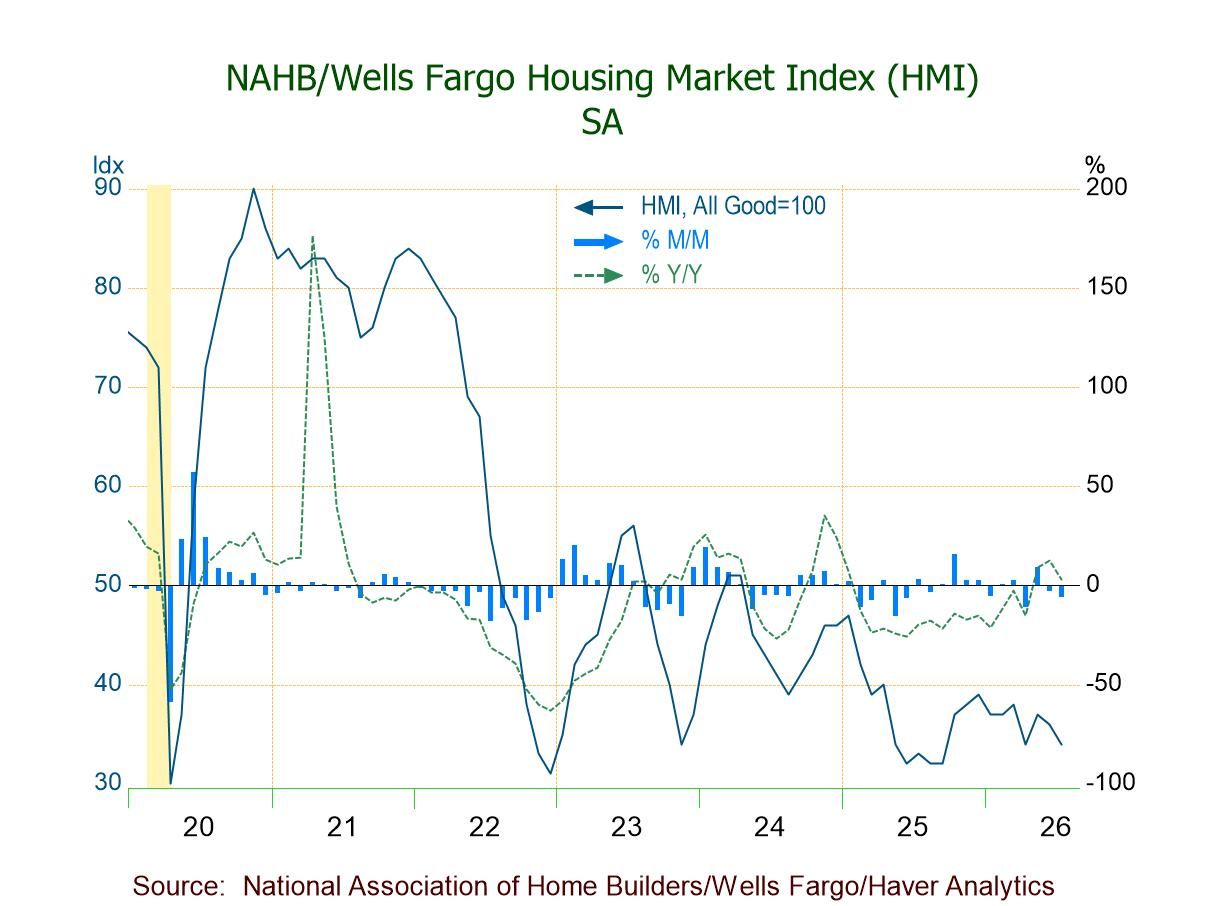
- HMI weakens m/m in July, indicating most builders remain pessimistic about the current and near-term housing outlook.
- All three HMI components down, w/ the steepest m/m drop in prospective buyer traffic (-8.0%).
- Mixed regional performance m/m: down in the Northeast (-18.0%) and West (-7.4%); up in the Midwest (+2.2%); flat in the South.
 USA| Jul 16 2026
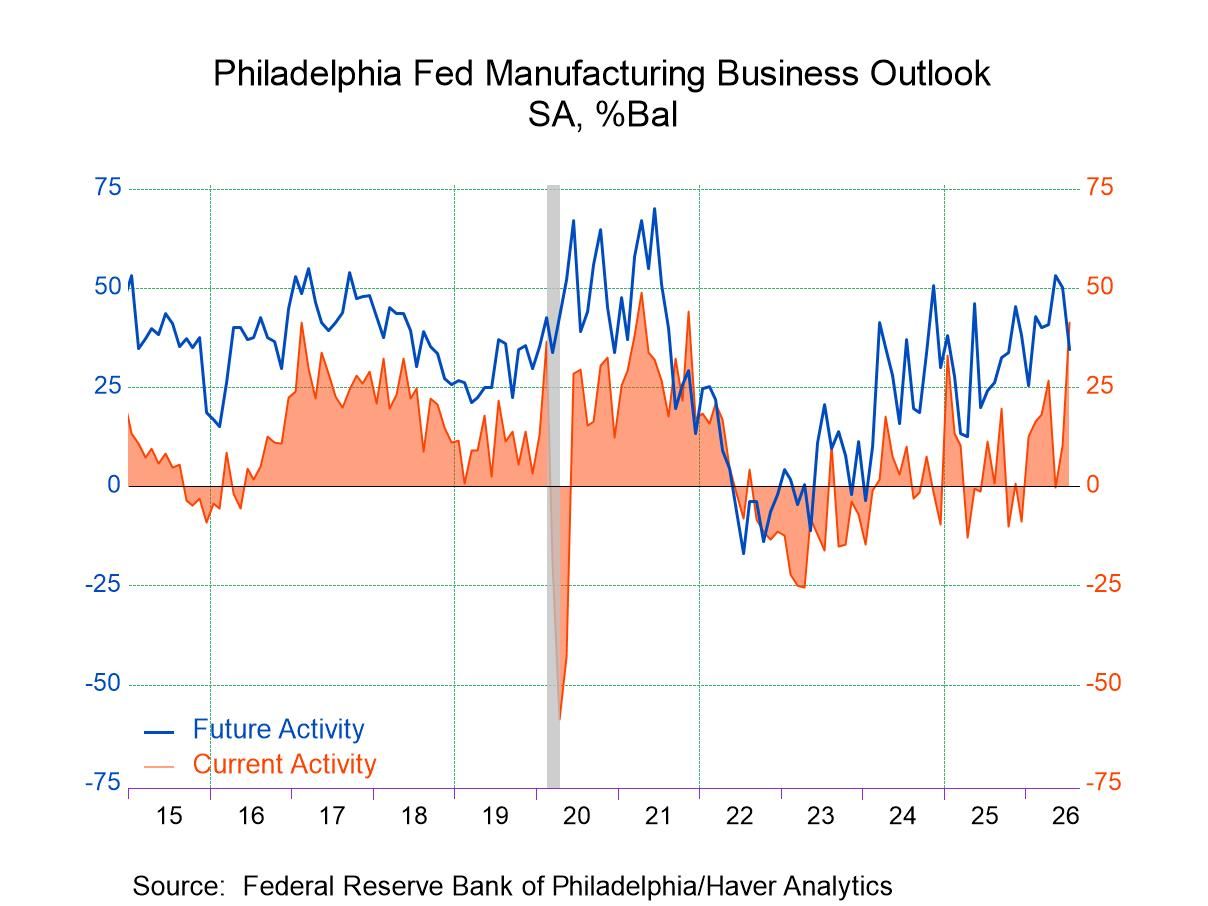
U.S. Philly Fed Manufacturing Index Jumps in July
- The headline index jumped to 41.4 in July, much larger than expected and the highest reading since November 2021.
- The outsized increase was widespread across components with the ISM-adjusted index rising to 58.1, its highest reading since January 2025.
- Prices remained elevated but were little changed in July from June.
- Delivery times lengthened meaningfully, indicating some incipient supply chain problems.
- The survey’s broad indicators for future activity continued to suggest expectations for growth over the next six months, although most readings fell meaningfully.
by:Sandy Batten
|in:Economy in Brief
- of2731Go to 1 page