U.K. Headline and Core Inflation Rates Slow Sequentially as BOE Gets Ready to Meet
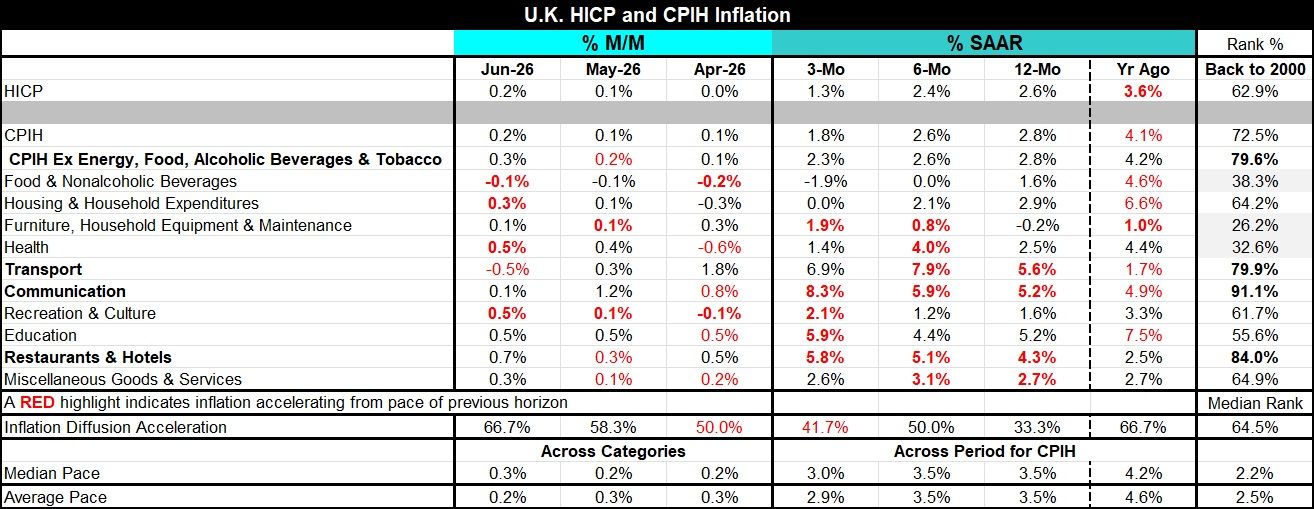
Inflation progress in the U.K. continues to make its way despite a month-to-month increase in the pace for the HICP measure, as well as for the CPIH headline and its core. The two headline measures for the CPIH and the HICP accelerated in June to 0.2% after each posted a small 0.1% increase in May. The CPIH core, which excludes energy, food, alcohol, and tobacco, advanced by 0.3% in June after rising by 0.2% in May.
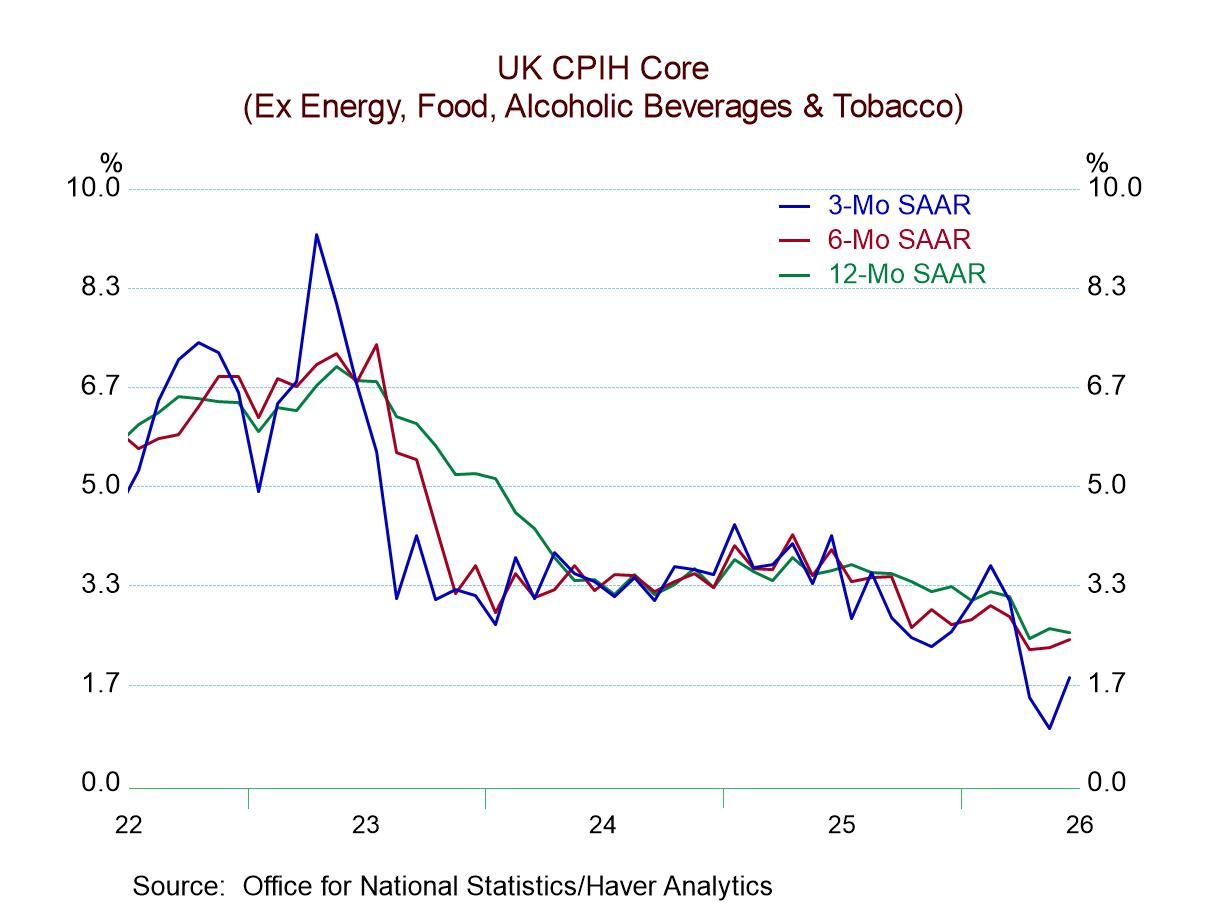
Monthly data are ‘noisy’: These are minor and technical month-to-month changes since we're measuring inflation in tenths; this is an increase in the smallest unit that we present. If we look at the inflation progress over broader periods of three months, six months, and 12 months, we find there are ongoing decelerations of inflation in the HICP, the CPIH, and the CPIH core measures. I will continue this discussion solely in terms of the CPIH measures.
Sequential inflation: Headline inflation for the CPIH clocks 2.8% over 12 months; the annualized rate falls to 2.6% over six months and falls further to 1.8% annualized over three months, a clear pattern of progress. Core inflation on the CPIH gauge is also 2.8% over 12 months; it also falls to 2.6% over six months, but its deceleration over three months is to a pace of 2.3% (instead of 1.8% for the headline). Still, that's ongoing progress and the three-month 2.3% pace of core inflation is getting quite close to the Bank of England’s 2% objective.
Component behavior: We're going to further evaluate inflation by looking at how the components behave over different periods. In June, inflation accelerated in 66.7% of the categories. In May, it accelerated in 58.3% of the categories, whereas in April, it accelerated in only 50% of the categories. Inflation acceleration is going in the wrong direction to appease monetary authorities. However, these are calculations made across categories without taking any weighting into account. The headline performance takes weighting into account; the weighted core and the headlines are moving in the right direction.
Sequentially, on this broader basis, trends look better. Over 12 months compared to 12 months earlier, inflation is accelerating in only 33.3% of the categories, but then over six months compared to 12 months, the inflation rate is increasing in half of the categories. Over three months, that diffusion measure falls to 41.7%; i.e., only 41.7% of the categories are experiencing accelerating inflation over three months compared to six months. So, these are much better trends when viewed over a broader period. To bring a little bit more life into these abstract diffusion figures, I've also presented the median and average pace of inflation over three months, six months, and 12 months at the bottom of the table. There you can see that the median pace of inflation on this sequence is 3.5% over 12 months and six months, and then it falls to 3% over three months. The average pace of inflation over 12 months is 3.5%; it stays at 3.5% over six months and then decelerates to 2.9% over three months.
Ranking 12-month inflation rates: The final column ranks the current inflation rates across categories and for the headlines on data back to 2000. The HICP measure has a 62.9 percentile standing, the CPIH measure has a 72.5 percentile standing, while this CPIH core has a 79.6 percentile standing. These standings tell us that the inflation rates for these categories are high relative to where they have been since 2000. At the bottom of the table, we can see that the median inflation rate since 2000 has been 2.2%, while the average pace of inflation has been 2.5%. So, over the full, back-to-2000 span, inflation has been slightly north of the BOE target, depending on which measure we look at, the median or the average. The median pace has been quite close, while the average has been half a percentage point too high. A current ranking that puts the inflation rates above their respective medians (and a ranking of 50 represents the median) evaluated the individual category as above its own median at a time when the median and averages overall were already too hot. For all but three of these categories, inflation is still high by a historic experience (above a ranking of 50%). That probably continues to require a somewhat restrictive interest rate from the central bank. Across categories, the highest-ranking inflation is a 91.1 percentile standing for communication, followed by an 84-percentile standing for restaurants & hotels and standings in the 79th percentile for transportation as well as for the core CPI taken as a whole. Inflation rates below their medians for the period back to 2000 are for food & nonalcoholic beverages, furniture, household equipment & maintenance, and healthcare.
Summing up: Inflation clearly is trending in the right direction; it's getting close to where the Bank of England would like to see it. Interest rates are still restrictive; therefore, the BOE may decide to roll the dice at its next meeting and keep interest rates where they are. It's possible that under these conditions the Monetary Policy Committee (MPC) could vote to cut rates because inflation is falling to a within target or close to target pace over three months, although it's clearly still excessive over six months and 12 months. The rankings that we present in the far-right column pertain to year-over-year inflation rates only. In any event, there is authentic signaling about a weakening in the inflation process, and evidence of inflation progress comes as the economy has been weak and that's coincidentally with the introduction of a new Prime Minister who has just been installed. Marking time by the central bank would be a reasonable strategy. Cutting rates would be a bit bolder; it's not out of the question since, at 3.75%, the policy rate is above current measures of inflation and already restrictive, and would continue to be restrictive after a small rate cut.

Robert Brusca
AuthorMore in Author Profile »Robert A. Brusca is Chief Economist of Fact and Opinion Economics, a consulting firm he founded in Manhattan. He has been an economist on Wall Street for over 25 years. He has visited central banking and large institutional clients in over 30 countries in his career as an economist. Mr. Brusca was a Divisional Research Chief at the Federal Reserve Bank of NY (Chief of the International Financial markets Division), a Fed Watcher at Irving Trust and Chief Economist at Nikko Securities International. He is widely quoted and appears in various media. Mr. Brusca holds an MA and Ph.D. in economics from Michigan State University and a BA in Economics from the University of Michigan. His research pursues his strong interests in non aligned policy economics as well as international economics. FAO Economics’ research targets investors to assist them in making better investment decisions in stocks, bonds and in a variety of international assets. The company does not manage money and has no conflicts in giving economic advice.
More Economy in Brief
 Asia
Asia