Global| Sep 03 2026
Charts of the Week: The Turn Towards Tightening
by:Andrew Cates
|in:Economy in Brief
Summary
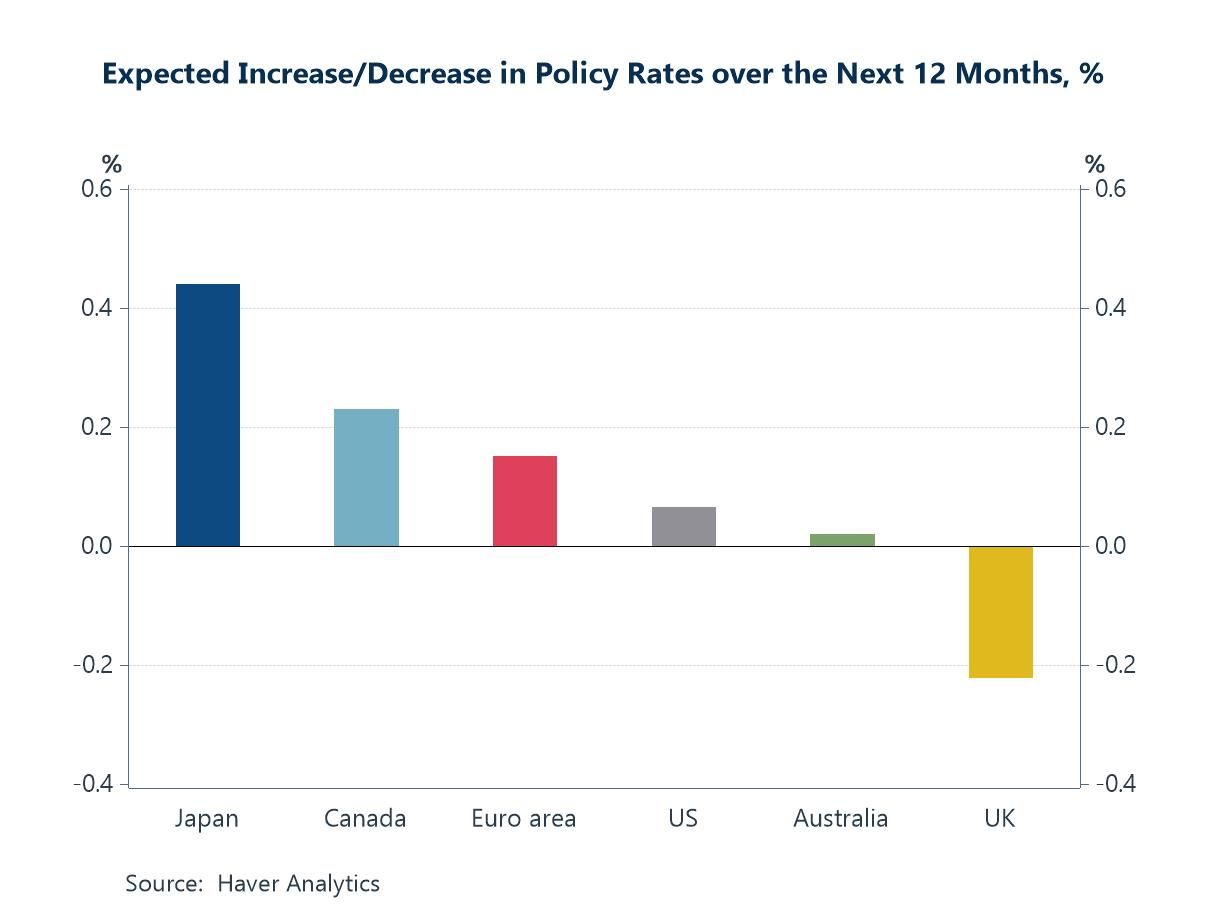
Central banks dominated the financial-market narrative last week. In his first Jackson Hole address as Federal Reserve chairman, Kevin Warsh indicated that the next move in US interest rates was more likely to be an increase than a cut. The ECB, having raised rates in June, is also expected to tighten further. Government bond yields consequently remained under upward pressure across the advanced economies, with long-term yields close to their highest levels in two decades. Rising real yields weighed on equities and gold, while oil climbed back above $90 following US strikes on Iranian launchers near the Strait of Hormuz. The latest Blue Chip Financial Forecasts survey places this shift in a broader context. Panellists expect policy rates to rise over the next twelve months in Japan, Canada and the euro area, with more modest increases anticipated in the United States and Australia; the United Kingdom is the only economy in which rates are expected to fall (chart 1). At the same time, shipping costs and global supply-chain pressures are rising again (chart 2), with renewed inflationary pressure emerging at the factory gate (chart 3). US labour demand is also shifting towards sectors where supply constraints appear most pronounced (chart 4). Yet core inflation across the G10 is now relatively close to target (chart 5). The final chart places these developments within a longer-term shift: after declining for four decades, the real cost of capital has moved decisively higher (chart 6).
The survey points towards higher rates The latest Blue Chip Financial Forecasts survey suggests that the shift towards tighter policy extends beyond the immediate market reaction. Over the next twelve months, panellists anticipate the largest rate increase in Japan, at slightly more than 40 basis points, followed by Canada at just over 20 basis points and the euro area at around 15. Much smaller increases are expected in the US and Australia, while the UK is the only economy in which rates are forecast to fall.
Chart 1: Blue Chip expectations for policy-rate changes over the next 12 months
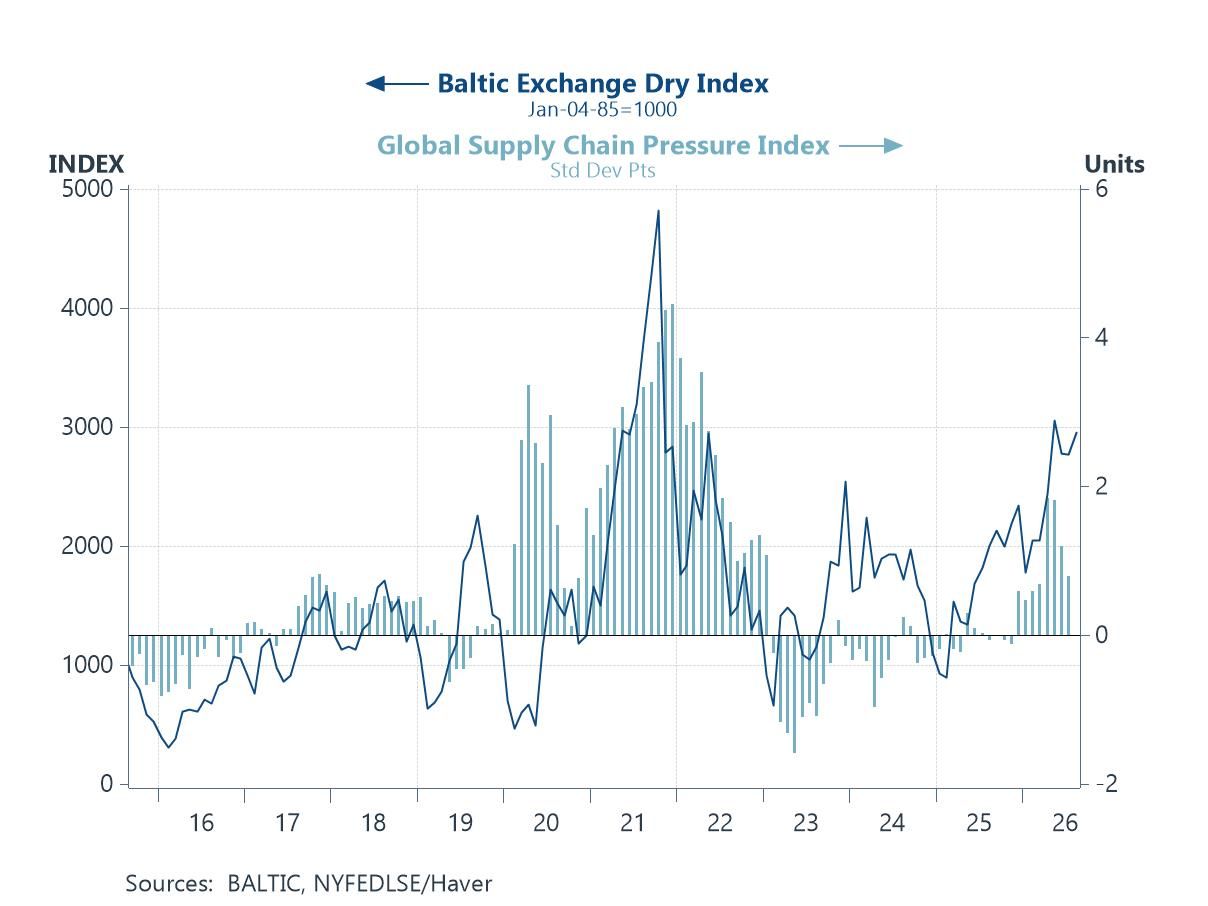
Shipping stress returns The next chart helps explain why the expected policy path has lately become less benign. The Baltic Exchange Dry Index, a market measure of the cost of moving bulk commodities, has climbed sharply in recent months. At the same time, the Federal Reserve Bank of New York's Global Supply Chain Pressure Index has moved decisively above zero after spending much of the previous two years at or below its historical norm. Neither measure maps mechanically into producer prices, but together they signal renewed pressure on freight, capacity and traded inputs. Such pressure tends to reach PPI inflation with a lag, suggesting that part of the disinflation delivered by normalising supply chains is now being unwound.
Chart 2: Shipping costs and global supply-chain pressure turn higher
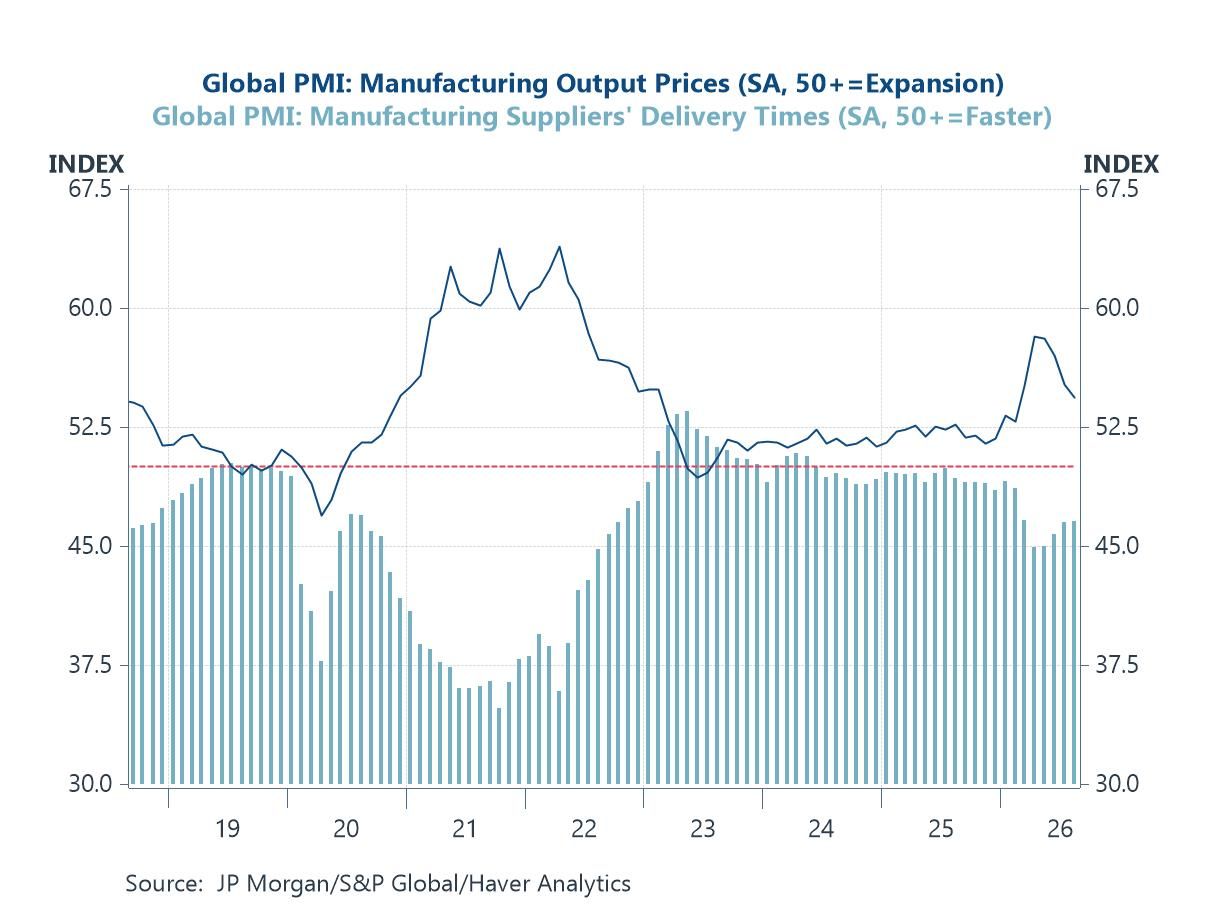
More is still in the pipeline The latest manufacturing PMI surveys for August tell a similar story. Global manufacturing output prices rose sharply in late 2025 and, although they have eased from their recent peak, remain comfortably above the neutral level of 50. Suppliers' delivery times, meanwhile, have dropped below 50, indicating that deliveries are slowing again. The combination of longer delivery times and elevated output prices is a familiar warning that supply friction is feeding into factory-gate inflation. With oil back above $90/bbl and a new round of tariffs raising the cost of traded goods, the pressures entering the pipeline are, for the moment, being renewed about as quickly as they drain.
Chart 3: Slower supplier deliveries and firmer manufacturing output prices
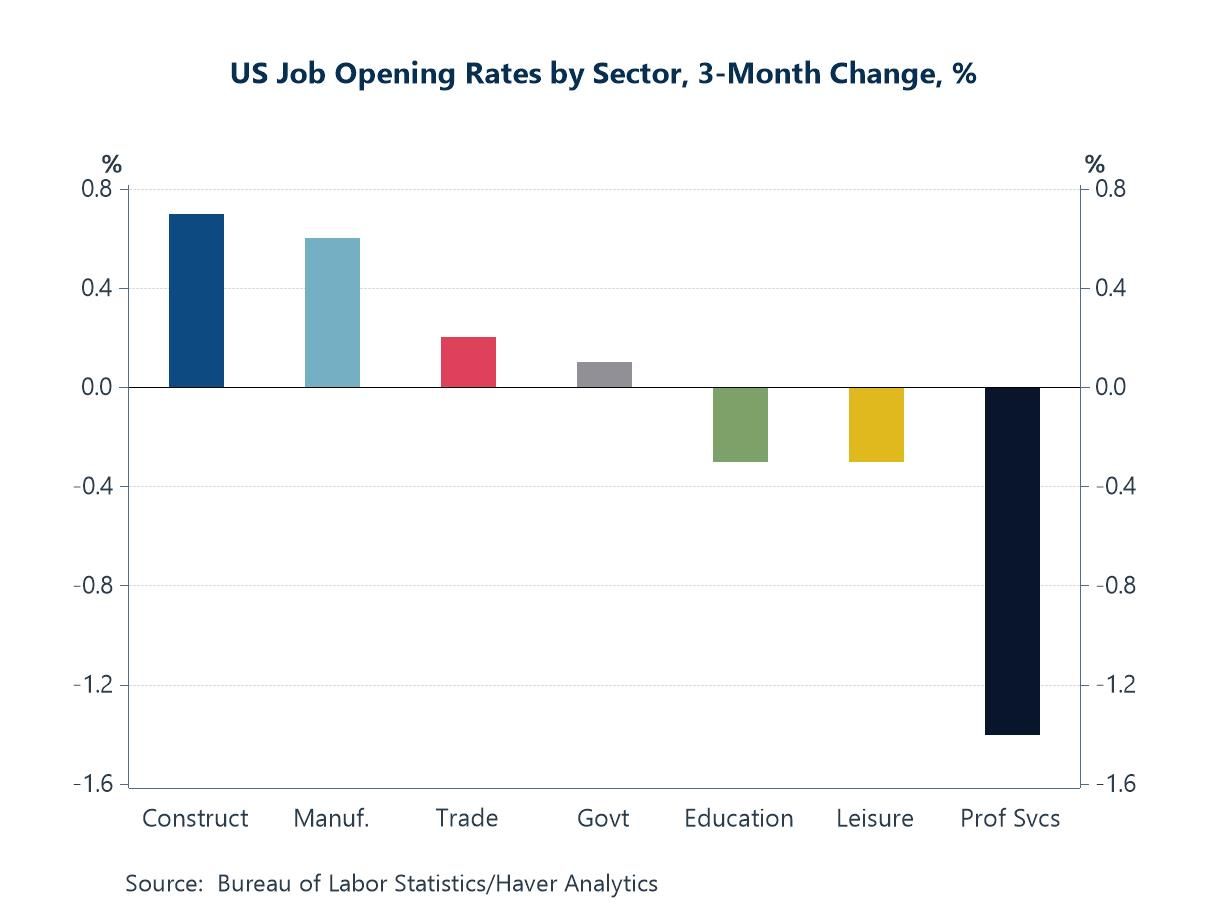
A newer squeeze, where workers are needed The aggregate US labour-market picture conceals a sharp sectoral rotation. Over the past three months, job-opening rates have risen most clearly in manufacturing and construction, with smaller increases in trade and government, while they have fallen in education, leisure and, most dramatically, professional services. That divergence is awkward for policy. Demand is softening in parts of the white-collar and service economy even as industries that depend heavily on foreign-born labour continue to search for workers. Tighter immigration enforcement can therefore lift wage and operating costs in bottleneck sectors while aggregate hiring and growth weaken at the same time.
Chart 4: US job-opening rates rotate sharply across sectors
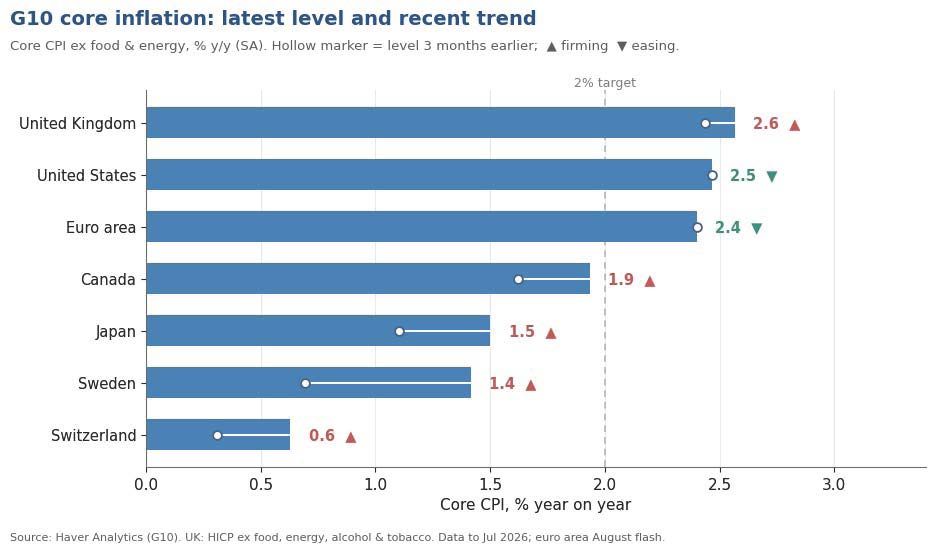
The demand side has already yielded In contrast to these supply-side pressures, demand-driven inflation has been more contained. Core inflation in many G10 economies is now clustered relatively close to target, ranging from just over 0.5% in Switzerland to 2.6% in the United Kingdom. Rates in the United States and euro area remain above target but have lately been easing, while those in Canada, Japan, Sweden and Switzerland are below 2%, despite some recent firming. Wage growth has also moderated as labour markets have cooled.
Chart 5: G10 core inflation - close to target, but uneven
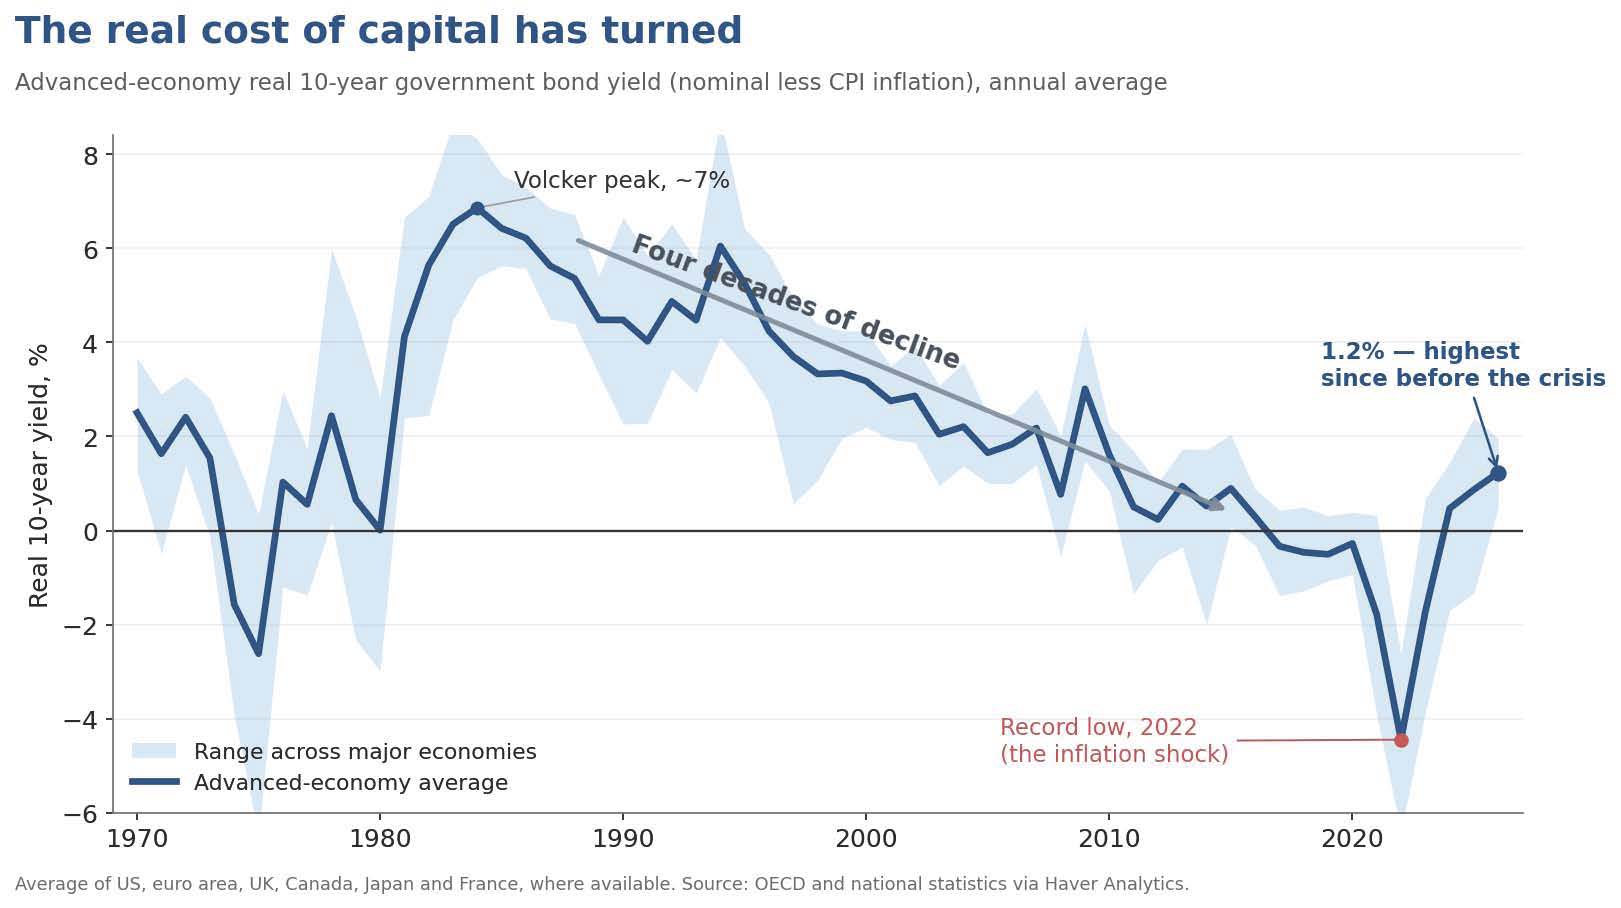
And the cost of capital has turned A final theme this week lengthens the horizon. The real yield on advanced-economy government debt - the cost of capital once inflation is stripped out - fell for four decades, from the peaks of the Volcker era to the lows of the 2010s and the negative rates of the 2022 inflation, and has since turned back up to its highest since before the financial crisis. Part of the rise is cyclical; part reflects a more lasting increase in the demand for capital, as artificial intelligence, the energy transition, rearmament and widening deficits draw on a pool of saving that is no longer expanding to meet them. Whether rates settle back towards their former lows, as much of the financial system still assumes, is on this account increasingly open to question.
Chart 6: The real cost of capital, half a century

Andrew Cates
AuthorMore in Author Profile »Andy Cates joined Haver Analytics as a Senior Economist in 2020. Andy has more than 25 years of experience forecasting the global economic outlook and in assessing the implications for policy settings and financial markets. He has held various senior positions in London in a number of Investment Banks including as Head of Developed Markets Economics at Nomura and as Chief Eurozone Economist at RBS. These followed a spell of 21 years as Senior International Economist at UBS, 5 of which were spent in Singapore. Prior to his time in financial services Andy was a UK economist at HM Treasury in London holding positions in the domestic forecasting and macroeconomic modelling units. He has a BA in Economics from the University of York and an MSc in Economics and Econometrics from the University of Southampton.
More Economy in Brief