

U.S. Trade Deficit Widens in July to Highest Level Since March ’25
Summary
- Deficit: $88.6 bil. in July, up from $71.2 bil. in June, reflecting $119.6 bil. goods deficit & $31.0 bil. services surplus.
- Exports -2.1%, third straight m/m decline, driven by a plunge in nonmonetary gold exports.
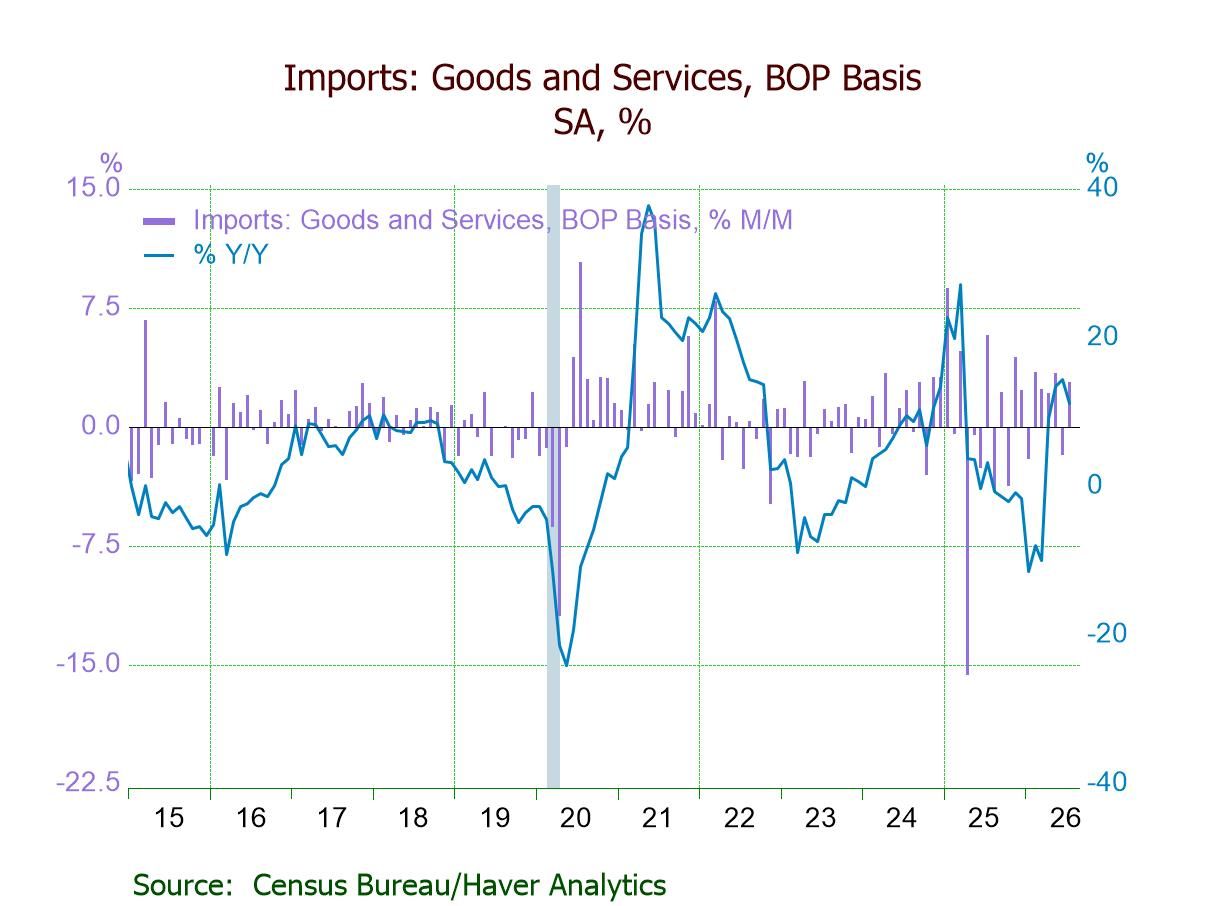
- Imports +2.8%, fifth m/m increase in six months, boosted by a rise in capital goods imports.
- Real goods trade deficit widens to $106.4 bil., largest since Mar. ’25.
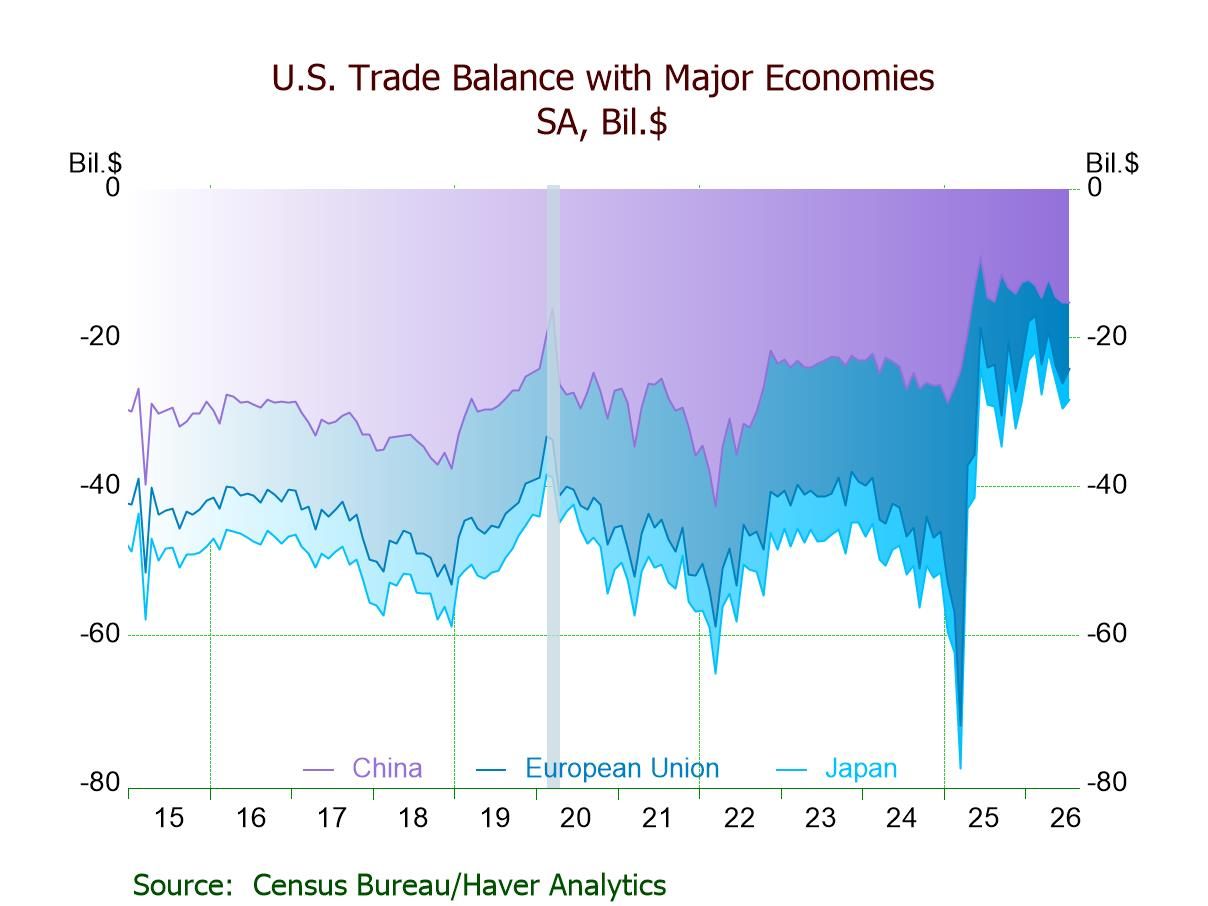
- Goods trade deficits w/ China down to a still-high $15.2 bil., w/ EU down to a 3-month low, and w/ Japan up to a 5-month high.
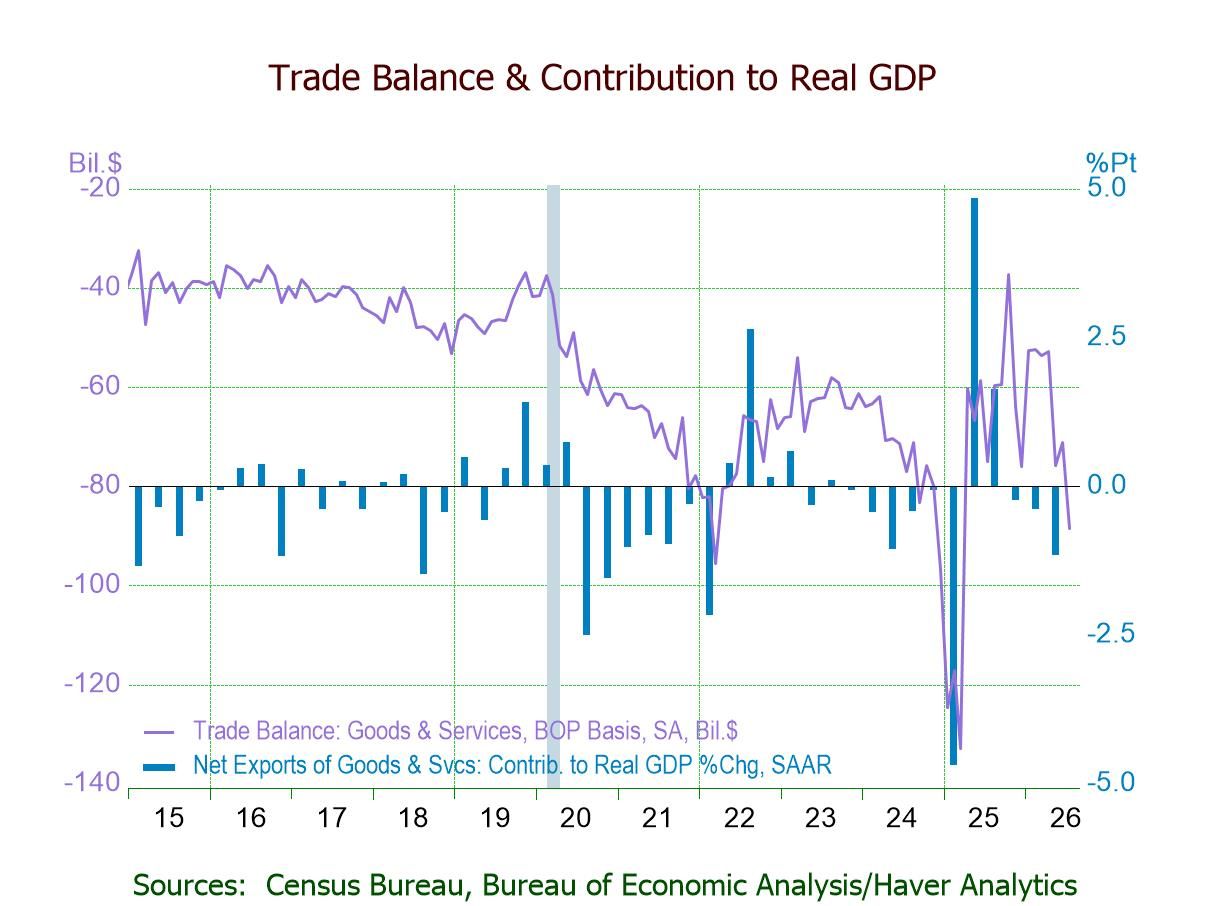
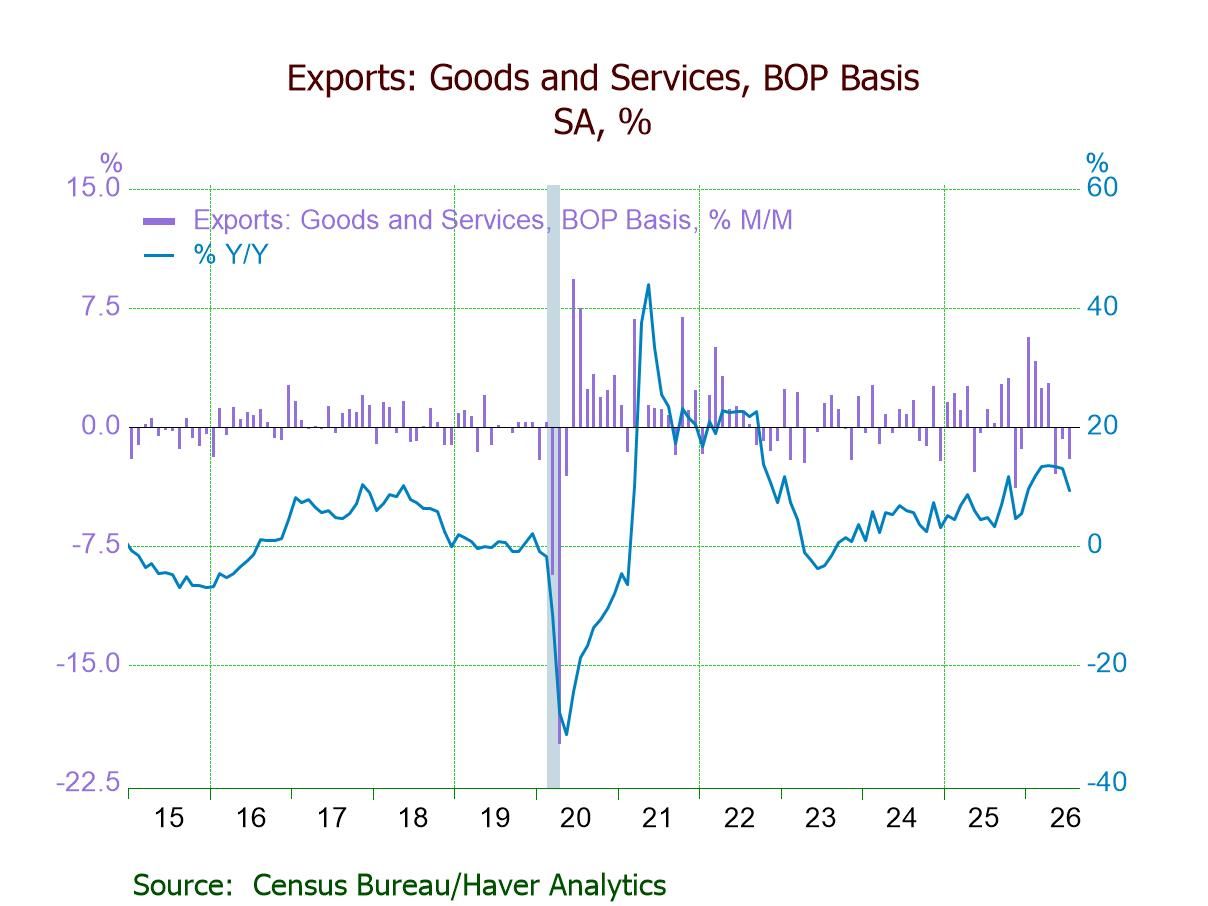
The U.S. trade deficit in goods and services (BOP basis) widened to $88.58 billion in July from $71.18 billion in June ($73.26 billion originally) and $75.75 billion in May ($77.65 billion previously), according to the U.S. Census Bureau. This was the second time in three months the gap had widened. The July deficit was the biggest since March 2025 and larger than the $75.06 billion in July 2025. A deficit of $89.5 billion had been expected in the Action Economics Forecast Survey. Exports fell 2.1% m/m (+9.3% y/y) in July, the third consecutive monthly fall, after a 0.8% decline in June (-0.9% initially). Imports rose 2.8% (11.2% y/y), the fifth m/m increase in six months, following a 1.8% June decrease (unrevised).
The real (inflation-adjusted) goods trade deficit (customs value; chained 2017 dollars) expanded to $106.39 billion in July, the largest since March 2025, after narrowing to $94.36 billion in June; it was larger than the $99.22 billion in July 2025. The $92.87 billion average monthly real trade deficit in Q2'26 was the biggest since Q1'25’s record $140.54 billion shortfall. The trade balance (net exports) subtracted 1.14%-points from Q2'26 real GDP growth after subtracting 0.37%-points in Q1'26 and 0.22%-points in Q4'25.
The deficit in goods trade (BOP basis) ballooned to $119.59 billion in July, the highest level since March 2025, from $101.97 billion in June; it was larger than the $102.65 billion in July 2025. Goods exports fell 3.0% (+12.1% y/y) in July, the third successive m/m decline, after a 1.8% drop in June. Goods imports recovered 3.7% (13.7% y/y), the fifth m/m rise in six months, following a 2.6% June decrease.
The customs value goods trade deficit widened to $118.94 billion in July, the widest since March 2025, after narrowing to $101.05 billion in June; it was much larger than the $101.28 billion in July 2025. The latest figure was in line with a $118.81 billion deficit in the advance report released on August 27. Customs value exports fell 2.9% (+11.9% y/y) in July, down for the third straight month, after a 1.7% drop in June. This reflected m/m decreases in several end-use categories, including declines of 10.8% (+18.9% y/y) in industrial supplies & materials, 6.8% (+4.7% y/y) in other goods, 1.0% (+10.1% y/y) in foods, feeds & beverages, and 0.7% (+1.0% y/y) in automotive vehicles, parts & engines, while exports of nonfood consumer goods excluding autos (+8.1%; +0.2% y/y) and capital goods excluding autos (+2.8%; +13.1% y/y) rose m/m in July. Significantly, exports of nonmonetary gold plunged 42.0% (+7.6% y/y) in July, the fourth m/m fall in five months, following a 59.5% surge in June. Meanwhile, petroleum exports dropped 14.7% (+31.5% y/y) in July following a 19.9% slump in June and three consecutive m/m increases; nonpetroleum exports slid 0.8% (+9.4% y/y), the fourth m/m slide in five months, after a 2.4% June gain.
Customs value imports rose 3.9% (13.9% y/y) in July, up for the fifth time in six months, following a 2.5% decline in June. This reflected m/m rises of 11.4% (47.0% y/y) in capital goods excluding autos and 0.5% (-1.3% y/y) in nonfood consumer goods excluding autos, while imports of industrial supplies & materials (-3.2%; -11.2% y/y), other goods (-2.0%; +8.0% y/y), automotive vehicles, parts & engines (-1.4%; +3.9% y/y), and foods, feeds & beverages (-0.7%; -4.2% y/y) fell m/m in July. Notably, imports of nonmonetary gold advanced 17.1% (-84.9% y/y) in July following a 2.7% increase in June and two successive m/m declines. Meanwhile, petroleum imports dropped 12.2% (+7.3% y/y) in July after an 8.8% decrease in June and four straight m/m increases, while nonpetroleum imports rose 5.0% (14.3% y/y), the fifth m/m rise in six months, reversing a 2.0% June decline.
The services trade surplus rose to $31.02 billion in July, the highest since March, after increasing to $30.79 billion in June; it was bigger than $27.58 billion in July 2025. Services exports slid 0.4% (+4.6% y/y) in July, the first m/m decline since April, following a 1.1% gain in June. This reflected m/m decreases of 3.1% (-0.6% y/y) in travel services, 2.0% (+2.4% y/y) in transport services, and 1.5% (+12.5% y/y) in financial services, while exports of charges for the use of intellectual property (+2.0%; +9.7% y/y), telecommunications, computer, & information services (+1.2%; -0.6% y/y), and insurance services (+1.1%; +2.9% y/y) increased m/m in July. Services imports fell 0.8% (+1.8% y/y), the first m/m fall since March, after a 1.1% June rise. This reflected m/m drops of 7.9% (+16.1% y/y) in charges for the use of intellectual property, 2.8% (+4.4% y/y) in transport services, and 1.4% (-8.9% y/y) in insurance services, while imports of construction services (+3.7%; +13.1% y/y), maintenance & repair services (+3.2%; -28.0% y/y), and travel services (+1.4%; +1.1% y/y) rebounded m/m in July.
The U.S. goods trade deficit with China narrowed slightly to $15.24 billion in July from $15.35 billion in June. Exports climbed 3.0% (4.8% y/y) after a 2.3% June rebound; imports grew 0.8% (4.3% y/y), the weakest of three consecutive m/m increases, following a 4.5% June rise. The goods trade deficit with the European Union fell to $8.94 billion in July, the smallest since April, after widening to $10.90 billion in June, with exports down 0.2% (+3.3% y/y) and imports down 4.2% (+1.7% y/y). The trade shortfall with Japan rose to $4.18 billion in July, a five-month high, from $3.28 billion in the previous month, reflecting declines of 13.3% (+19.4% y/y) in exports and 2.9% (+4.1% y/y) in imports.
The international trade data can be found in Haver’s USECON database. Detailed figures on international trade are available in the USINT and USTRADE databases. The expectations figures are from the Action Economics Forecast Survey in AS1REPNA.

Winnie Tapasanun
AuthorMore in Author Profile »Winnie Tapasanun has been working for Haver Analytics since 2013. She has 20+ years of working in the financial services industry. As Vice President and Economic Analyst at Globicus International, Inc., a New York-based company specializing in macroeconomics and financial markets, Winnie oversaw the company’s business operations, managed financial and economic data, and wrote daily reports on macroeconomics and financial markets. Prior to working at Globicus, she was Investment Promotion Officer at the New York Office of the Thailand Board of Investment (BOI) where she wrote monthly reports on the U.S. economic outlook, wrote reports on the outlook of key U.S. industries, and assisted investors on doing business and investment in Thailand. Prior to joining the BOI, she was Adjunct Professor teaching International Political Economy/International Relations at the City College of New York. Prior to her teaching experience at the CCNY, Winnie successfully completed internships at the United Nations. Winnie holds an MA Degree from Long Island University, New York. She also did graduate studies at Columbia University in the City of New York and doctoral requirements at the Graduate Center of the City University of New York. Her areas of specialization are international political economy, macroeconomics, financial markets, political economy, international relations, and business development/business strategy. Her regional specialization includes, but not limited to, Southeast Asia and East Asia. Winnie is bilingual in English and Thai with competency in French. She loves to travel (~30 countries) to better understand each country’s unique economy, fascinating culture and people as well as the global economy as a whole.
More Economy in Brief
 Global