Asia| Sep 07 2026
Economic Letter from Asia: Shock and Boom
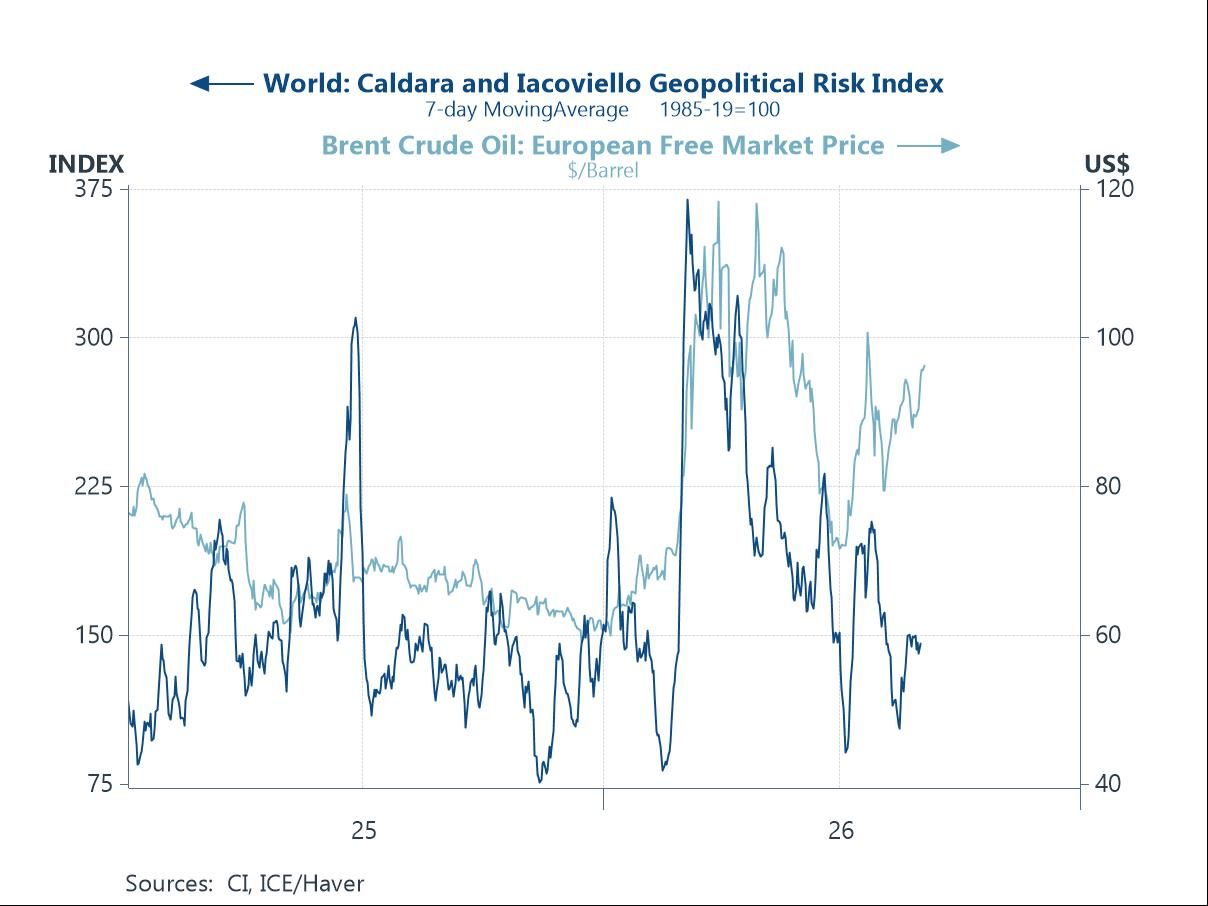
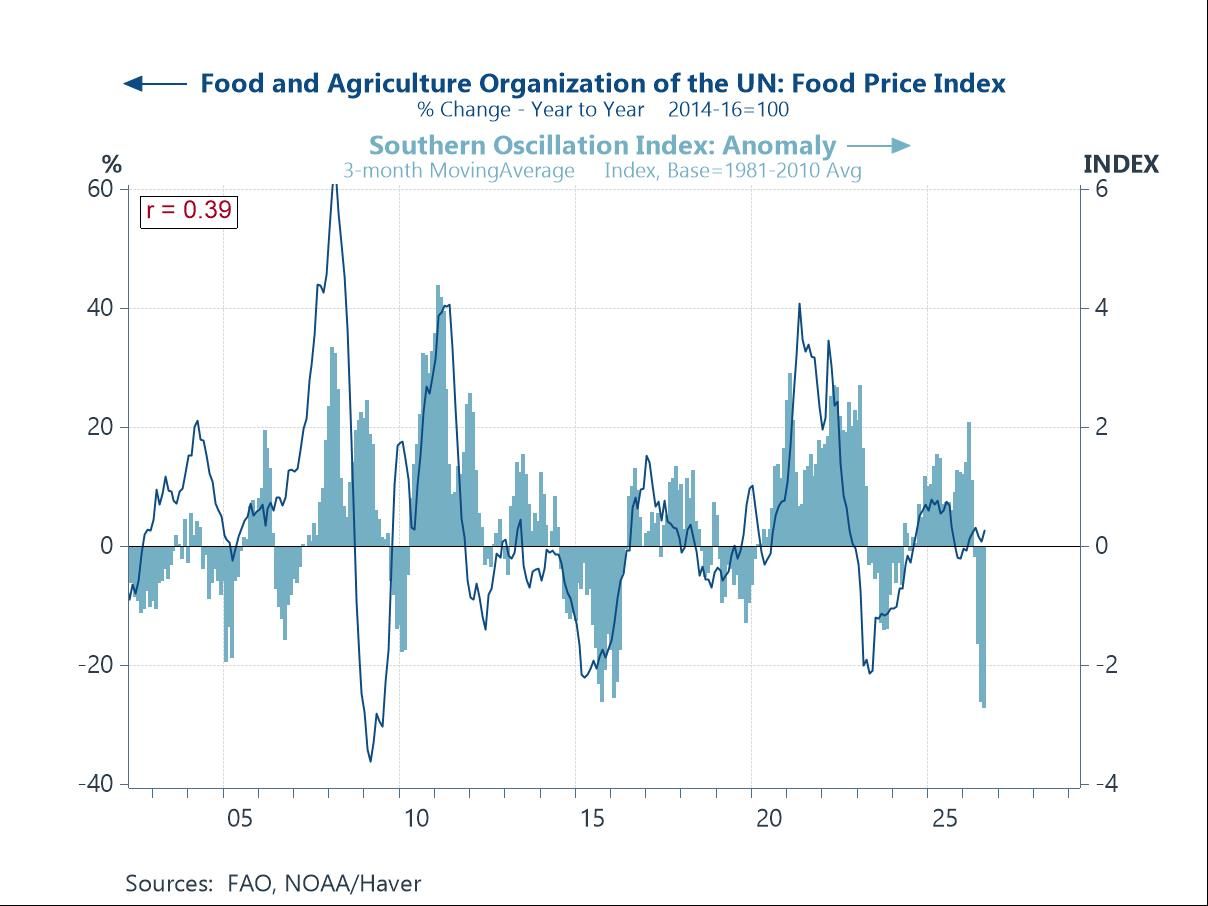
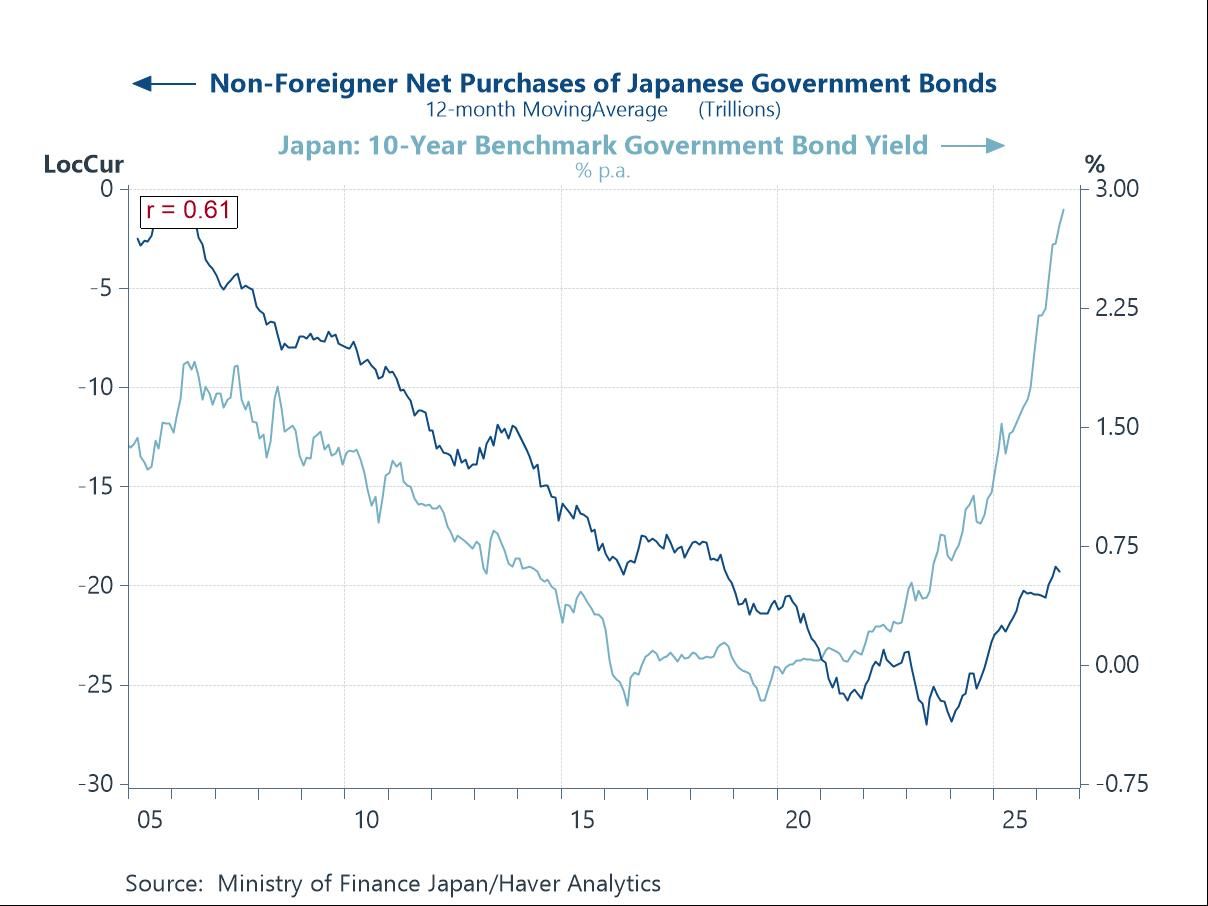
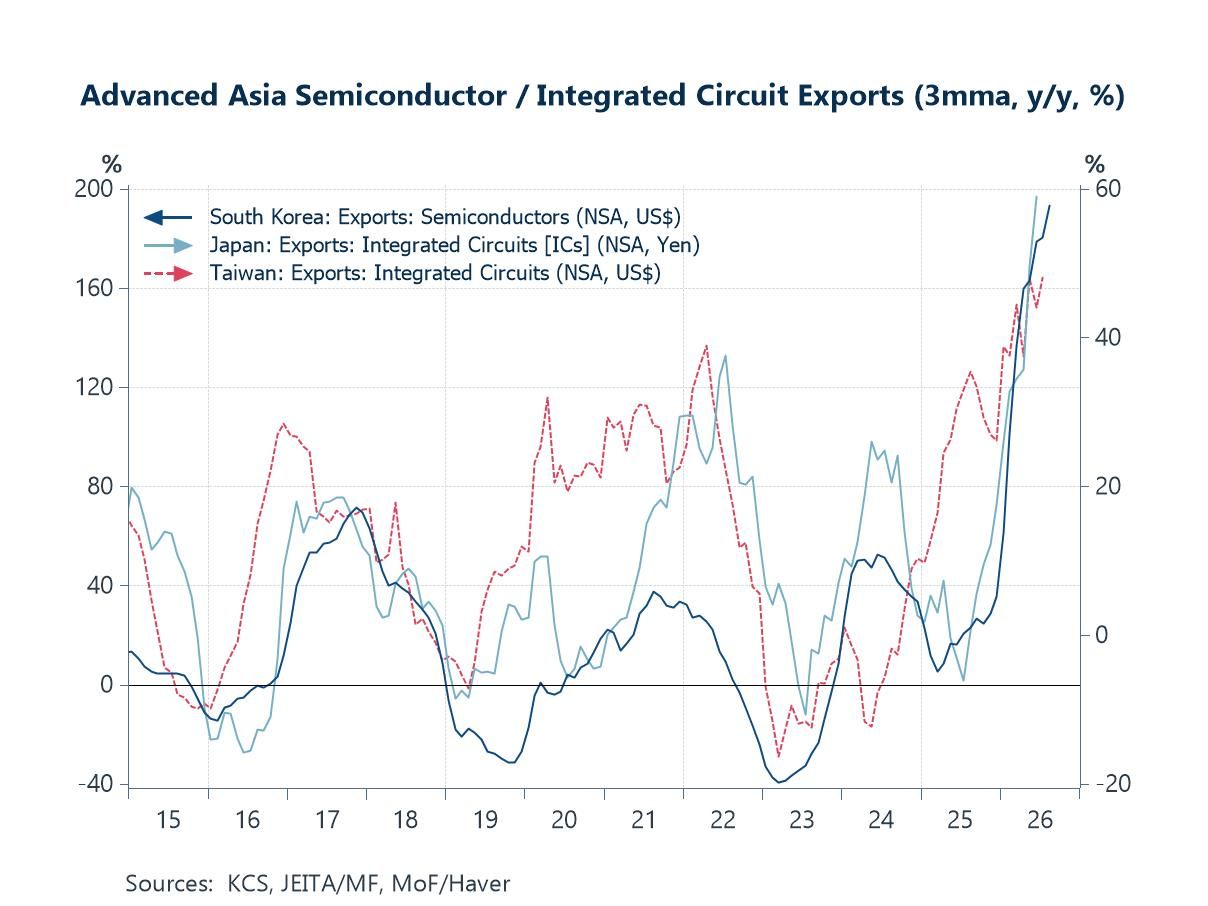
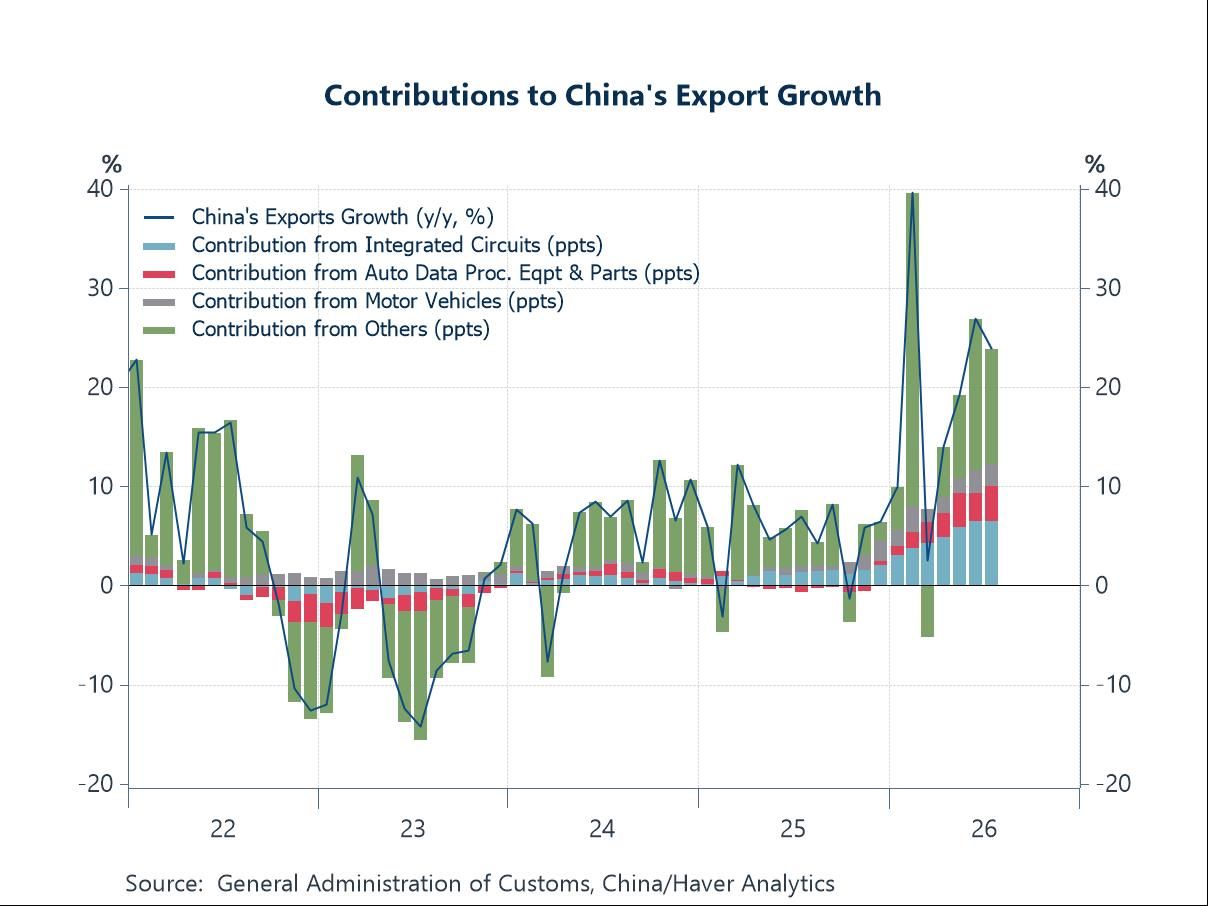
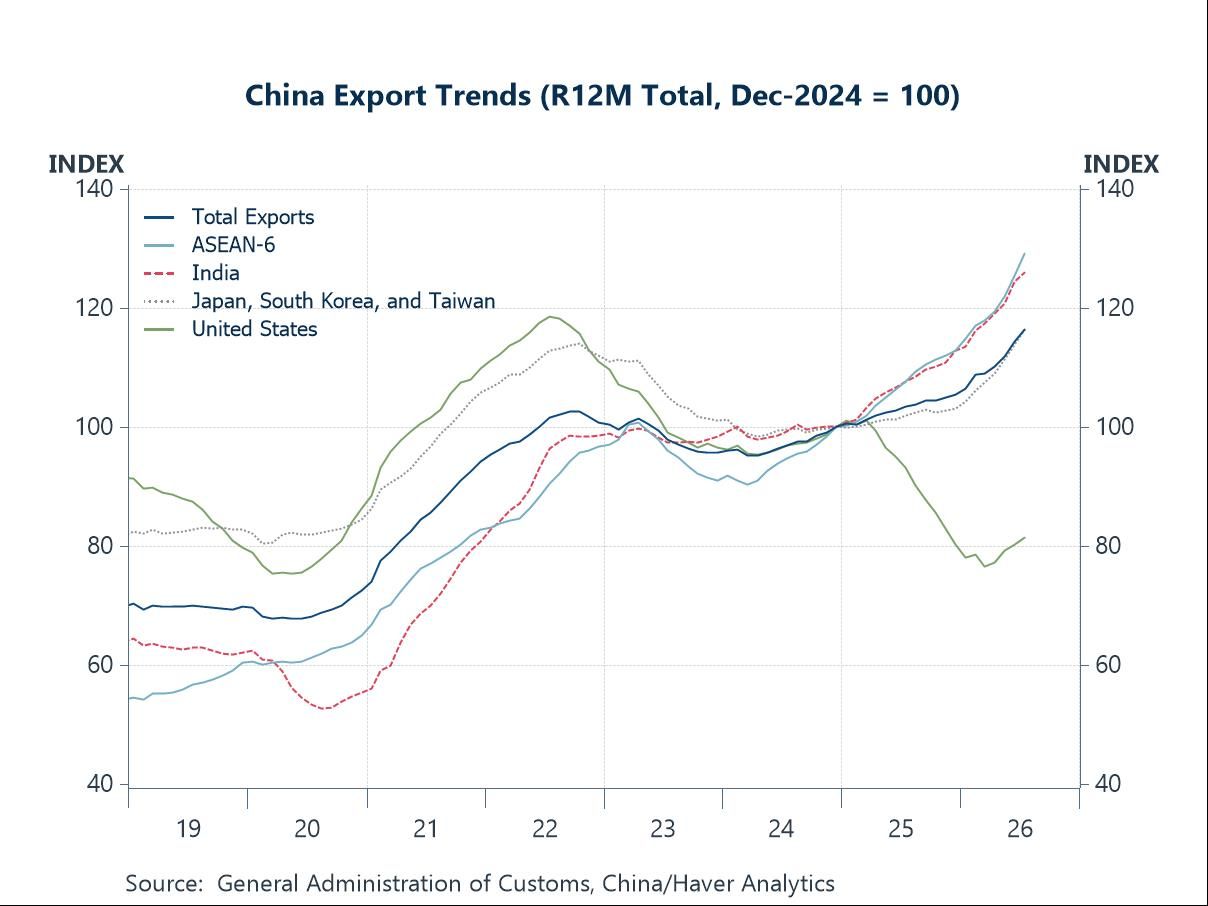
In this week's Letter, we weigh Asia's building supply-side inflation risks against the AI export boom still powering regional growth. The US-Iran conflict has escalated once again, lifting crude prices and keeping geopolitical risk elevated (chart 1). Should oil hold at current levels without advancing further, base effects should eventually pull that impulse out of inflation. A second price risk is now building, and it is El Niño, an event already under way (chart 2). Drier conditions in parts of Southeast Asia and redistributed rainfall elsewhere stand to disrupt crops and lift food prices. Markets have started to price these risks in through higher yields. Japanese government bond yields have surged alongside global peers, also pushed by fiscal concerns as the budget is drawn up. Domestic buyers have reduced their net sales of JGBs, with the 10-year yield now flirting with 3% (chart 3). Set against these pressures, advanced Asia's AI buildout continues to run apace. Producers of critical AI chips in Japan, Taiwan and South Korea are posting double and triple-digit export growth (chart 4). The focus is also broadening from AI infrastructure towards physical applications such as humanoid robots. China has benefited too, with integrated circuits and computer equipment contributing about half of its export growth (chart 5). The remainder has come from other goods, including EVs, amid a still-robust overall export trend. By region, ASEAN-6 and India have driven that growth, offsetting the steep fall in shipments to the US (chart 6). That success, however, has again deferred China's longer-term rebalancing towards consumption.
US-Iran tensions: No let up The US-Iran situation has escalated once again with a familiar headline, as both sides traded strikes over the weekend, with no clear resolution in sight. The latest strikes have brought the conflict well into its sixth month, pushing crude oil prices higher and keeping measures of geopolitical risk elevated (chart 1). All of this continues to give policymakers reasons to worry. With that said, while elevated oil prices have been pushing inflation upwards, that impulse should eventually fade. If prices stay at current high levels for at least another six months without advancing substantially further, base effects will pull them out of inflation calculations.
Chart 1: Geopolitical risk and brent crude prices
El Nino to the fore With Asia already grappling with still-high oil prices, even as much of it benefits from the ongoing AI boom. A further inflation risk is now building, and that risk is El Niño. This is not a forecast but an event already under way, which many authorities have touted as probably the biggest one yet. Indicators of the event, among them the Southern Oscillation Index (SOI), have been signalling it strongly for months (chart 2). The impacts are already showing through, including via rising sea surface temperatures and increased wildfire risks in parts of Southeast Asia. Rainfall is also being redistributed, greatly increased in some areas and greatly reduced in others. All of this stands to disrupt crop production, thereby bringing about an adverse food supply shock. That shock could send food price inflation surging soon, adding to policymaker woes. It is one to watch in the coming months, as more news of disrupted agricultural production starts to unfold.
Chart 2: Food prices and the Southern Oscillation Index
Japanese government bonds The recent rise in global bond yields looks driven less by inflation than by real yields, as markets confront the prospect of heavier fiscal spending, capex-intensive investment paths and the issuance needed to fund them. Inflationary risks are compounding that repricing rather than leading it: oil prices have surged, and El Niño effects are ongoing and strengthening, building pressure from both energy and food. Japan is a case in point. JGB yields have surged alongside those of global peers, with the added impetus of the government's deliberations over next year's budget and what they imply for future fiscal outlay. The 10-year yield is now flirting with 3%, a level not seen since the 1990s, and high enough to have turned the tide for domestic buyers, who have cut their net sales of JGBs (chart 3) as the yields on offer become harder to pass up.
Chart 3: Non-foreigner net purchases of Japanese government bonds vs. yields
Advanced Asia Inflation risks and firmer yields aside; the AI buildout has continued to gather pace in advanced Asia. Producers of critical AI chips continue to benefit from massive export growth, which has in turn supported overall growth. These economies, including Japan and Taiwan, have kept posting dizzying double-digit growth in their exports of related goods, such as semiconductors and integrated circuits (chart 4). In South Korea's case, growth has run into triple digits, showing just how much the AI-related boom has already run. The picture is also shifting, and the focus is no longer only on infrastructure supporting newer, front-end AI models. It is increasingly taking shape in the physical realm, such as in humanoid robots, where recent weeks have unveiled growing capabilities.
Chart 4: Advanced Asia semiconductor / integrated circuit exports
China The advanced Asian economies above have not been the only ones in Asia to benefit from the ongoing AI boom. China too has continued to reap export benefits via its shipments of integrated circuits and computer-related equipment. Together, those two categories have contributed about half of overall exports growth in recent months (chart 5). The rest speaks to a broader story, as much of China's exports growth has also been driven by other goods. Those include motor vehicles, such as EVs, and come amid a still-robust upward trend in overall exports. These export revenues matter for growth at China's current juncture. The economy continues to undergo a two-speed dynamic, in which domestic growth drivers remain weak whilst external, export-oriented sectors supplement overall growth.
Chart 5: Contributions to China’s exports growth by good
By region, much of China's export growth continues to be driven by shipments to ASEAN-6 and India (chart 6). Shipments to the advanced Asian economies of Japan, South Korea and Taiwan have leaned close to the broader overall trend. On China's exports to the US, we saw a steep fall after President Trump began his second term in 2025, when trade tensions returned to the fore. Trade has since improved mildly in 2026, albeit remaining far from the end-2024 baseline. The overarching theme is that even with a stark pivot in exports away from the US, China has found alternative destinations. Those markets have not only made up for the US shortfall but also delivered robust growth alongside it. However, that continued pursuit of export-driven growth has once again deferred China's longer-term aim to rebalance towards a more consumption-driven economy.
Chart 6: China export trends by region

Tian Yong Woon
AuthorMore in Author Profile »Tian Yong joined Haver Analytics as an Economist in 2023. Previously, Tian Yong worked as an Economist with Deutsche Bank, covering Emerging Asian economies while also writing on thematic issues within the broader Asia region. Prior to his work with Deutsche Bank, he worked as an Economic Analyst with the International Monetary Fund, where he contributed to Article IV consultations with Singapore and Malaysia, and to the regular surveillance of financial stability issues in the Asia Pacific region.
Tian Yong holds a Master of Science in Quantitative Finance from the Singapore Management University, a Master of Science in Analytics from the Georgia Institute of Technology, a Bachelor of Science in Mathematics from the Singapore University of Social Sciences, and a Bachelor of Science in Banking and Finance from the University of London.
More Economy in Brief