Global| Jul 23 2026
Charts of the Week: The Uneasy Calm
by:Andrew Cates
|in:Economy in Brief
Summary
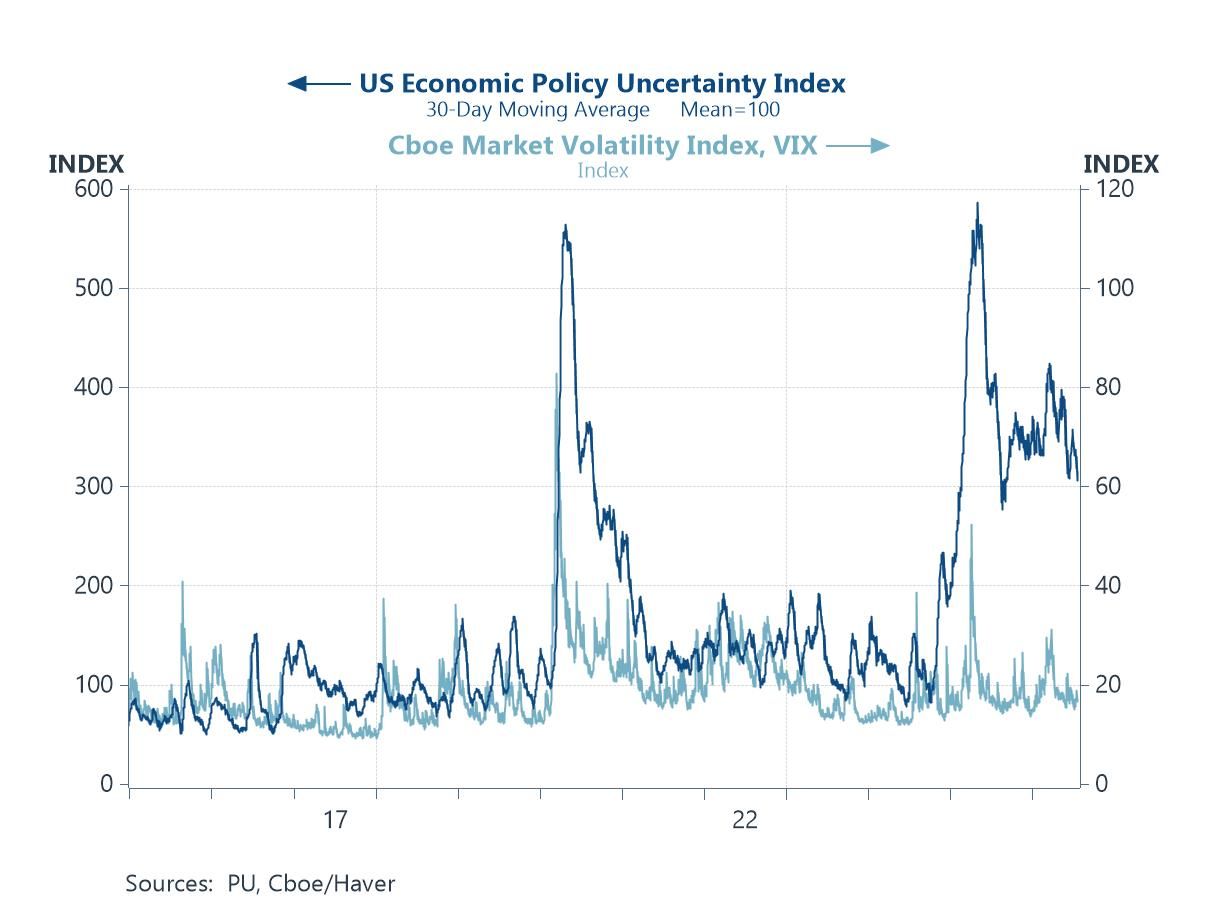
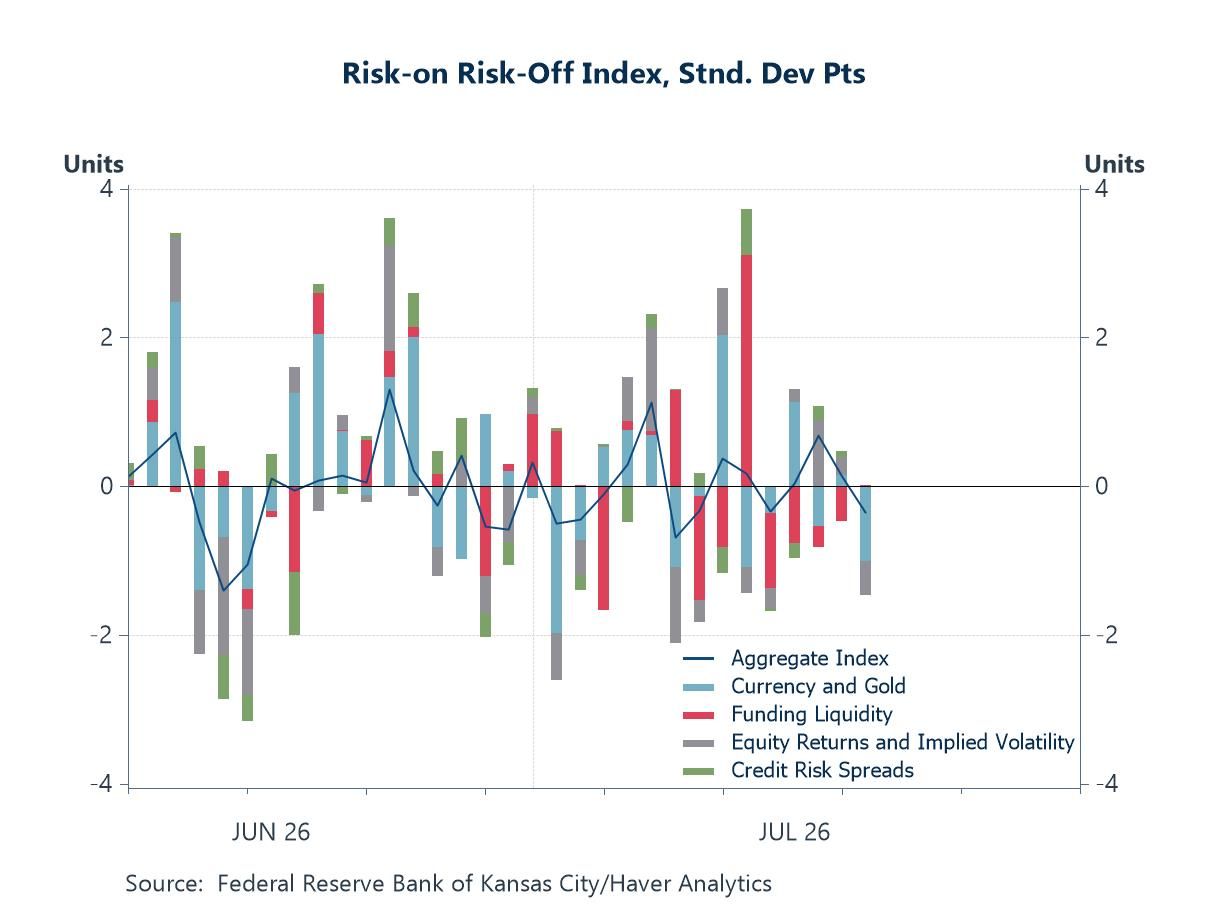
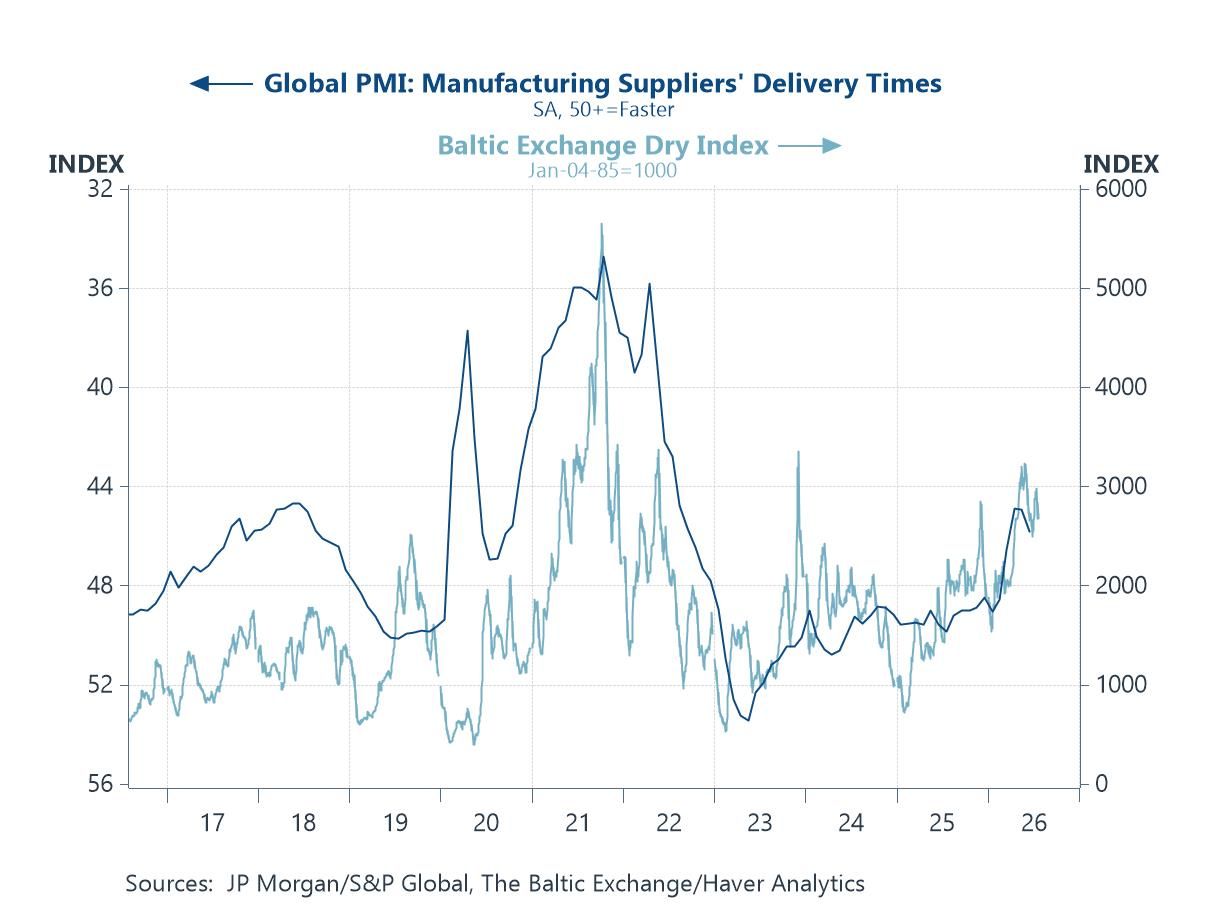
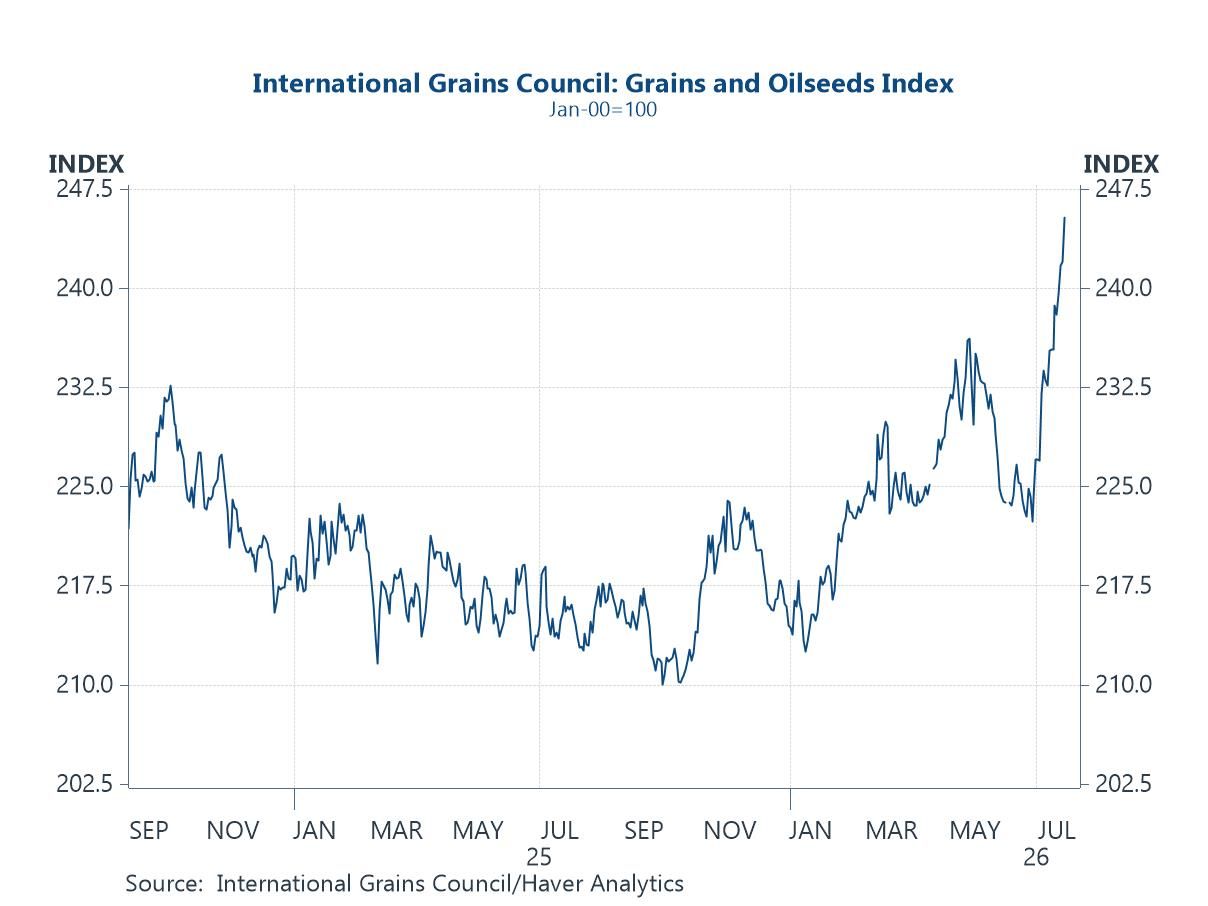
Global financial markets have retained a notably composed tone this week, even as the geopolitical backdrop turned more unsettled once again. News of renewed skirmishes between the United States and Iran reintroduced a risk premium that investors had only lately begun to set aside, yet equities held firm and volatility stayed low. Last week's US inflation and Chinese GDP releases did little to disturb that calm, though the Chinese figures laid bare how soft domestic demand there has become. That composure is an enduring - and notable - feature. Measures of policy uncertainty remain elevated by historical standards, yet market volatility has sunk to the low end of its range — a divergence that says a good deal about the prevailing mood (chart 1). A new risk-appetite gauge from the Federal Reserve Bank of Kansas City, now carried on the Haver platform, points the same way, with investors still firmly disposed to take on risk (chart 2). Beneath the surface, though, evidence of supply-side stress is mounting, with freight rates and suppliers' delivery times pointing to renewed strain (chart 3) — a theme of this week's podcast with the Baltic Exchange. Nor is the pressure confined to manufacturing: firmer grain prices raise the question of whether a developing super El Niño is at work (chart 4). On the demand side, Haver's calculation of China's credit impulse helps to account for the softness in last week's growth figures (chart 5). And beyond the cycle lies the structural, as Britain welcomes a new prime minister in Andy Burnham to a persistent growth problem in which the cost of energy looms large (chart 6).
A World on Edge, Markets at Ease The gap between how uncertain the world feels and how calm markets are behaving has rarely looked as wide as it does today. A widely followed gauge of US economic policy uncertainty remains elevated by any historical standard, standing well above its long-run average and sustained by the confrontation with Iran, an unsettled trade environment and persistent doubts over the policy outlook. The Cboe volatility index, the VIX, presents a striking contrast, having drifted to the lower end of its range — a level more usually associated with calm and untroubled markets. During the pandemic shock of 2020 the two moved higher in lockstep; today they have decoupled almost entirely, with investors seemingly content to look through a backdrop that the uncertainty measure suggests is anything but benign.
Chart 1: Policy Uncertainty and Market Volatility
A New Lens on Global Risk Appetite New to the Haver platform this week is the Risk-On/Risk-Off, or RORO, index produced by the Federal Reserve Bank of Kansas City — a measure designed to capture the realised variation in global investor risk appetite. Drawing on daily data from asset markets in the United States and the euro area, it relies on no single indicator but instead distils signals from four broad areas — advanced-economy credit risk, equity market volatility, funding conditions, and the behaviour of currencies and gold — into a single series that summarises the common thread running through them, and with it the overall risk-bearing capacity of international investors. Set against that backdrop, the index tells a consistent story. It has leaned (albeit very modestly) towards the risk-on end of its range in recent weeks, corroborating the impression that investors remain willing to carry risk despite the noisier geopolitical backdrop.
Chart 2: The Kansas City Fed Risk-On/Risk-Off Index
Reading the Supply Side: Freight and Delivery Times Two of the more reliable bellwethers of the physical economy are the Baltic Dry index, which tracks the cost of moving dry bulk commodities by sea, and the suppliers' delivery times component of the global manufacturing PMI. Freight rates and delivery times tend to move together, tightening when demand is running ahead of the system's capacity to supply it and easing when it is not. Watching how the two have evolved of late offers an early read on whether supply-side pressures are building again or continuing to unwind. This is terrain we explore in more depth in this week's podcast, recorded with the Baltic Exchange, whose members sit at the very heart of the world's shipping markets and whose data underpin the Baltic Dry index itself. We will also be returning to the theme in a forthcoming webinar, in which we will look more closely at what freight and shipping indicators can tell us about the turning points in global activity.
Chart 3: Baltic Dry Index and Global PMI Suppliers' Delivery Times
Grain Prices Stir — Is a Super El Niño to Blame? After a long stretch of relative calm, global grain prices have begun to firm. A number of forces are arguably at work, but one stands out as a candidate. Forecasters have grown increasingly confident that a strong, potentially a so-called super, El Niño is developing in the Pacific, and events of that intensity have a long history of disrupting agricultural output, from drought across parts of Asia and Australia to erratic rainfall in the Americas. A broad gauge of grain prices has turned higher in a manner consistent with markets beginning to price in that risk. The stakes are not trivial. Food carries a far heavier weight in household budgets across the emerging world than in advanced economies, so a weather-driven rise in grain prices would land unevenly, complicating the task of central banks that had been hoping the worst of the energy and food-price shocks of recent years were behind them.
Chart 4: A Broad Gauge of Global Grain Prices
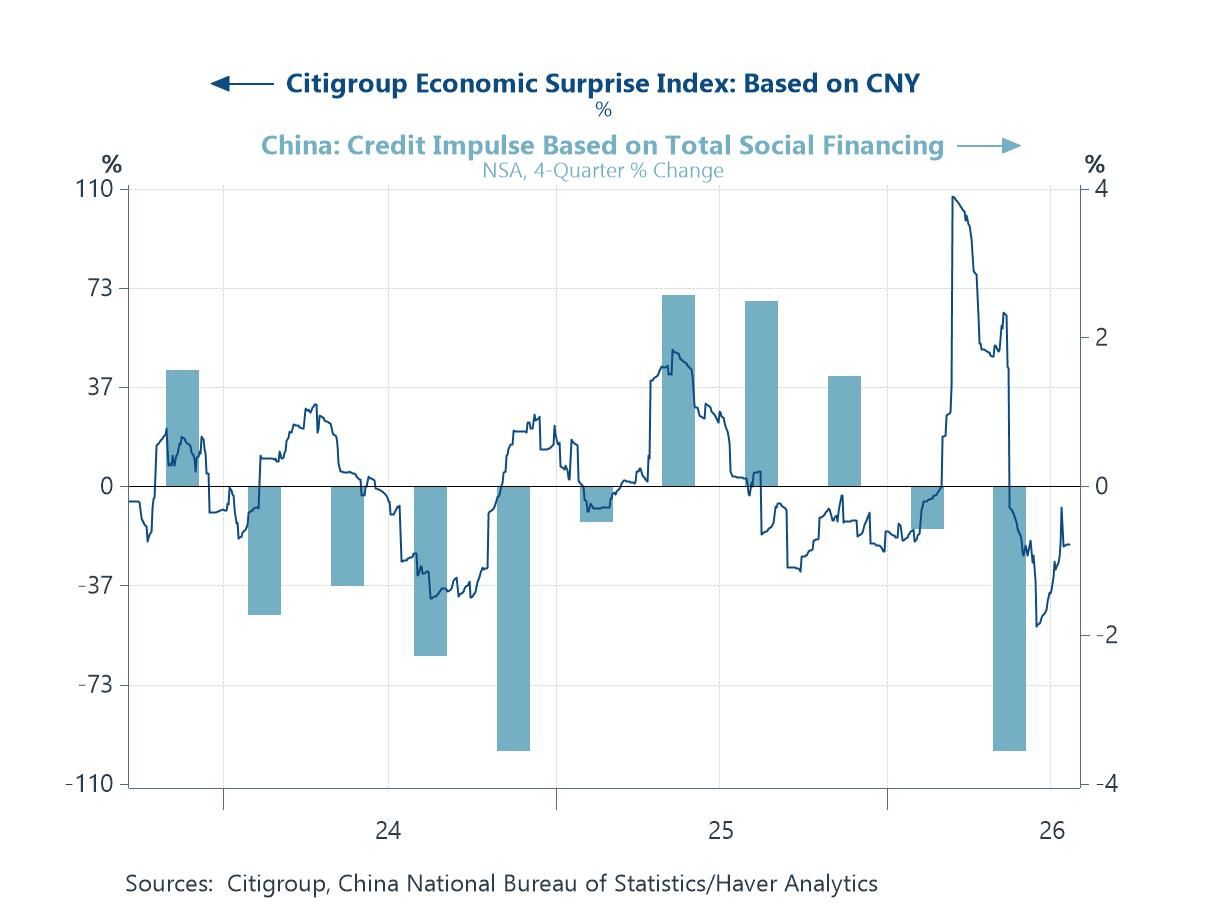
China's Credit Impulse and the Demand Puzzle The soft patch in Chinese domestic demand that last week's Q2 GDP figures laid bare has an instructive counterpart in Haver's own calculation of China's credit impulse — broadly, the change in the flow of new credit relative to the size of the economy. The chart below certainly hints that one reason for why the latest growth data disappointed on the domestic side is because the credit impulse has been weak. For all the announcements of support, the credit engine that has historically powered Chinese demand has yet to be convincingly re-engaged.
Chart 5: China's Credit Impulse (Haver Calculation)
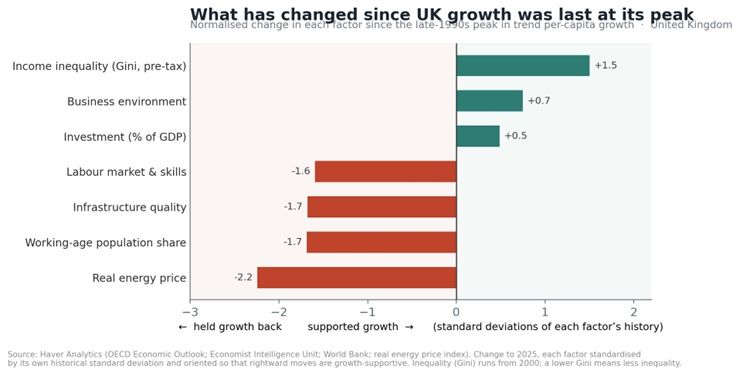
Britain's Growth Problem Lands on a New Prime Minister's Desk Our final chart brings a structural question home. As Andy Burnham takes office as the new UK prime minister, the challenge that will define his tenure is an old and stubborn one: how to lift a rate of economic growth that has been disappointing for the better part of two decades. The chart below is an attempt to put that challenge in context. It measures how a range of factors have changed since the late 1990s, when the trend rate of British growth per head last stood at its historical highs, with each expressed in comparable terms so that the movements can be read side by side. The picture is instructive for anyone thinking about where to concentrate effort. Several of the things one might reach for first have, in fact, moved the right way — the business environment has improved, investment has held up, and measured income inequality has if anything eased. What has weighed on growth, persistently and unmistakably, has been the rising real cost of energy and an ageing, shrinking share of the population of working age. The demographic pressure is difficult to reverse quickly. The energy constraint, by contrast, is one that policy could address. As we have argued at length in these pages before, the real price of energy has been a quiet and underappreciated drag on growth across the advanced economies since the turn of the century, and Britain has been among the more exposed.
Chart 6: What Changed as UK Growth Fell from Its Peak

Andrew Cates
AuthorMore in Author Profile »Andy Cates joined Haver Analytics as a Senior Economist in 2020. Andy has more than 25 years of experience forecasting the global economic outlook and in assessing the implications for policy settings and financial markets. He has held various senior positions in London in a number of Investment Banks including as Head of Developed Markets Economics at Nomura and as Chief Eurozone Economist at RBS. These followed a spell of 21 years as Senior International Economist at UBS, 5 of which were spent in Singapore. Prior to his time in financial services Andy was a UK economist at HM Treasury in London holding positions in the domestic forecasting and macroeconomic modelling units. He has a BA in Economics from the University of York and an MSc in Economics and Econometrics from the University of Southampton.
More Economy in Brief