U.S. Philly Fed Manufacturing Index Jumps in July
by:Sandy Batten
|in:Economy in Brief
Summary
- The headline index jumped to 41.4 in July, much larger than expected and the highest reading since November 2021.
- The outsized increase was widespread across components with the ISM-adjusted index rising to 58.1, its highest reading since January 2025.
- Prices remained elevated but were little changed in July from June.
- Delivery times lengthened meaningfully, indicating some incipient supply chain problems.
- The survey’s broad indicators for future activity continued to suggest expectations for growth over the next six months, although most readings fell meaningfully.
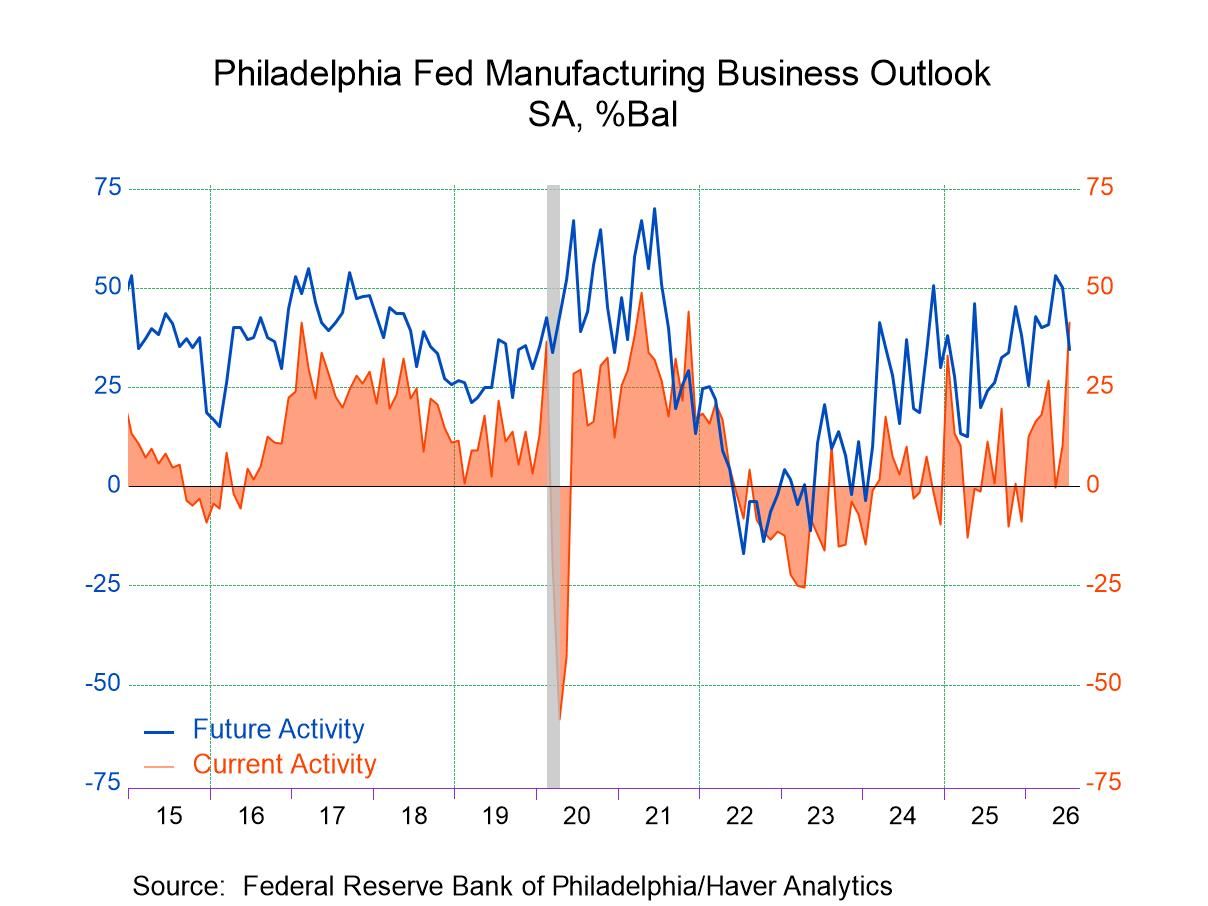
The Current Activity Diffusion Index from the latest Manufacturing Business Outlook Survey (MBOS) conducted by the Federal Reserve Bank of Philadelphia jumped to 41.4 in July, its highest reading since November 2021, from 10.3 in June. The survey covers the third Federal Reserve District. A reading of 12.0 for July was expected by the Action Economics Forecast Survey. More than 53% of respondents reported increases (up from 32% last month), far exceeding the 12% reporting decreases (down from 22%); 24% of respondents reported no change in current activity (down from 45%). Survey responses were collected from July 6 to July 13.
The headline index is the answer to just one question: whether activity increased, decreased or was unchanged from the previous month. Haver Analytics calculates an ISM-adjusted current activity diffusion index from the five key components using the methodology employed to construct the national ISM index. This figure rose to 58.1 in July, the highest reading in a year and a half, from 53.1 in June and well above the critical 50 value that separates contraction from expansion.
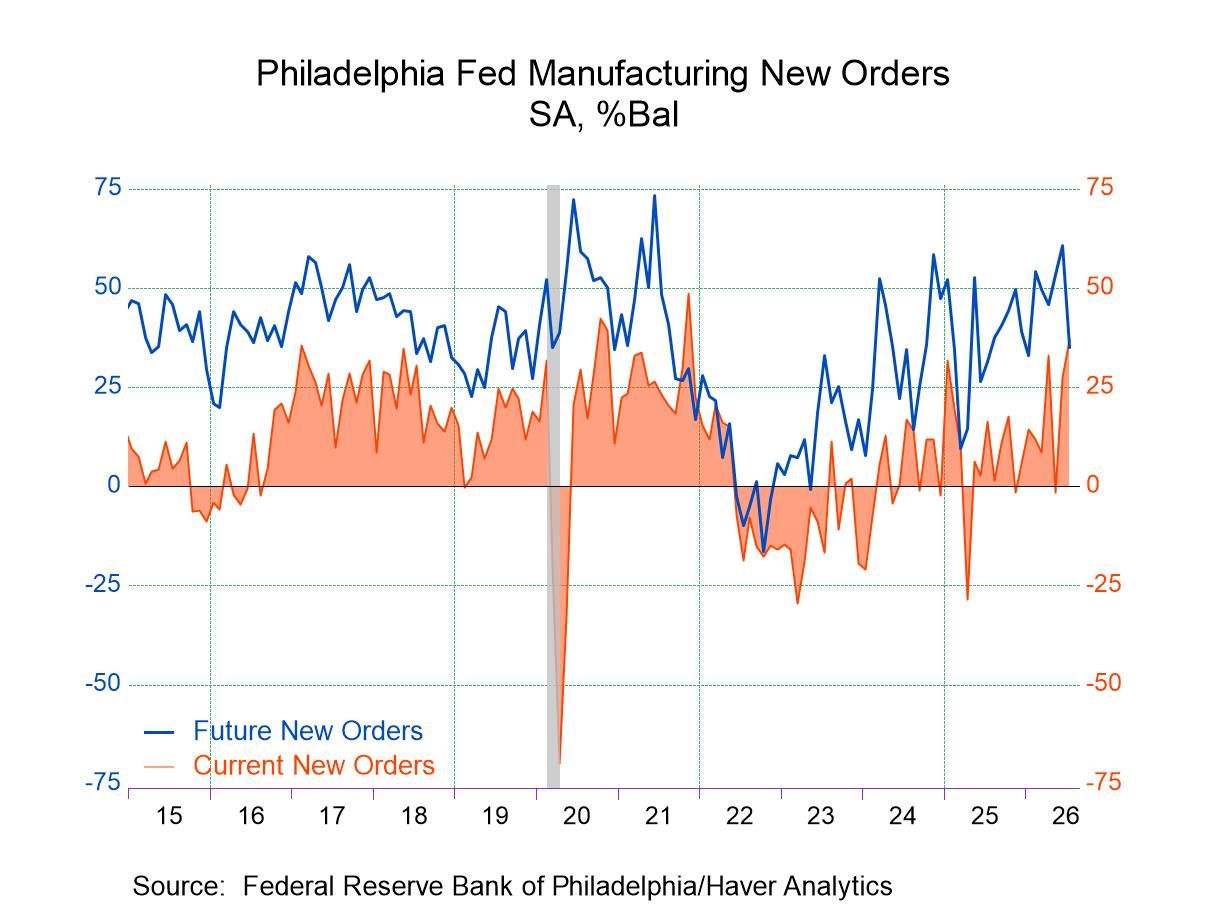
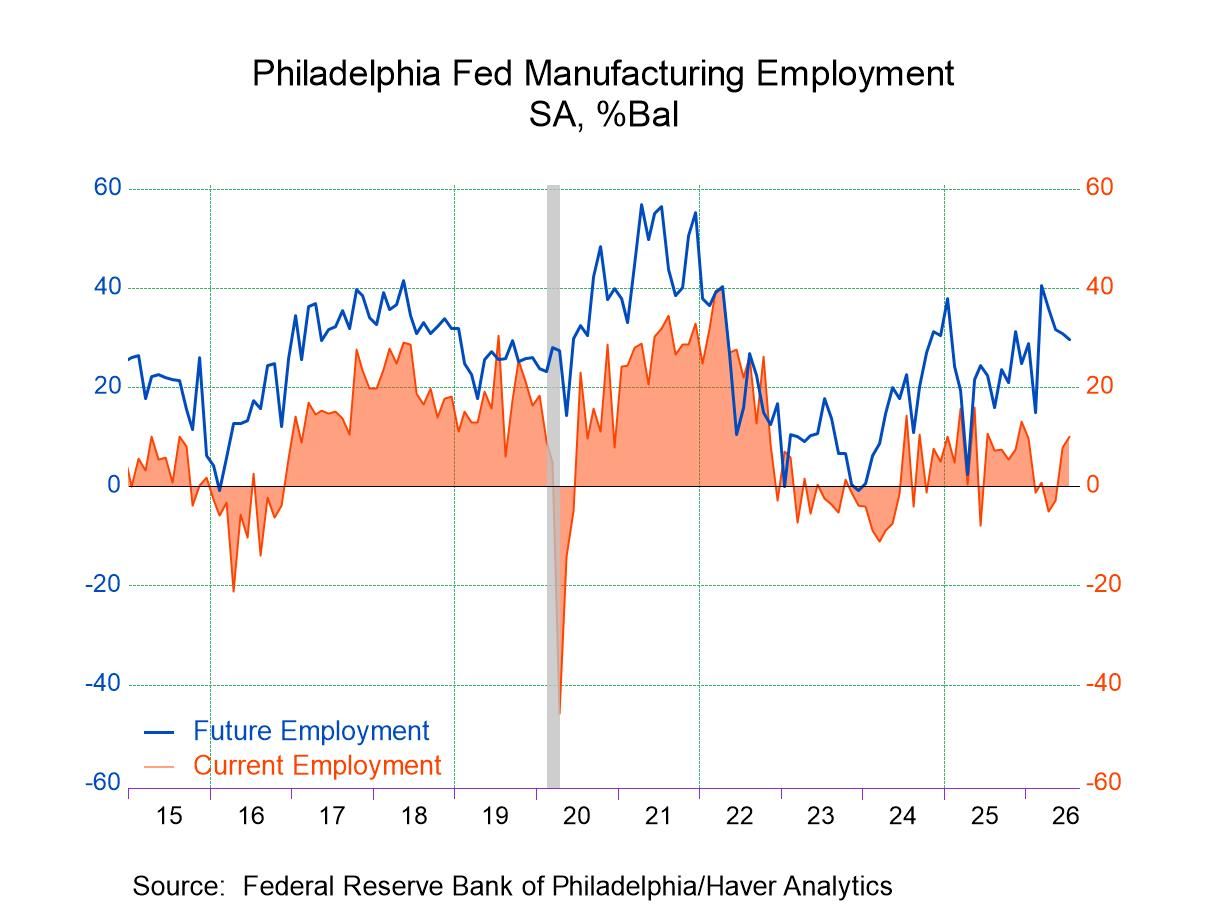
For the component indexes, the new orders index rose to 37.0 in July, a nearly five-year high, from 27.3 in June with 50.4% of respondents reporting an increase in orders. The shipments index jumped to 33.7 in July from 14.9 in June with 44.7% of respondents reporting an increase. Delivery times lengthened meaningfully to 9.6 in July from -2.6 in June and -10.4 in May, pointing to incipient supply chain problems stemming from the escalated US-Iran conflict. Employment indicators strengthened in July with the number of employees index rising to 10.0, the highest reading since last December, from 7.9 in June. The average workweek index jumped to 14.0 in July from -6.5 in June.
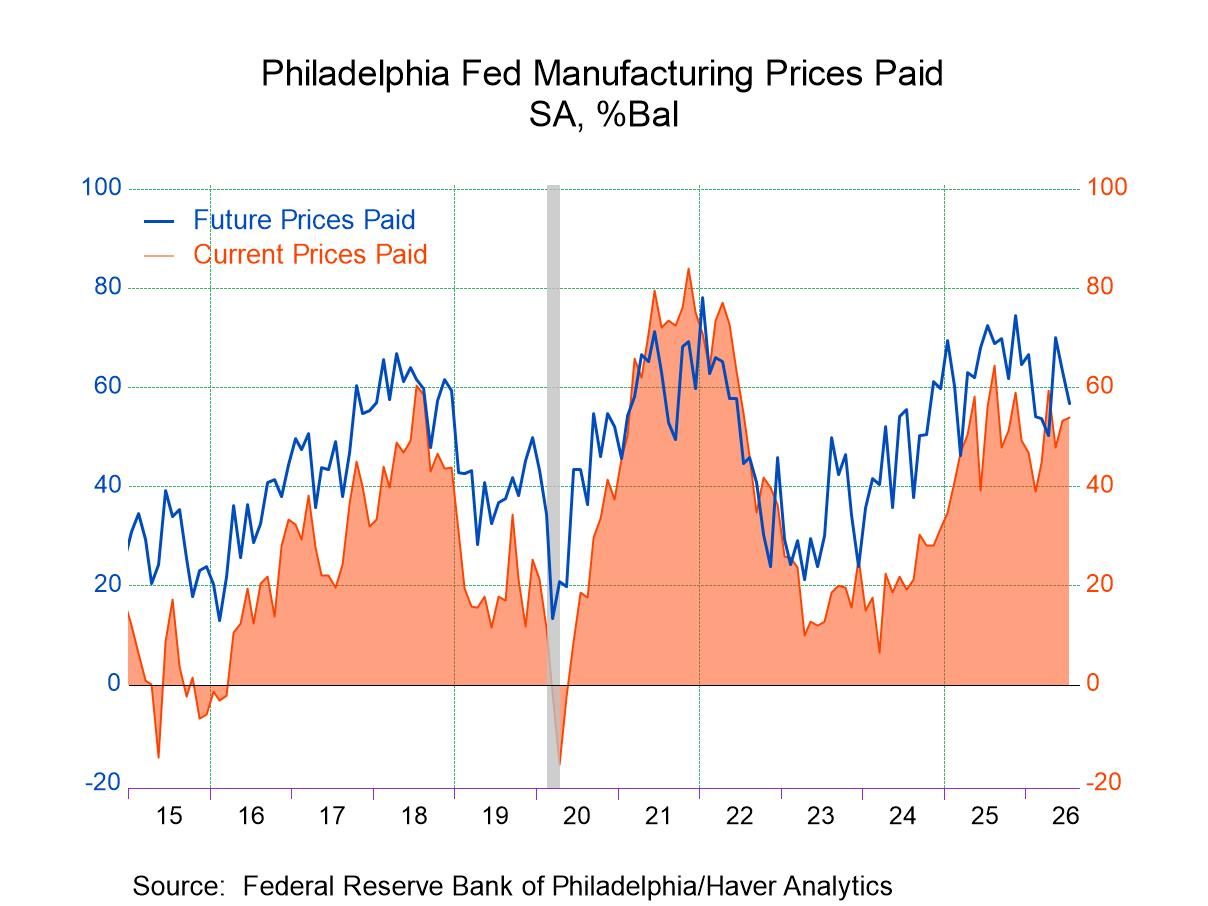
Respondents continued to report elevated prices, both paid and received. The prices paid index edged up to 53.9 in July from 53.2 in June with 53.9% of respondents reporting paying higher input prices and none reporting a decrease. The prices received index rose to 27.4 in July from 20.3 in July but was still below the 33.5 reading in April just after the escalation of the US-Iran conflict. Twenty-seven percent of respondents reported receiving higher prices while none reported receiving lower prices.
The survey’s broad indicators for future activity continued to point to expectations for growth over the next six months, although readings moderated. The diffusion index for future general activity fell 16 points this month to 34.4. The future new orders index fell 26 points to 35.1, and the future shipments index decreased 21 points to 39.3. The firms continue to expect increases in employment over the next six months, but the future employment index inched down 1 point to 29.5. Both future price indexes declined but remained above their long-run averages: The future prices paid index moved down from 63.2 to 56.7, and the future prices received index dropped 26 points to 41.4. The index for future capital expenditures remained elevated but fell 11 points to 30.1.
The Manufacturing Business Outlook Survey (MBOS), conducted by the Federal Reserve Bank of Philadelphia, is a monthly survey of manufacturers in the Third Federal Reserve District. Participants indicate the direction of change in overall business activity and in the various measures of activity at their plants. The diffusion indexes in the MBOS represent the percentage of respondents indicating an increase minus the percentage indicating a decrease. The indexes range from -100 to +100 with positive values indicating an increase in activity. The series from the survey dating back to May 1968 can be found in Haver’s SURVEYS database. The expectations forecast figures are from the Action Economics Forecast Survey in AS1REPNA.

Sandy Batten
AuthorMore in Author Profile »Sandy Batten has more than 30 years of experience analyzing industrial economies and financial markets and a wide range of experience across the financial services sector, government, and academia. Before joining Haver Analytics, Sandy was a Vice President and Senior Economist at Citibank; Senior Credit Market Analyst at CDC Investment Management, Managing Director at Bear Stearns, and Executive Director at JPMorgan. In 2008, Sandy was named the most accurate US forecaster by the National Association for Business Economics. He is a member of the New York Forecasters Club, NABE, and the American Economic Association. Prior to his time in the financial services sector, Sandy was a Research Officer at the Federal Reserve Bank of St. Louis, Senior Staff Economist on the President’s Council of Economic Advisors, Deputy Assistant Secretary for Economic Policy at the US Treasury, and Economist at the International Monetary Fund. Sandy has taught economics at St. Louis University, Denison University, and Muskingun College. He has published numerous peer-reviewed articles in a wide range of academic publications. He has a B.A. in economics from the University of Richmond and a M.A. and Ph.D. in economics from The Ohio State University.
More Economy in Brief
 Asia
Asia