

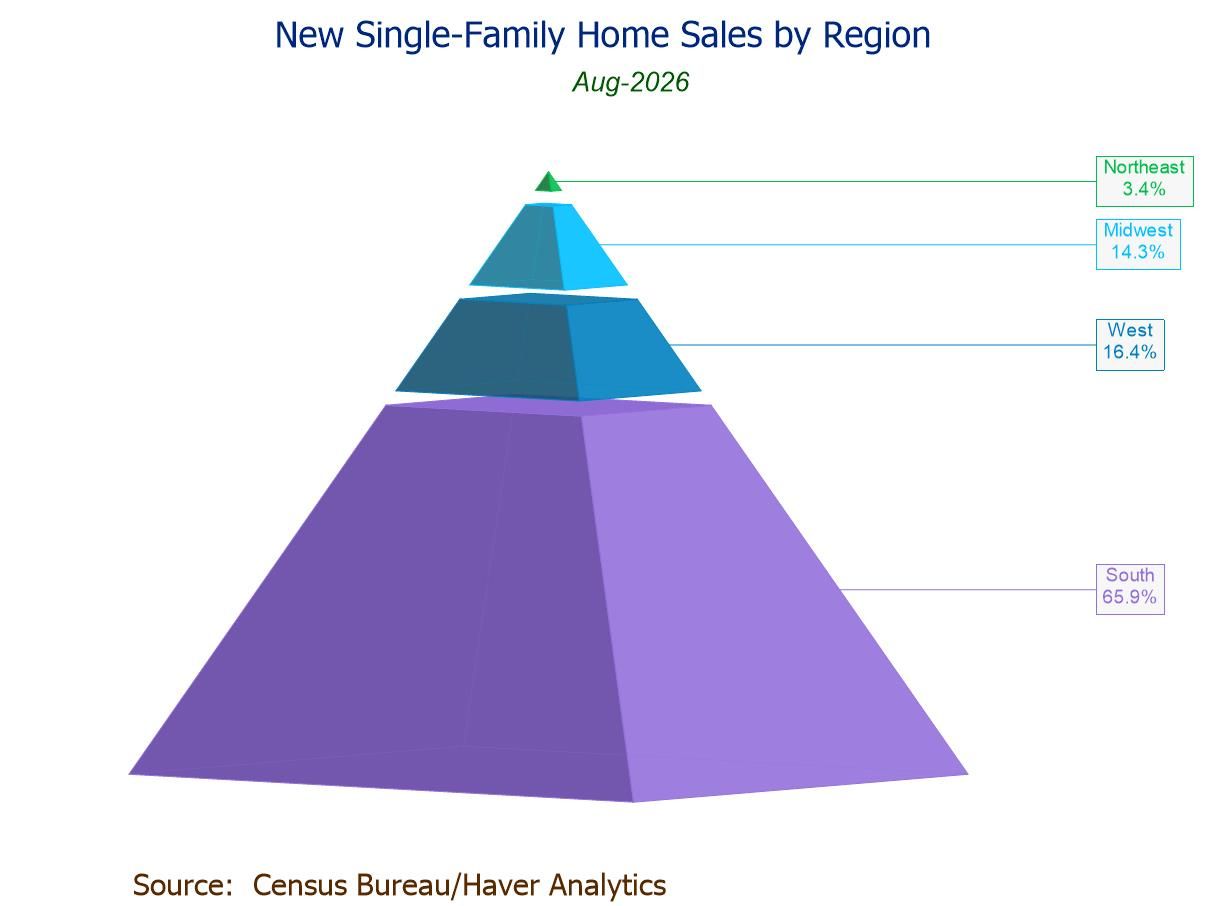
- Sales +6.4% m/m (-2.0% y/y) to 684,000 in Aug.; up 27.9% from a July ’22 low.
- Sales m/m up in the Midwest (+84.9%) and South (+6.9%); down in the Northeast (-36.1%) and West (-15.2%).
- Median sales price +0.4% m/m to $393,700, first rise since Apr.; avg. price -9.1% m/m to $478,700, a two-year low.
- Unsold inventory unchanged (-2.0% y/y) at 483,000; months' supply down to 8.5 mths., lowest since Dec. ’25.
USA| Sep 24 2026
U.S. New Home Sales Rebound to an Eight-Month High in August
More Commentaries
 United Kingdom| Sep 21 2026
U.K. Housing Surveys and Consumer Sentiment Support the View of Weak Growth
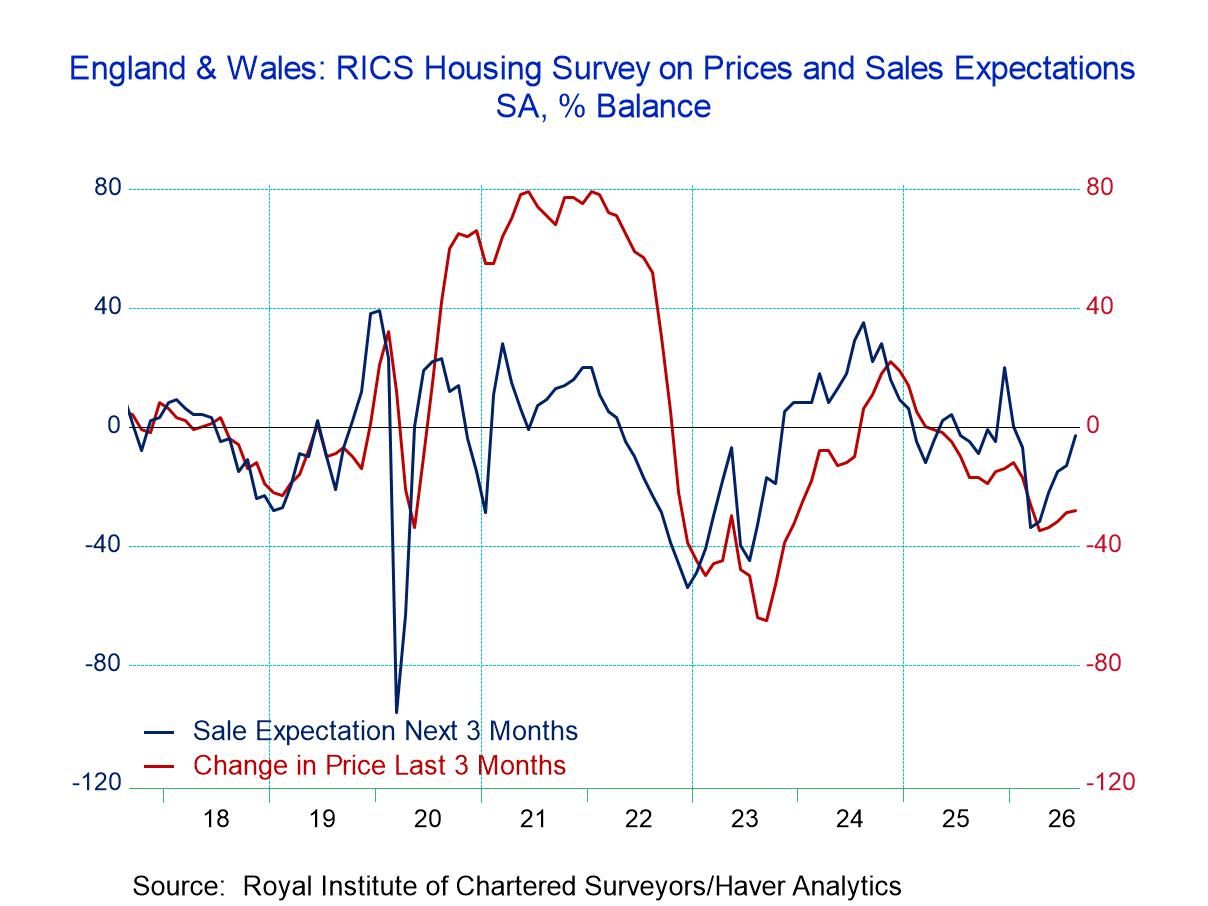
The exhibits in this report feature a graph based on the RICS survey showing U.K. sales expectations for the next three months versus the last three months, while tabular data show Nationwide housing prices and how they are moving month-to-month as well as year-over-year. In addition, the table provides the recent GfK survey results on consumer confidence in the U.K. and presents rankings of housing prices and consumer confidence.
These statistics paint a somewhat mixed picture of the U.K. economy although clearly they paint a picture of an economy that is not firing on all cylinders. The ranking on year-over-year house price changes in the Nationwide survey and the ranking for the GfK consumer confidence index give highly similar relative signals, with both of them around the 30th to 40th percentiles in their historic queues of data extending back to 1992.
Housing prices are still advancing more slowly than they did in previous years. While consumer confidence is still low, it has shown improvement in recent months, and the last two readings showed year-over-year improvement in the monthly data. The RICS chart on the pace of sales shows some improvement, if not yet outright gains. Still, housing conditions are weak, and the question of whether they are limping back into the black, whether prices are holding on for small gains, or whether there is a more solid recovery taking place remain unanswered. So far, at least, it does not look like backsliding.
 Asia| Sep 21 2026
Economic Letter from Asia: Held in Reserve
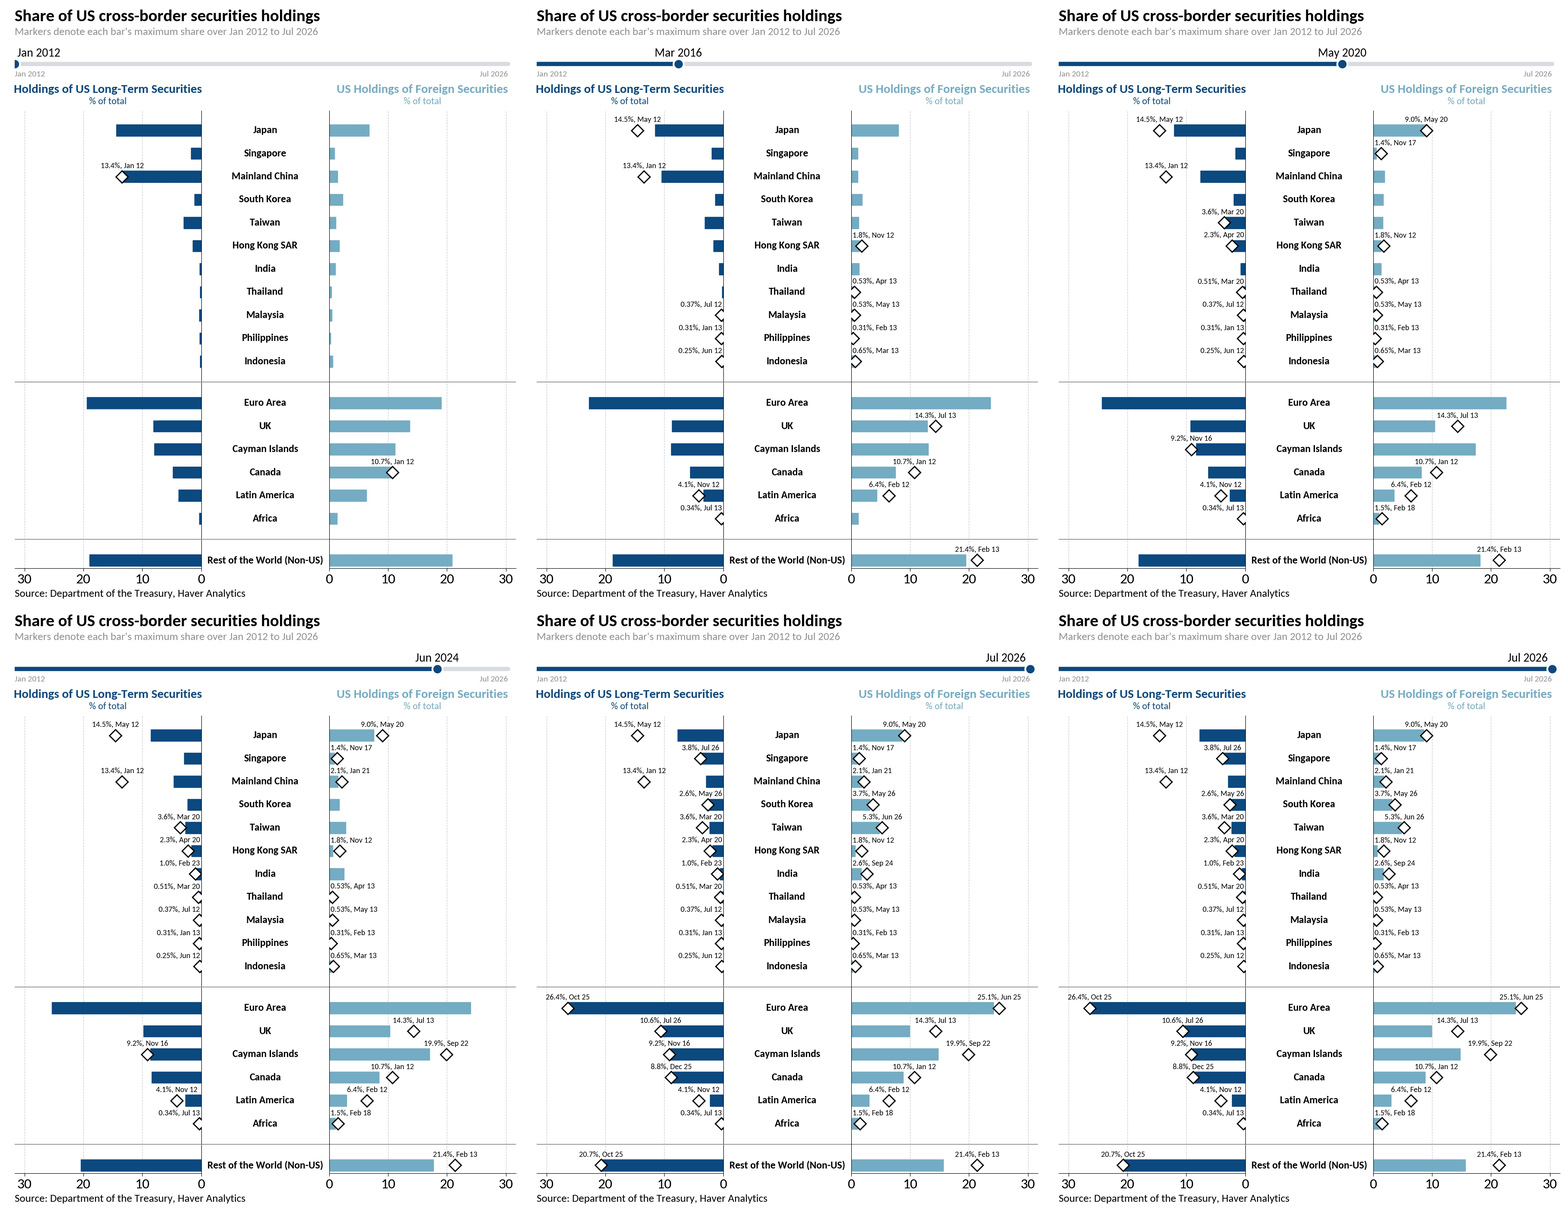
This week, we assess whether Asia is really moving away from the dollar by examining its US asset holdings, reserves, gold purchases and trade settlement. We then turn to Japan’s monetary normalisation. Asia’s presence in US portfolio markets has declined since the early 2010s (chart 1). Japan's share of foreign holdings of US long-term securities has halved, and mainland China's has fallen further still. The euro area and the UK have absorbed most of that ground. Even so, Japan is still the largest foreign holder of Treasuries, and a reshuffling among creditors need not mean an exit from dollar assets. Official reserves tell a similar story (chart 2). The dollar's share is down close to 6 percentage points over eight years, to 57.1%, yet no single currency has picked up all of it. The residual group of other currencies gained most, which points to diversification rather than substitution. Gold fits that reading (chart 3), with Singapore, India, Thailand and China all adding heavily in volume terms. Reserve growth alone may explain part of the rise. Trade settlement has moved least of all (chart 4). South Korea still settles about 84% of exports and 79% of imports in dollars, and broader studies point the same way. Moving to Japan, the central bank raised its policy rate to 1.25% last week, with Governor Ueda striking a hawkish note (chart 5). The spread to Fed, ECB and Bank of England policy rates has narrowed to about 2 percentage points. The yen, meanwhile, has rebounded from a record low after coordinated intervention, while the 10-year JGB yield has touched 3% (chart 6).
Gold, the US, and the US dollar Asia's footprint in US portfolio markets has thinned considerably since the early 2010s (chart 1). Japan's share of overall foreign holdings of US long-term securities has roughly halved, from a peak near 14.5% in 2012 to about 8% in July 2026. Mainland China's slide is starker, from 13.4% at the start of 2012 to roughly 3%. The euro area has absorbed most of that ground, rising from about 19% to around 26%, while the UK sits at a record 10.6%. Japan nonetheless remains the largest foreign holder of Treasuries at USD 1.1tn, while China's holdings have slipped to USD 618bn, the lowest since September 2008. A reshuffling among creditors is not always the same as an exit from dollar assets. Japan also remains Asia's largest holder on both sides of the ledger, accounting for about 8.6% of US holdings of foreign securities.
 USA| Sep 18 2026
U.S. Industrial Production Flat in August; Manufacturing IP Down
- August IP 0.0% (+1.4% y/y) after four consecutive m/m increases, remaining on an upward trend.
- Manufacturing -0.3% (+0.9% y/y), first m/m decline since Dec., w/ durables -0.5% and nondurables 0.0%.
- Selected high-tech 0.0% after four straight m/m rises; motor vehicles -1.2%, second successive m/m drop.
- Utilities +1.8% (+6.2% y/y), fourth rise in five mths., led by a 2.1% gain in electric utilities output.
- Mining +0.1% (+0.3% y/y), up for the fourth time in five mths.
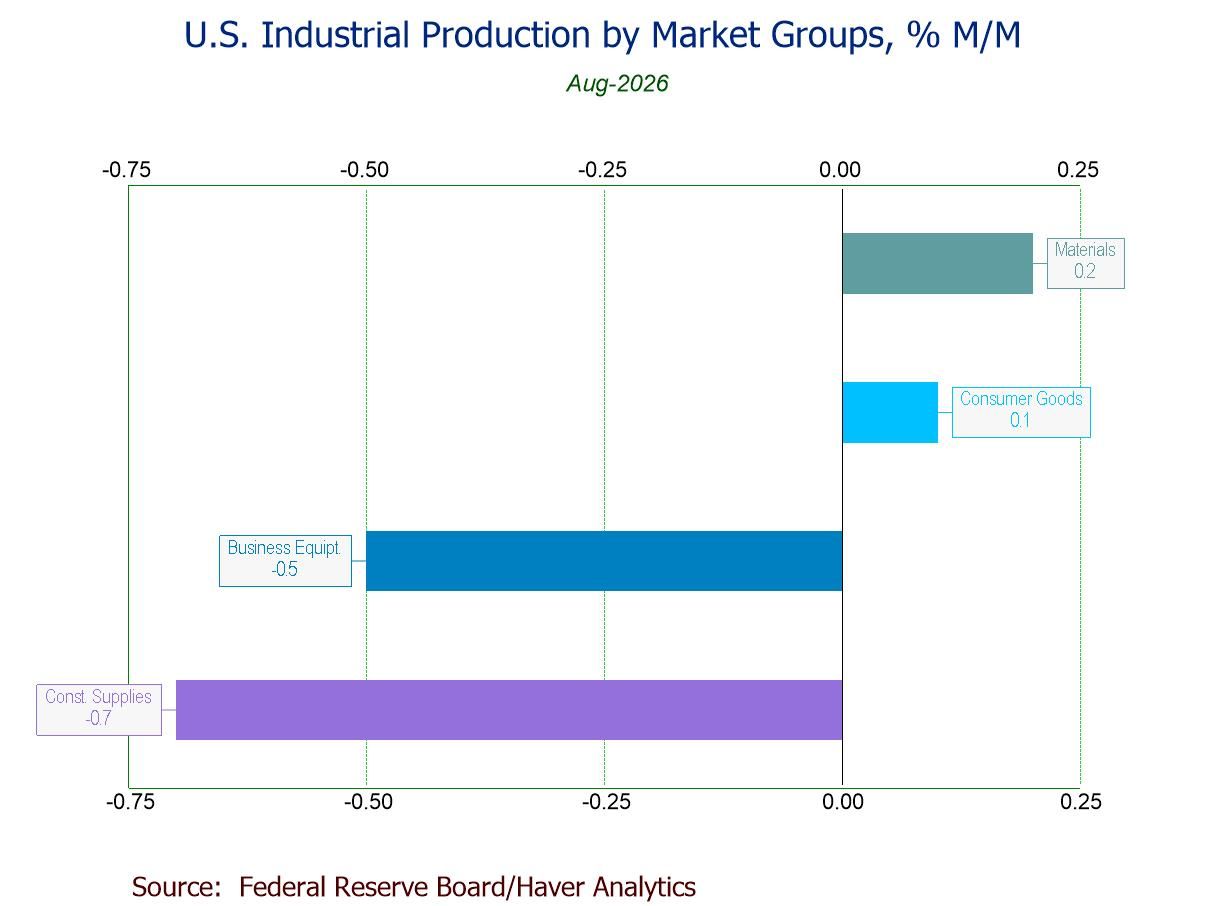
- Key categories in market groups post mixed results.
- Capacity utilization steady at 76.3%, highest since July ’25; mfg. capacity utilization down to 75.7%, lowest since March.
 Germany| Sep 18 2026
German PPI Shows Pressure, But It’s Limited
German inflation in August saw the headline pop while core remained copacetic. The difference between the two trends is like night and day.
Headline PPI Germany’s PPI spurted for the second consecutive month, rising by 1.2% in both July and August. These jumps followed a drop of 0.3% in June. The German headline PPI is up by 4.6% over 12 months, up by 12.5% at an annual rate over six months, and up at an 8.3% annual rate over three months. Those gains are largely driven by energy trends.
The core is a different story The PPI excluding energy in August gained by 0.2%, the same as in July, after a 0.3% rise in June. Sequentially, the ex-energy PPI rose 3.1% (SAAR) over 12 months, at a 5.0% annual rate over six months, and at a 3.3% annual rate over three months. That’s still excessive, but much less worrisome.
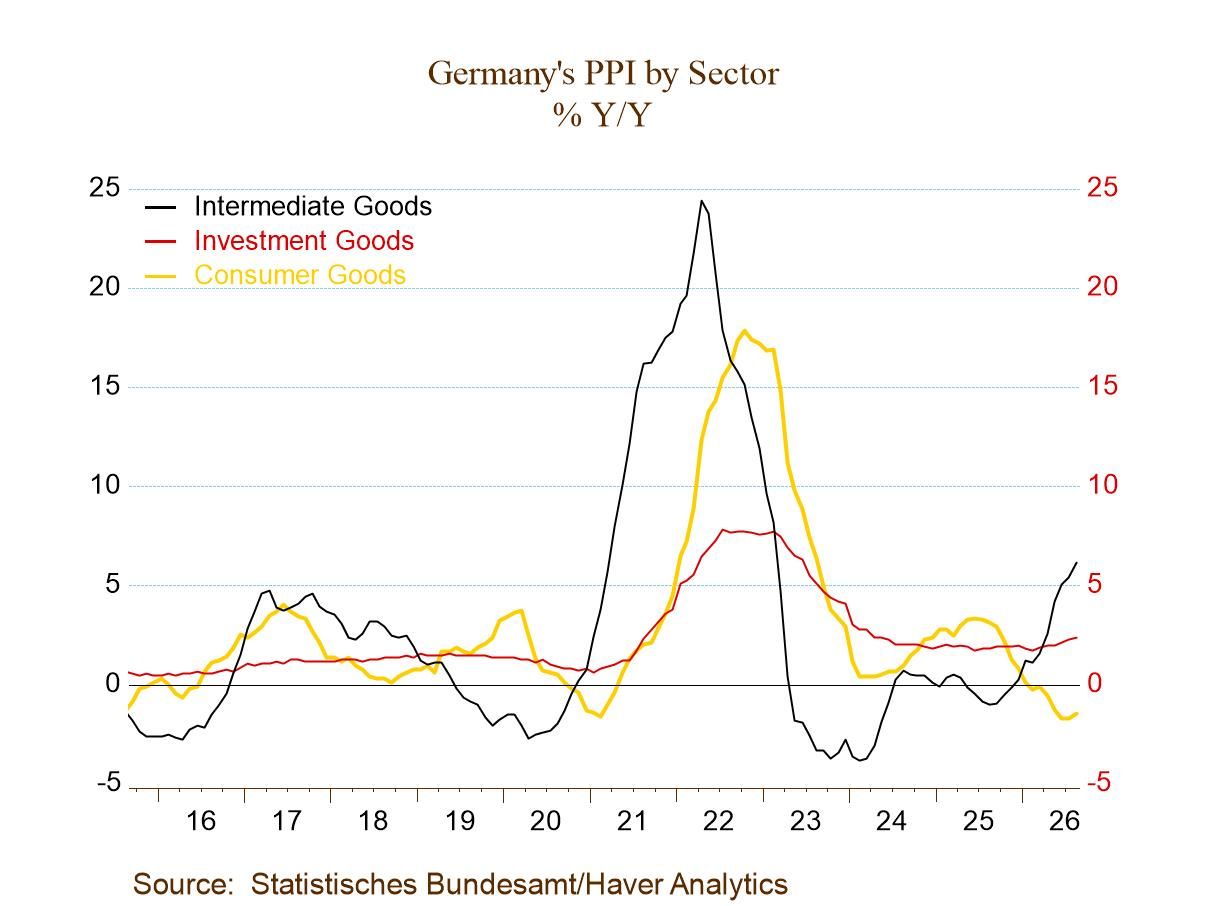
Sector stories The sectors, using unfortunately NSA data, show consumer prices moving lower over three months, with very mild, near-target overshooting for investment goods, while intermediate goods bear the burden of pressure. These observations are for the three-month annualized growth rates but apply equally to the 12-month growth rates.
The CPI for reference German CPI inflation, included in the table as a reference, shows roughly the same patterns as the PPI, with the headline growing in excess of the ECB’s EMU-wide target pace, overshooting by about a percentage point, while the CPI ex-energy skims along at a nearly acceptable pace of overshoot that ranges from 2.2% to 2.5% over three months, six months, and 12 months.
Inflation forces present but surprisingly contained Clearly, inflationary pressures are present in Germany and just as clearly, they are not spreading but have done their damage by the weight of energy in each sector. This does not mean there will not be progression or knock-on effects, just that, so far, they have not appeared. And part of this is because of ongoing economic weakness in Germany.
QTD Quarter to date (QTD), the German headline two months into Q3 has risen at an 8.3% annual rate as the ex-energy PPI runs at a pace of 4%. Both are too hot. Sector inflation rates on NSA data are acceptable except for intermediate goods where the pace rises to 5.3% in the quarter (energy, again). The CPI on a quarterly basis also generates a 3.2% headline gain against a core pace of just 2.2%.
 Global| Sep 17 2026
Charts of the Week: The Price of Money
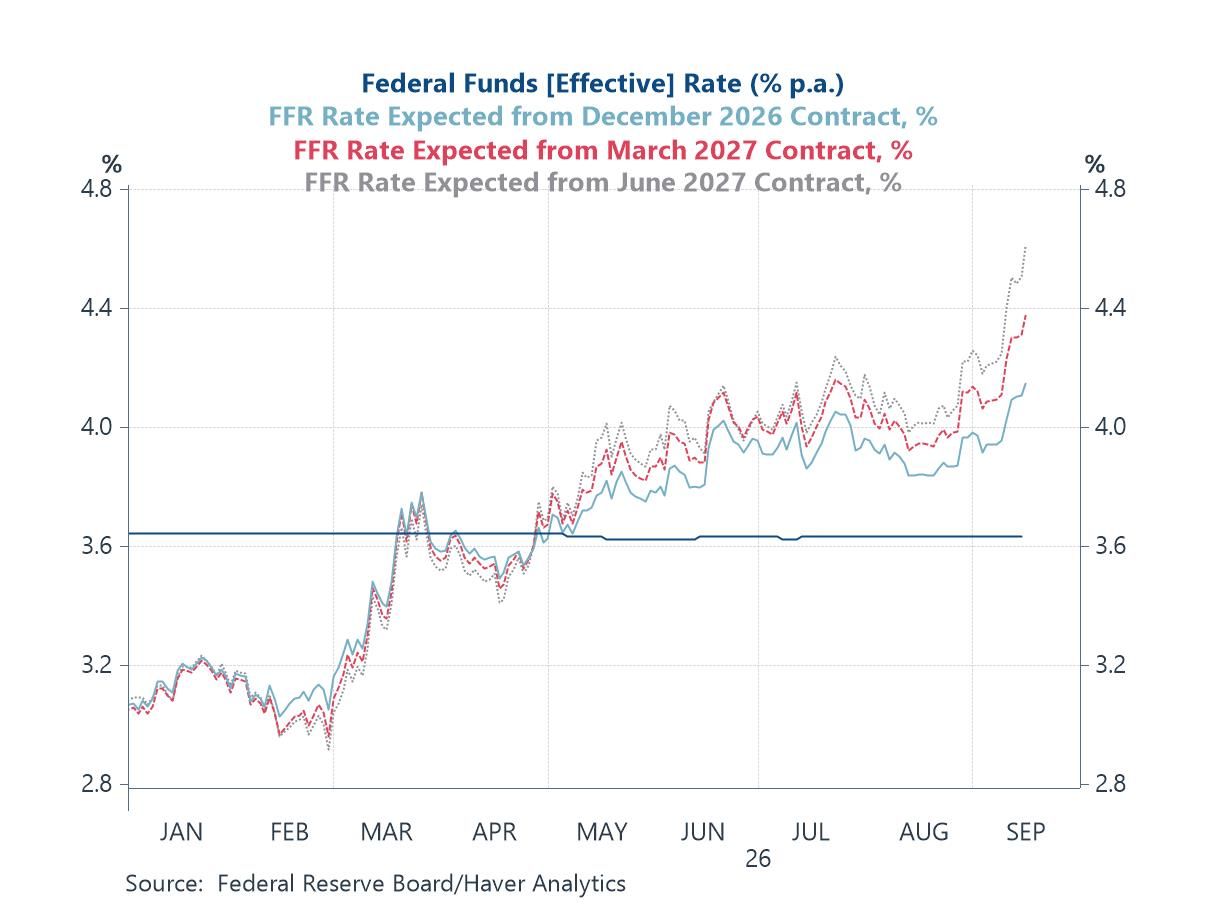
The cost of energy and the cost of money set the tone this week. Brent crude held above $100 a barrel with a major Saudi pipeline still offline, and the Federal Reserve raised the federal funds rate by a quarter point, its first increase since 2023. The projections accompanying the decision mattered more than the decision itself, and futures have since priced a policy rate by the middle of 2027 above anything the committee has pencilled in, with the ten-year Treasury yield through 5 per cent for the first time since 2007 (chart 1). But the source of that tightening is worth dwelling on, because American companies are not competing for credit. The non-financial corporate sector is generating more cash than it spends, and has been for most of the past four years (chart 2). Forecasters have meanwhile spent the summer nudging growth forecasts up and inflation forecasts down for this year, with Taiwan and Korea marked up by some distance the most (chart 3). Britain provided a counterpoint, with pay growth and vacancies both back at or below pre-pandemic norms ahead of the Bank of England’s decision (chart 4). China’s August figures showed industrial output accelerating while investment contracted more deeply (chart 5). And Korean customs data for the first ten days of September gave yet another reading of how much of world trade now runs through a single product (chart 6).
by:Andrew Cates
|in:Economy in Brief
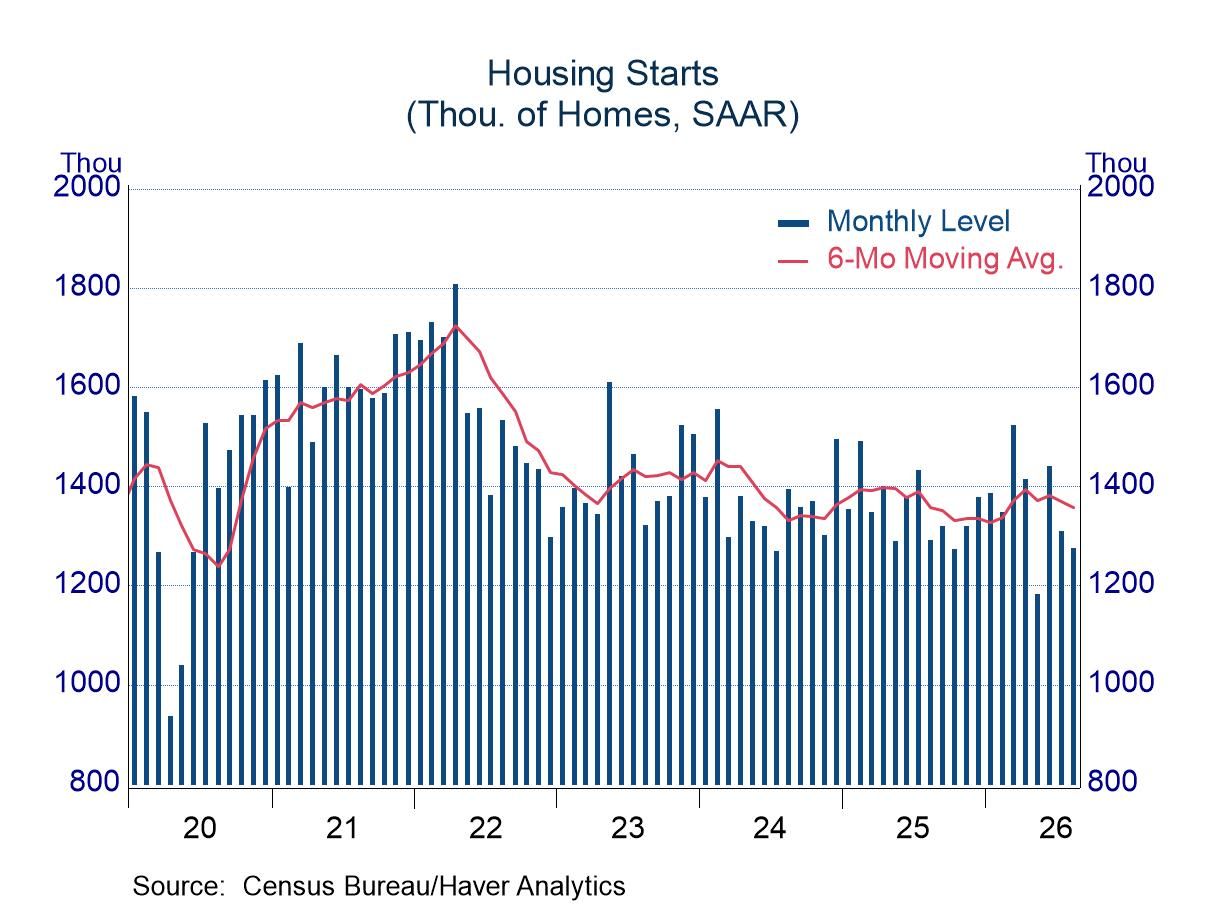
- A drop in multi-family activity in August offset a gain in the single-family sector.
- Q3 shaping up to be another soft quarter for housing.
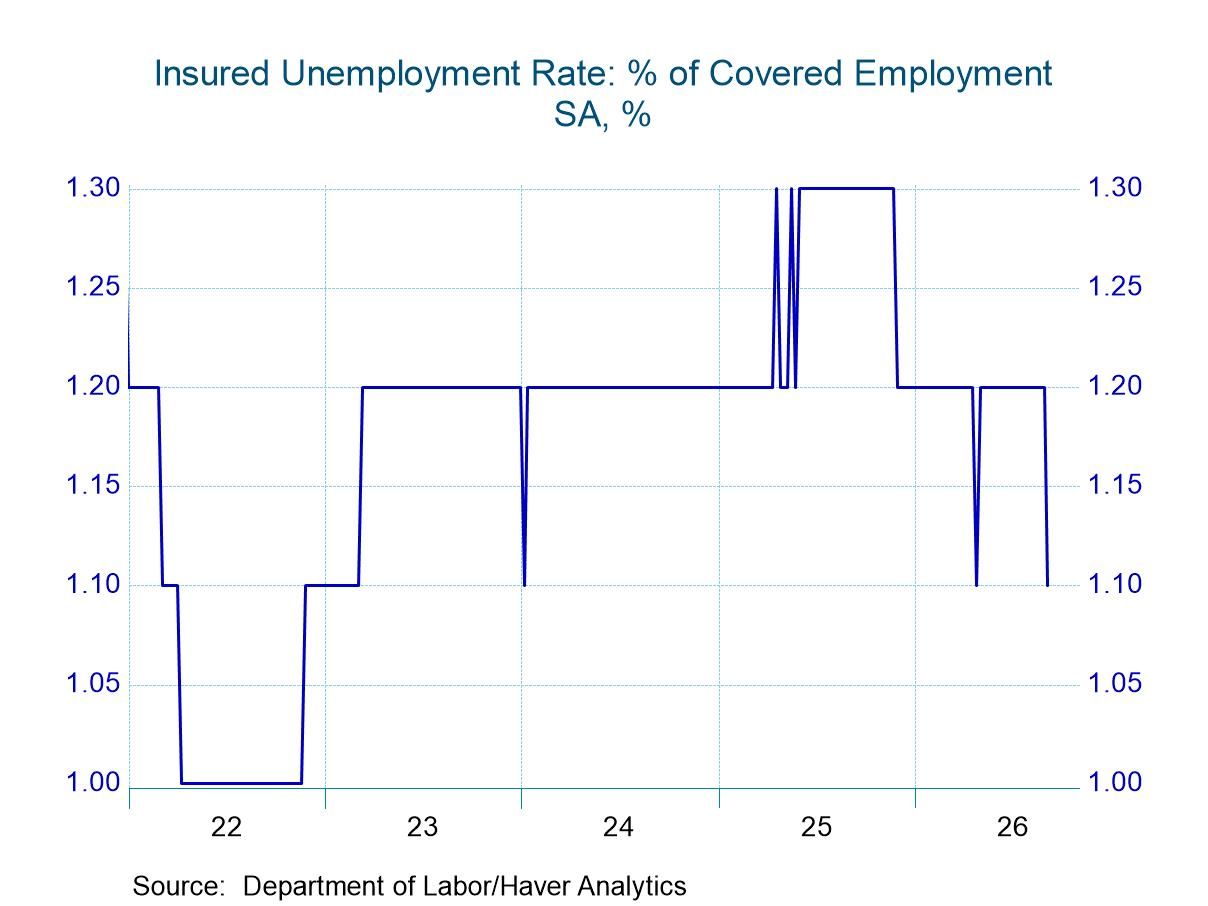
- New claims declined by 10,000 to 196,000 in the week of September 12.
- Continuing claims dropped by 39,000 to 1.730 million in the week ending September 5.
- The insured unemployment rate inched down to 1.1% in the week of September 5, the first drop since April 25.
 Europe| Sep 17 2026
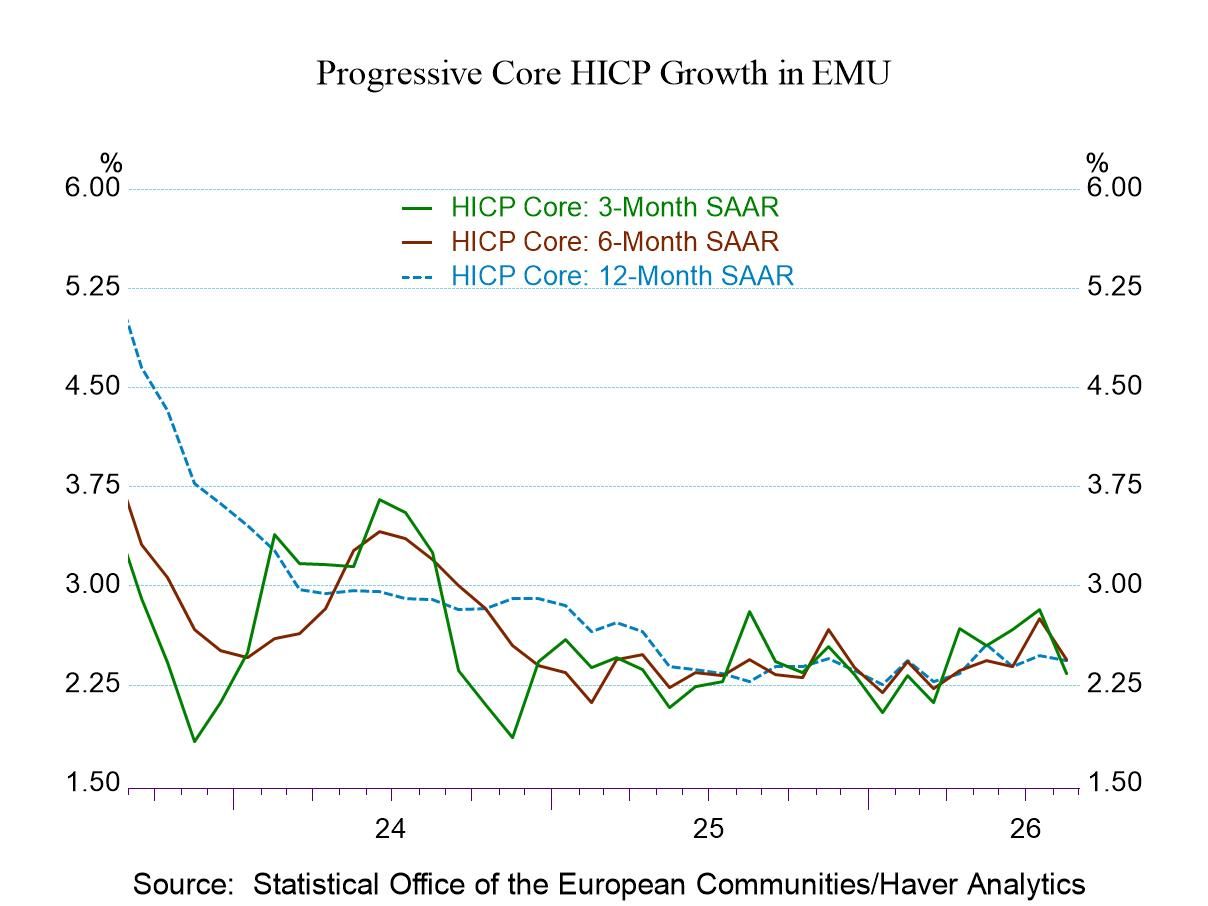
EMU Inflation Pressure Remain over the Top but Not Intensifying
Inflation in the euro area rose by 0.4% in August after gaining 0.5% in July on the heels of a 0.1% decline in June. Sequentially, euro area inflation is up by 3.3% over 12 months, accelerates to a 4.5% annual rate over six months, and then settles back to a 3.4% pace over three months. Inflation is more excessive and stubborn than it is threatening.
Inflation excluding energy and unprocessed food rose a skinny 0.1% in August after a 0.3% gain in July and a 0.1% increase in June. This version of core inflation is up by 2.4% over 12 months and six months and then settles down to a 2.3% annual rate over three months. The ex-food, alcohol & tobacco core measure, similarly posted restrained monthly gains, with a sequential profile matching the ex-energy & ex-unprocessed food progression.
A cautious ECB On balance, headline inflation is too high largely because of energy, and this is not a surprise. However, core inflation is much closer to being in target. Still, it is excessive over 12 months, six months, and three months, but it's not even 1/2 of one percentage point too high at an annualized rate. Still, it is consistently higher by 0.3% to 0.4% on an annual rate. With energy prices flaring, the ECB is being careful.
Inflation pressure is not growing in breadth The details of inflation for the EMU 21-member inflation measure are similar to those headlines in the core inflation progressions. The details on inflation show that inflation is not broadly accelerating. Diffusion measures, which chronicle the proportion of categories with inflation accelerating, showed very restrained sub-50% readings for August and June, even though July’s relatively hotter increase showed inflation accelerating in nearly 85% of the categories. However, that bad-news month was sandwiched in between two good-news months. Looking at inflation over 12 months, six months, and three months, the diffusion progressions step down from 69.2% over 12 months to 53.8% over six months and to 30.8% over three months. Inflation's breadth has been pulling back progressively.
Inflation is consistently accelerating for furnishings, household equipment & maintenance, healthcare, and communications. However, those are the only three categories that show inflation consistently higher over 12 months, six months, and three months. Inflation is consistently lower over those three periods for alcoholic beverages & tobacco and for recreation & culture.
- of164Go to 1 page