 Global| Jul 02 2026
Charts of the Week: Forecasters Hold Firm
by:Andrew Cates
|in:Economy in Brief
Summary
Global financial markets have had a more settled feel this week, reflecting the continued unwinding of the geopolitical risk premium that had built up during the worst of the US-Iran conflict. Oil prices have fallen further, equity markets have been broadly supported, and incoming inflation data — notably the euro area’s June flash CPI estimate — have come in below expectations. The US holiday-shortened week ahead, with Independence Day on Friday, is likely to keep volumes thin and activity subdued. The bigger picture, however, remains one of tension between a more benign near-term inflation trajectory and central banks that may not yet be ready to stand down. In the charts below we look first at what the latest Blue Chip Financial Forecasts (BCFF) survey reveals about the expected change in and timing of policy rates across the major economies (charts 1 and 2), then at the divergence between headline and core inflation across the advanced economies (chart 3), and at what euro area consumers are more specifically expecting about inflation in the period ahead (chart 4). We turn next to Japan and the yen’s slide this week to 40-year lows (chart 5), and finally to the BCFF survey’s special questions on artificial intelligence and asset valuations (chart 6).
Tightening Bias Intact, but Unevenly Distributed The July Blue Chip Financial Forecasts survey's expectations for policy rate changes over the next twelve months reveal a striking divergence across the major advanced economies, as chart 1 below makes clear. Across the board, the rate outlook is higher than it was in late February, before the US-Iran conflict escalated: the energy price shock and its inflationary consequences have left an imprint on the panel's thinking, even as oil prices have since retreated. Japan tops the list with an expected increase of around 40 basis points, reflecting the building pressure on the Bank of Japan to respond to yen weakness and still-elevated domestic inflation. Canada and the euro area also sit firmly in positive territory, with expected increases of around 30 and 20 basis points respectively. The US and the UK, by contrast, are in negative territory — the US barely so, the UK more distinctly, with the panel pencilling in modest rate reductions over the coming year. This pattern is not simply a reflection of where each economy sits in the inflation cycle. It also encodes a judgement about the current stance of monetary policy: in Japan, the euro area and Canada, policy is likely seen as insufficiently tight relative to the inflation challenge, and the conflict has reinforced that view. In the US and UK, by contrast, policy is judged to be closer to or already beyond neutral, meaning the next move is more likely to be an easing than a further tightening — even if, in the US case, that easing has been pushed well into 2027.
Chart 1: Expected Increase/Decrease in Policy Rates over the Next 12 Months

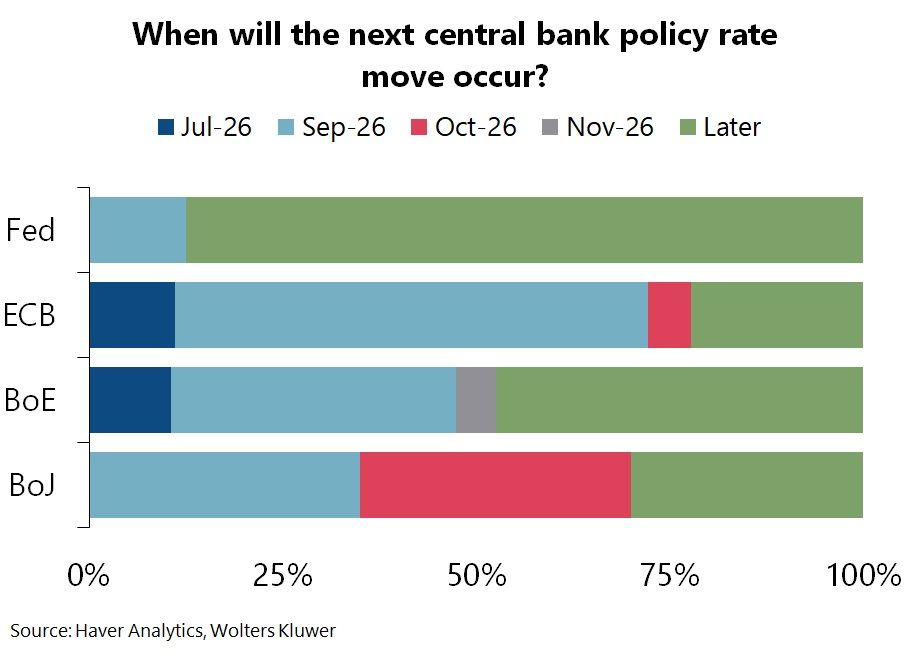
When Will the Next Move Come? Chart 2 below adds a timing dimension to the rate outlook, showing where the BCFF panel currently places the next policy move for the Fed, ECB, Bank of England and Bank of Japan. For the BoJ, the distribution is concentrated around the near term, with a significant share of respondents expecting action in September or October — consistent with the building pressure illustrated in chart 1 and with the BoJ’s next scheduled decision on 31 July. For the ECB, September or later than November emerge as the most likely timing for the next step. The Bank of England panel is more spread, with a meaningful share expecting action to come later. For the Fed, the dominant view places the next move firmly in the ‘later’ category, consistent with the BCFF consensus that the Fed funds rate will hold through the rest of 2026, with a first cut not expected until Q2 2027. Under chair Kevin Warsh, the June FOMC meeting delivered a hawkish dot plot that shifted some participants toward a hike before year-end, but the panel as a whole has not moved that far.
Chart 2: When Will the Next Central Bank Policy Rate Move Occur?
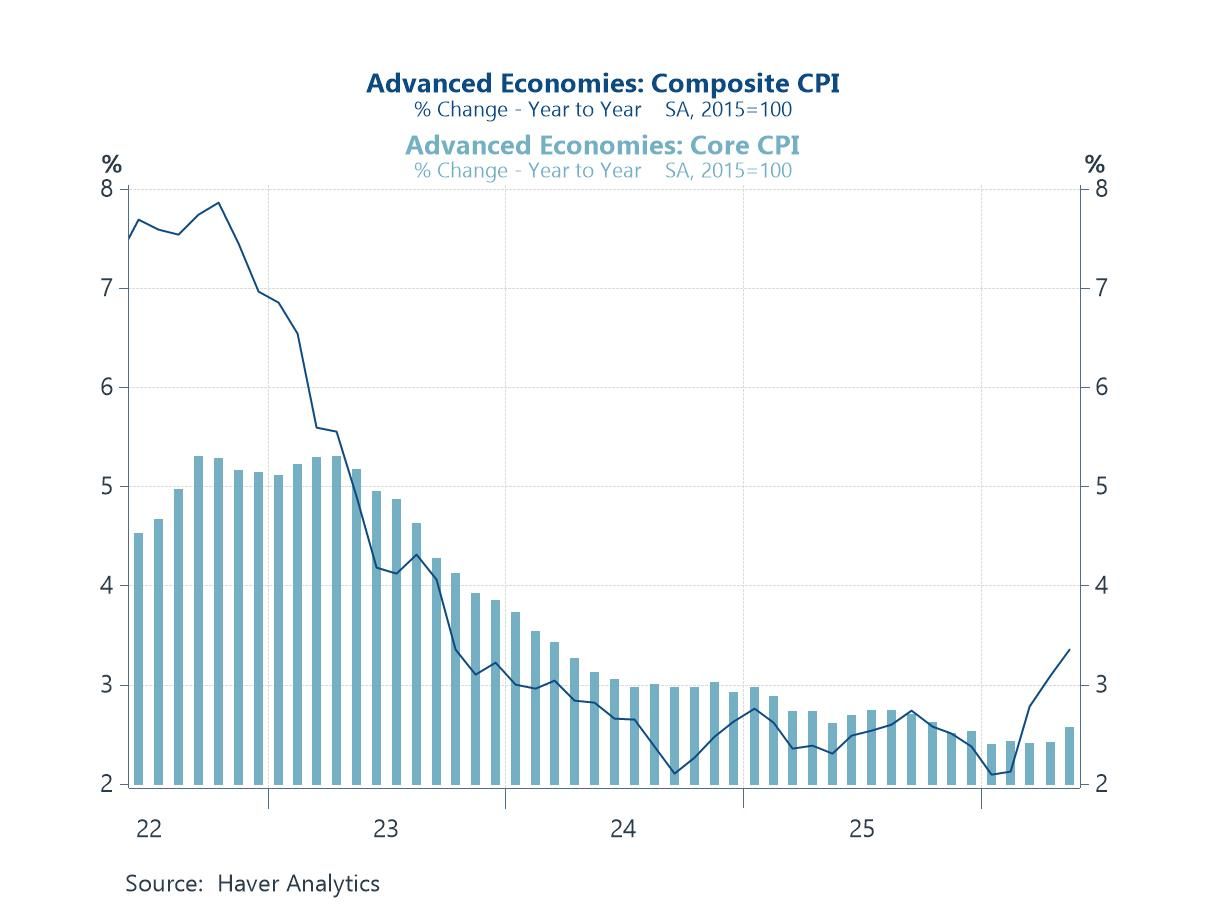
Headline Up, Core Contained: The Inflation Picture Across Advanced Economies One of the more reassuring features of the current inflation episode has been the limited pass-through from energy prices to underlying price dynamics. Across the advanced economies, headline CPI inflation has risen materially since the conflict escalated in March, driven overwhelmingly by consumer energy costs. Core inflation — stripping out food and energy — has edged higher, but only modestly, suggesting that second-round effects remain contained for now. In the United States, the pressures are arguably more alarming, with core PCE rising sharply between February and May to its highest level since October 2023. In the euro area, the focus this week has been firmly on Eurostat's June flash CPI estimate, published yesterday. Headline inflation fell back to 2.8% from a peak of 3.2% in May, as energy costs — the main driver of the surge since the conflict began — eased meaningfully. Crucially, core inflation also ticked down, and services inflation retreated as well. The June data therefore tell a broadly reassuring story: the energy shock is unwinding without leaving a lasting imprint on underlying price dynamics — precisely what the ECB will have been hoping for.
Chart 3: Advanced Economy Headline and Core CPI Inflation
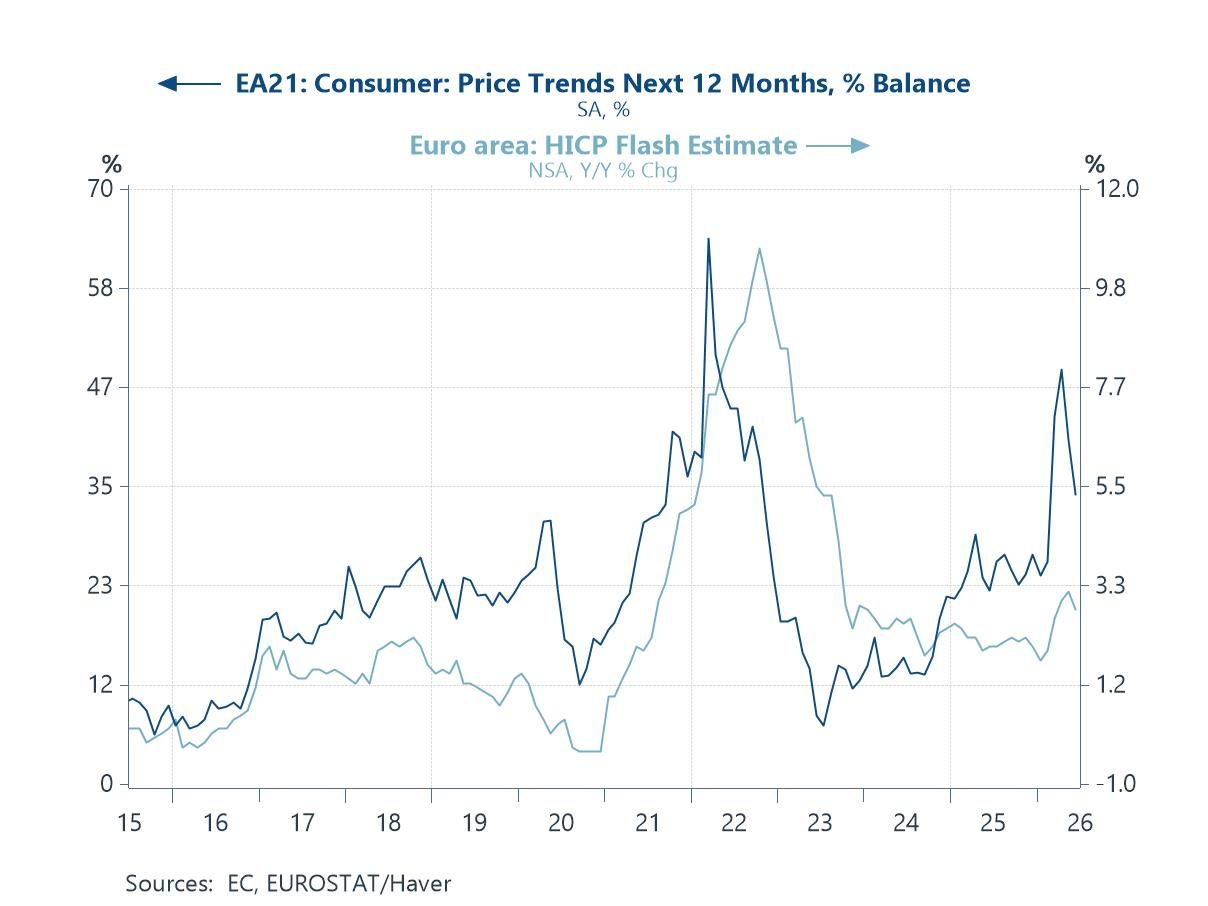
Consumer Price Expectations: Are Households Convinced? The aggregate inflation picture looks relatively contained at the macro level, but whether households are similarly reassured is a separate question. Chart 4 below draws on the European Commission's consumer survey data on price expectations — one of the more timely and widely watched indicators of inflation psychology in the euro area. The survey captures whether consumers expect prices to rise, stay the same or fall over the coming twelve months, and its relationship with actual inflation outturns has historically been close. A sustained elevation in consumer price expectations risks becoming self-fulfilling, feeding into wage demands and pricing behaviour in ways that complicate the ECB's task considerably. The June survey, however, brought an encouraging development: expectations fell steeply, suggesting that households have begun to register the reversal in energy prices and the broader easing of the inflationary impulse. That said, the absolute level of expectations remains elevated relative to the pre-conflict period, and one month's decline does not constitute a trend. Whether the June reading marks the beginning of a sustained normalisation — or proves a temporary dip before expectations re-anchor at a higher level — will be one of the key variables shaping the ECB's decision calculus in the months ahead.
Chart 4: Euro Area Consumer Price Expectations — EC Survey
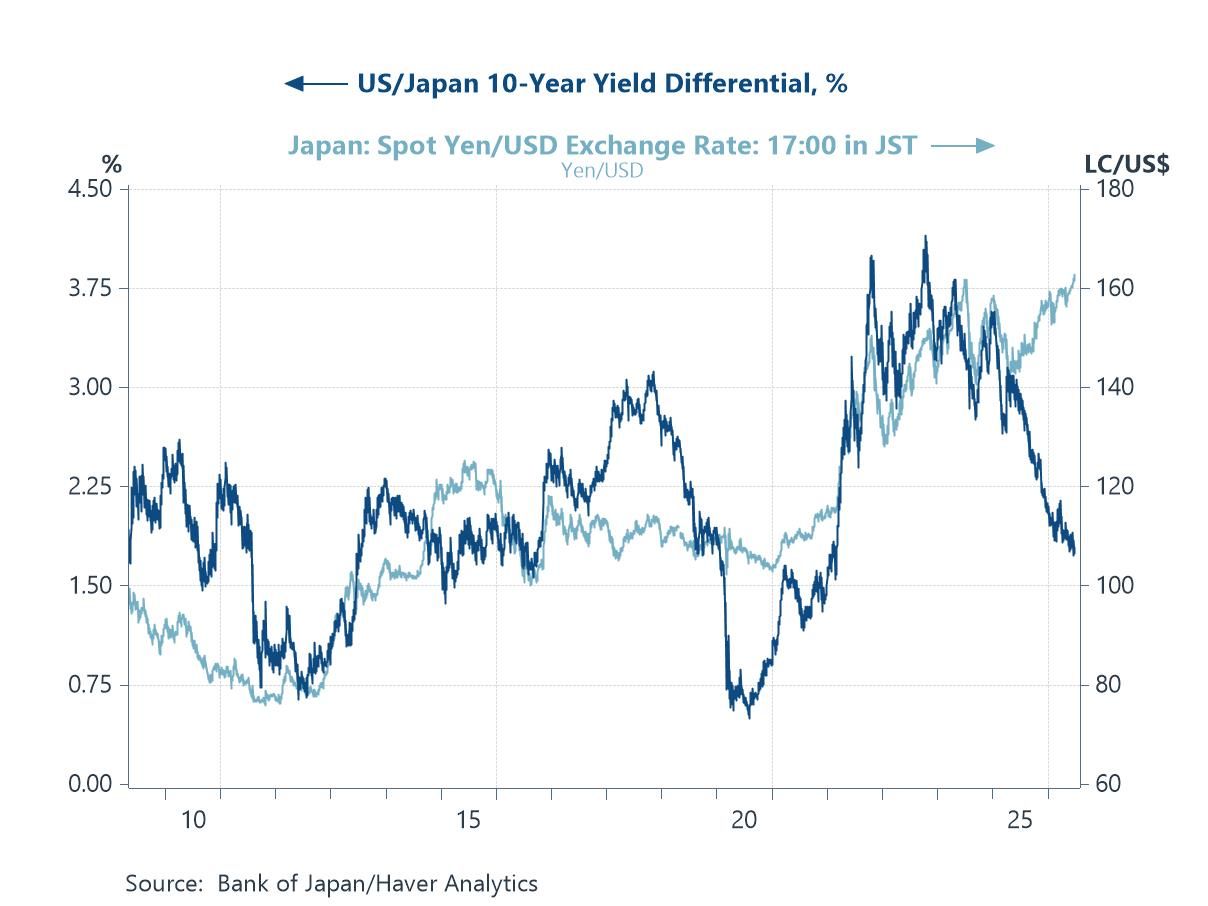
Japan: A Weak Yen at the Worst Possible Time Japan occupies a particularly uncomfortable position in the current global conjuncture. The yen has depreciated to levels not seen since December 1986, with USD/JPY touching 162 this week. The move reflects the persistence of a large interest rate differential: even as the Bank of Japan has continued its gradual tightening, the Fed’s hawkish pivot under chair Kevin Warsh — with the mid-June FOMC dot plot signalling a possible hike before year-end — has reinforced the carry trade dynamics weighing on the currency. For Japan, which imports virtually all of its energy, yen weakness at a time of still-elevated global oil prices is a double burden, amplifying domestic inflation and squeezing real incomes. Verbal warnings from Japan’s Finance Ministry have had only a modest and short-lived effect on the exchange rate. The Bank of Japan’s next policy decision is on 31 July, and the pressure to act more decisively is building. The BCFF panel’s July survey revised upward its expectation for a stronger US dollar against the yen over the coming year — consistent with the fundamental picture that chart 5 below describes.
Chart 5: USD/JPY Exchange Rate — Testing 40-Year Highs
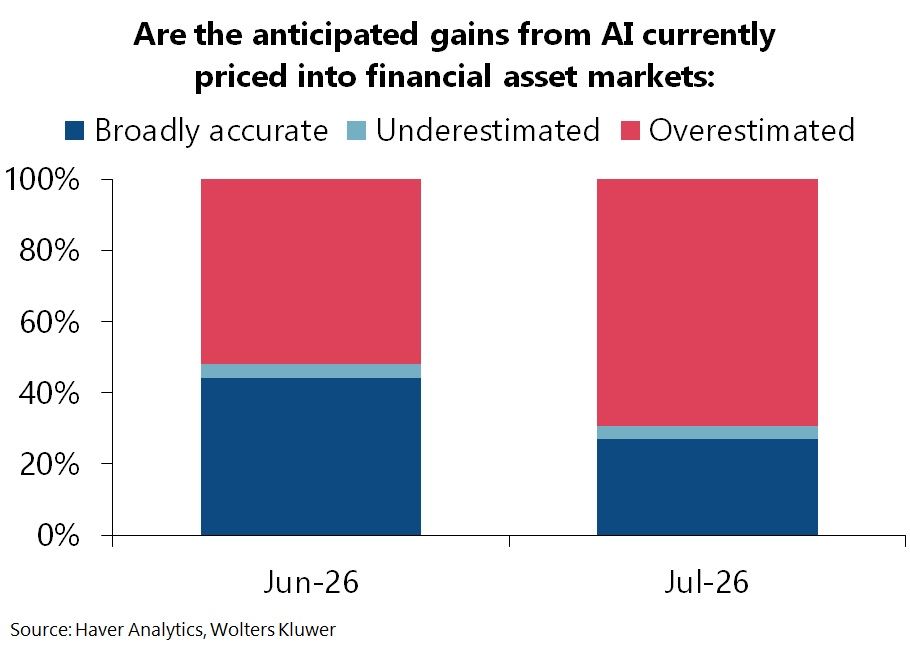
AI: Optimism on the Technology, Scepticism on the Price Returning to the BCFF survey, its special questions reveal a panel that continues to look beyond the current cyclical turbulence toward a longer-horizon structural narrative. On artificial intelligence, respondents are broadly optimistic: 45% expect a noticeable impact on US productivity and growth within one to three years, with a further 45% believing those effects are already becoming evident. That is a striking degree of conviction about a technology whose macro-level productivity impact remains, by most empirical measures, still to fully materialise. Yet the same panellists are considerably more cautious about financial markets than about the technology itself. Nearly all respondents believe that expected AI gains are already fully reflected — or even over-reflected — in current asset prices. Chart 6 below captures this tension. It is a combination — high conviction on transformative potential, high scepticism on current valuations — that has historically been associated with stretched risk premia and vulnerability to disappointment, even where the underlying technology story ultimately proves correct.
Chart 6: BCFF Special Question: AI Productivity Optimism vs Equity Valuation Concerns

Andrew Cates
AuthorMore in Author Profile »Andy Cates joined Haver Analytics as a Senior Economist in 2020. Andy has more than 25 years of experience forecasting the global economic outlook and in assessing the implications for policy settings and financial markets. He has held various senior positions in London in a number of Investment Banks including as Head of Developed Markets Economics at Nomura and as Chief Eurozone Economist at RBS. These followed a spell of 21 years as Senior International Economist at UBS, 5 of which were spent in Singapore. Prior to his time in financial services Andy was a UK economist at HM Treasury in London holding positions in the domestic forecasting and macroeconomic modelling units. He has a BA in Economics from the University of York and an MSc in Economics and Econometrics from the University of Southampton.
More Economy in Brief


