U.S. Trade Deficit Widened Markedly in May
by:Sandy Batten
|in:Economy in Brief
Summary
- The deficit in goods and services widened to $77.6 billion in May from $54.6 billion in April.
- Exports slumped 3.2% m/m, led by an outsized fall in exports of nonmonetary gold and other precious metals.
- Imports increased by 3.3% m/m with increases in each major end-use category.
- The goods deficit widened to $106.5 billion, while the services surplus widened to $28.9 billion.
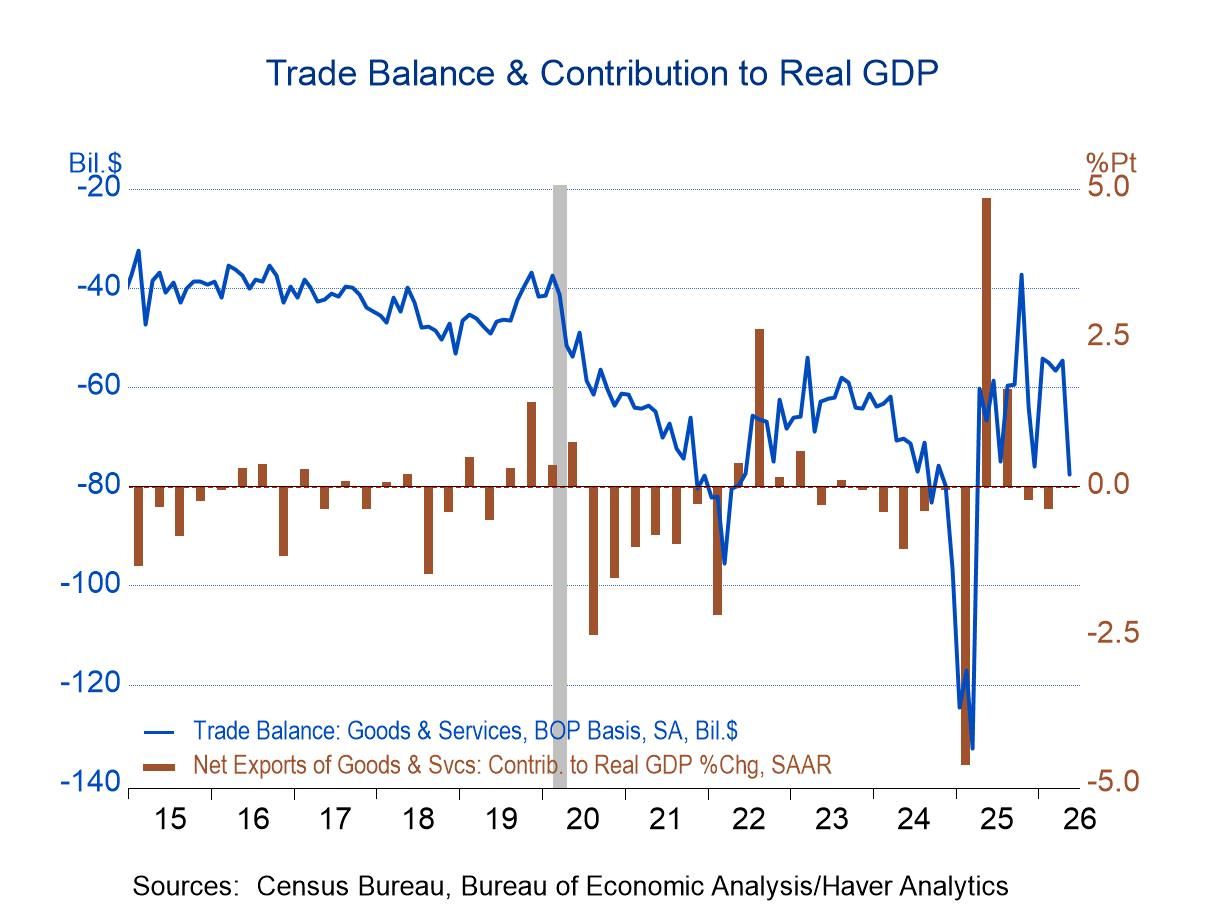
The U.S. trade deficit in goods and services (BOP basis) widened markedly to $77.6 billion in May from a downwardly revised $54.6 billion in April (previously -$55.9 billion), according to the U.S. Census Bureau. The Action Economics Forecast Survey looked for a deficit of $78.6 billion. The goods deficit widened to $106.5 billion in May, the largest monthly shortfall since March 2025 when imports flooded in ahead of expected tariff increases, from a downwardly revised $82.9 billion in April (previously -$83.7 billion) while the services surplus widened to $28.9 billion in May from an upwardly revised $28.3 billion in April (previously +$27.8 billion).
The real (inflation-adjusted) trade deficit in goods widened to $100.0 billion (2017$) in May from an unrevised $84.3 billion in April. The April/May average is considerably higher than the Q1 average although some of this reflects a decline in exports of nonmonetary gold and other precious metals that are not included in the calculation of GDP. Still, the May report implies that net exports will once again subtract from overall GDP growth in Q2. They subtracted 0.37%-point in Q1.
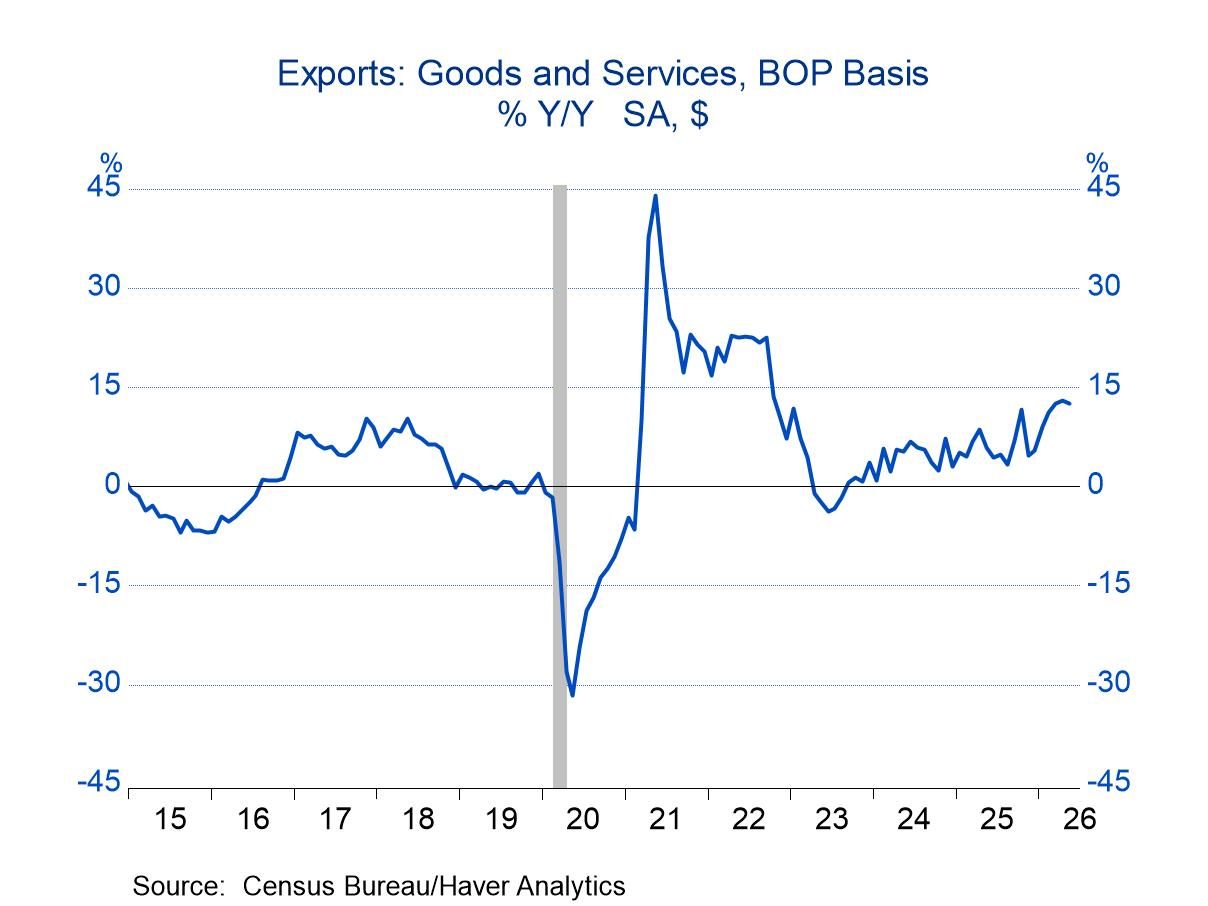
Exports of goods and services fell 3.2% m/m (+12.6% y/y) in May following an upwardly revised 3.0% monthly increase in April (previously +2.6% m/m). This was the first monthly decline in exports since last December. Goods exports (Census basis) slumped 5.3% m/m (+15.1% y/y) led by outsized declines in exports of nonmonetary gold and other precious metals. In dollar terms, goods exports declined $11.6 billion in May. A $7.5 billion decline in exports of nonmonetary gold and other precious metals accounted for 65% of that decline. However, exports of capital goods ex autos (-4.9% m/m) and nonfood consumer goods ex autos exports (-9.1% m/m) were also very weak. Service exports edged up 0.7% m/m (6.6% y/y) in May following a 0.1% monthly rise in April. Travel service exports rebounded 2.4% m/m in May after having declined in both March and April. Transport exports rose 1.1% m/m in May, their third consecutive monthly gain. Over the past three months, transport exports have increased 6.7%.
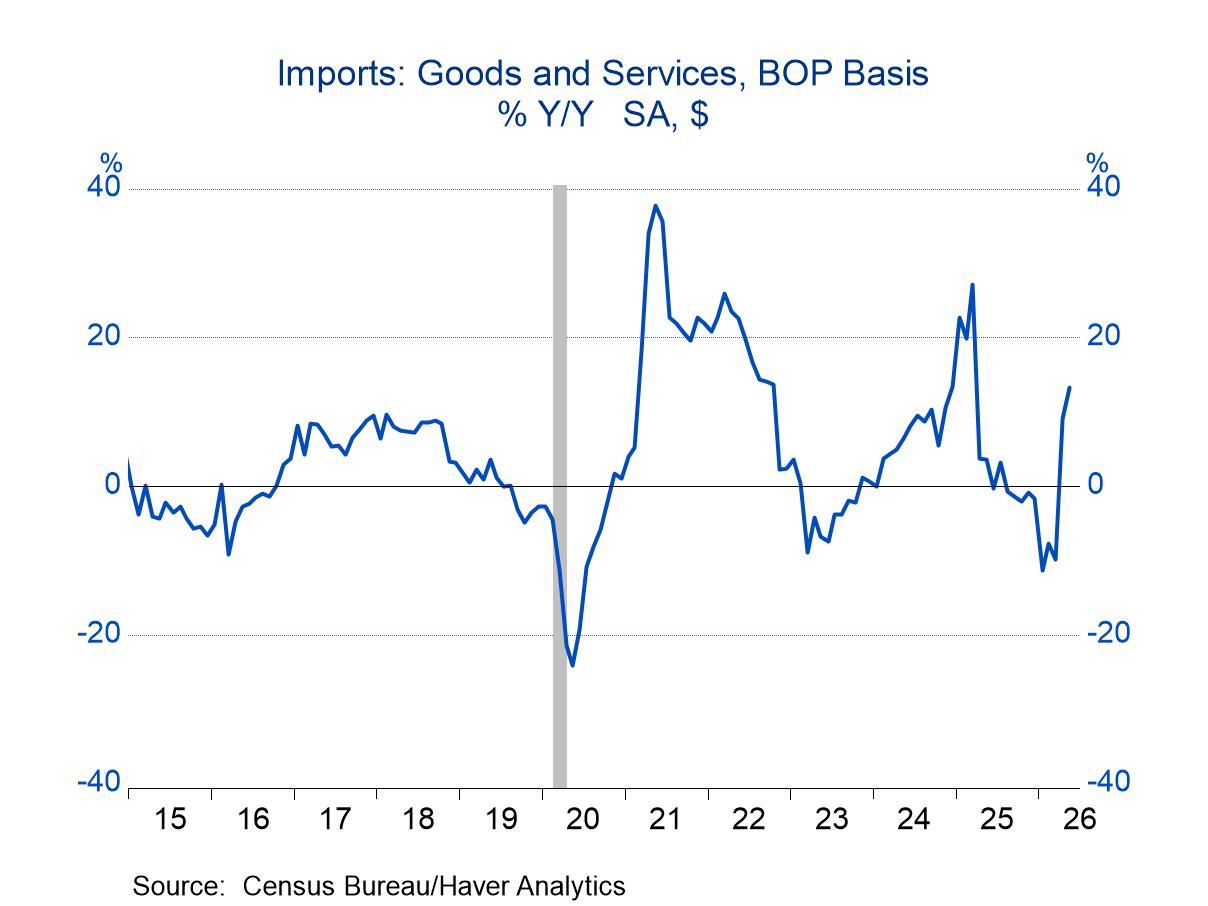
Imports of goods and services increased 3.3% m/m (13.3% y/y) in May for their fourth consecutive monthly gain. Over the four months to May, imports rose 11.7%. Goods imports (Census basis) jumped 4.0% m/m (15.3% y/y) in May after a 1.9% monthly gain in April. Imports rose in every major end-use category in May, led by a 10.3% m/m jump in “other” imports, a 6.3% m/m rise in auto imports, a 6.2% m/m increase in nonfood consumer goods imports ex autos, and a 5.8% m/m rise in industrial supplies imports. Service imports increased 0.3% m/m (5.1% y/y) in May, slowing from a 1.6% monthly gain in April. Performance varied meaningfully across end-use categories. Imports of insurance services rose 1.4% m/m, their sixth consecutive monthly rise. Imports of personal and recreational services increased 1.1% m/m in May. Imports of financial services rose 0.6% m/m. By contrast, imported maintenance and repairs services slumped 3.9% m/m, their second monthly decline in the past three months. Imported intellectual property fell 0.3% m/m, their fourth monthly decline in the past five months. Imports of transport services declined 0.4% m/m, their fourth monthly decrease in the past five months.
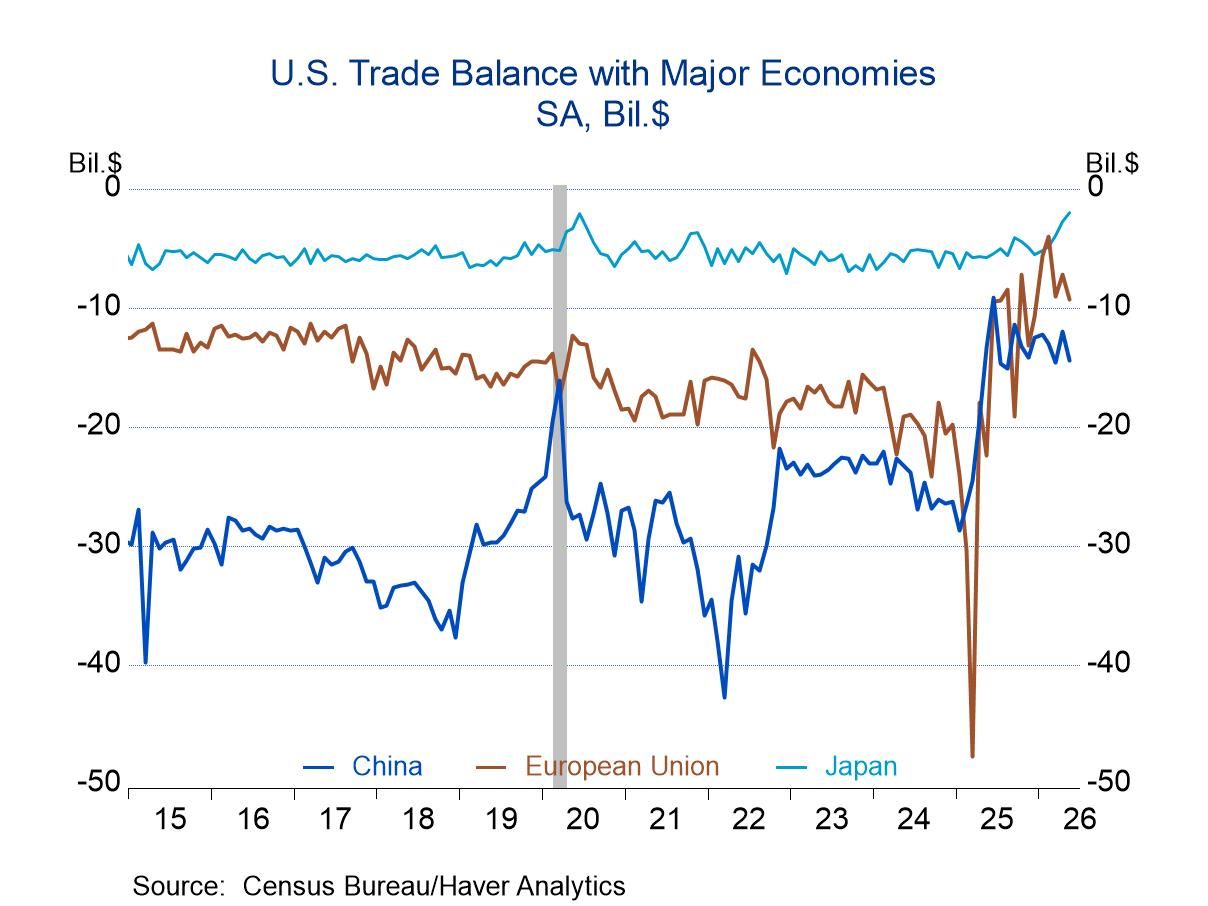
By country, the goods trade deficit with China widened to $14.5 billion in May from $12.0 billion in April. The trade deficit with the European Union widened to $9.3 billion in May from $7.2 billion in April. The trade deficit with Japan declined to $2.0 billion in May from $2.8 billion in April.
The international trade data can be found in Haver’s USECON database. Detailed figures on international trade are available in the USINT and USTRADE databases. The expectations figures are from the Action Economics Forecast Survey in AS1REPNA.

Sandy Batten
AuthorMore in Author Profile »Sandy Batten has more than 30 years of experience analyzing industrial economies and financial markets and a wide range of experience across the financial services sector, government, and academia. Before joining Haver Analytics, Sandy was a Vice President and Senior Economist at Citibank; Senior Credit Market Analyst at CDC Investment Management, Managing Director at Bear Stearns, and Executive Director at JPMorgan. In 2008, Sandy was named the most accurate US forecaster by the National Association for Business Economics. He is a member of the New York Forecasters Club, NABE, and the American Economic Association. Prior to his time in the financial services sector, Sandy was a Research Officer at the Federal Reserve Bank of St. Louis, Senior Staff Economist on the President’s Council of Economic Advisors, Deputy Assistant Secretary for Economic Policy at the US Treasury, and Economist at the International Monetary Fund. Sandy has taught economics at St. Louis University, Denison University, and Muskingun College. He has published numerous peer-reviewed articles in a wide range of academic publications. He has a B.A. in economics from the University of Richmond and a M.A. and Ph.D. in economics from The Ohio State University.
More Economy in Brief
 Asia
Asia