U.S. Payroll Employment Gains Smaller than Expected in June
by:Sandy Batten
|in:Economy in Brief
Summary
- U.S. nonfarm payrolls increased 57,000 in June with meaningful downward revisions to both April and May.
- The market consensus looked for a 115,000 increase.
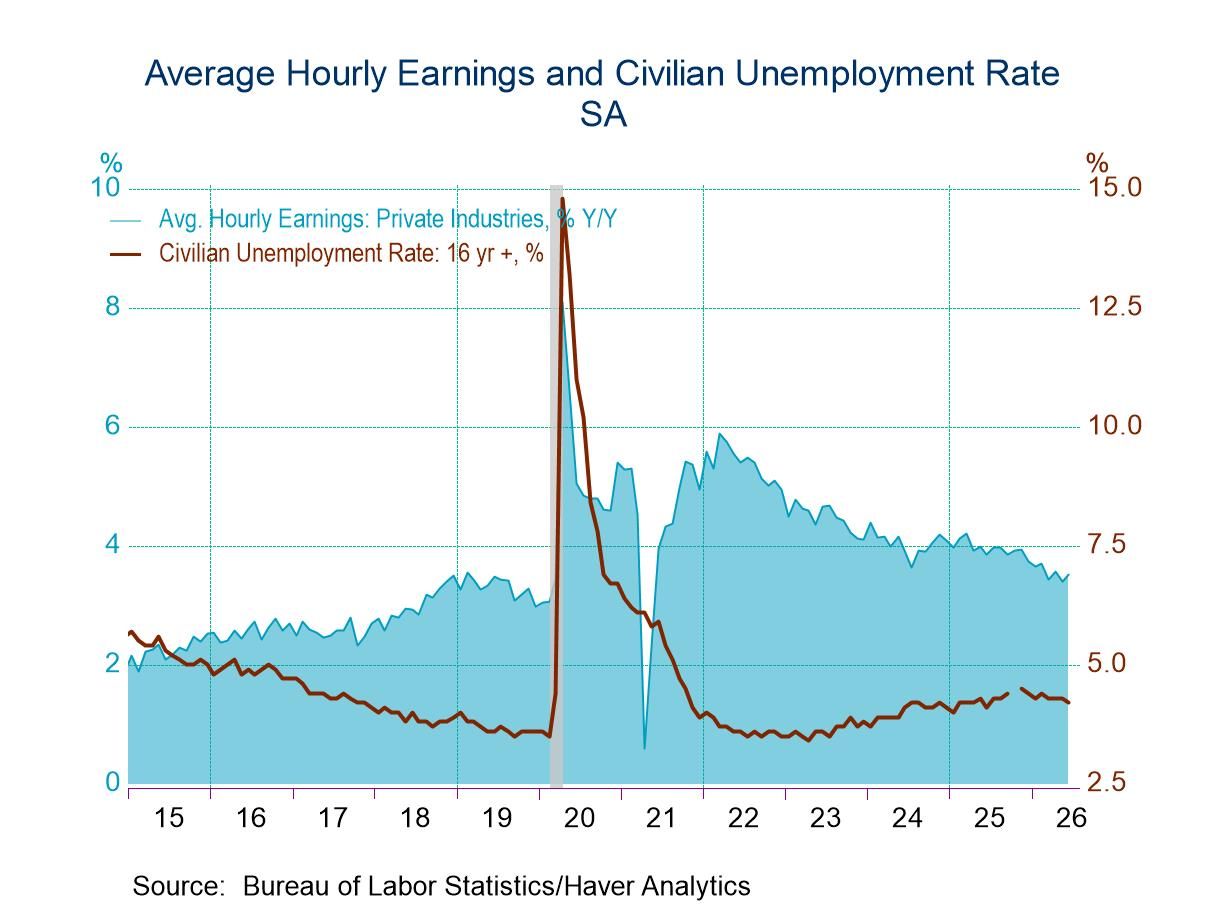
- The unemployment rate edged down to 4.2% from 4.3%, due mostly to a large decrease in the labor force.
- Average hourly earnings rose 0.3% m/m (3.5% y/y), in line with expectations.

The luster fell a bit off the employment rose in June with nonfarm payrolls rising 57,000 against expectations of a 115,000 increase, according to today’s report from the Bureau of Labor Statistics. Moreover, the increases previously reported for April and May were revised down by a total of 74,000. Upon revision, payrolls increased 148,000 in April versus 179,000 previously reported and rose 129,000 in May versus 172,000 previously reported. The average increase over the past three months fell to 111,000 from 164,000 in May while the average increase over the past six months rose to 92,000 in June, its highest reading since February 2025, from 80,000 in May. Both remain on a modest uptrend and much stronger than payroll gains last year. In 2025, monthly payroll gains averaged only 10,000.
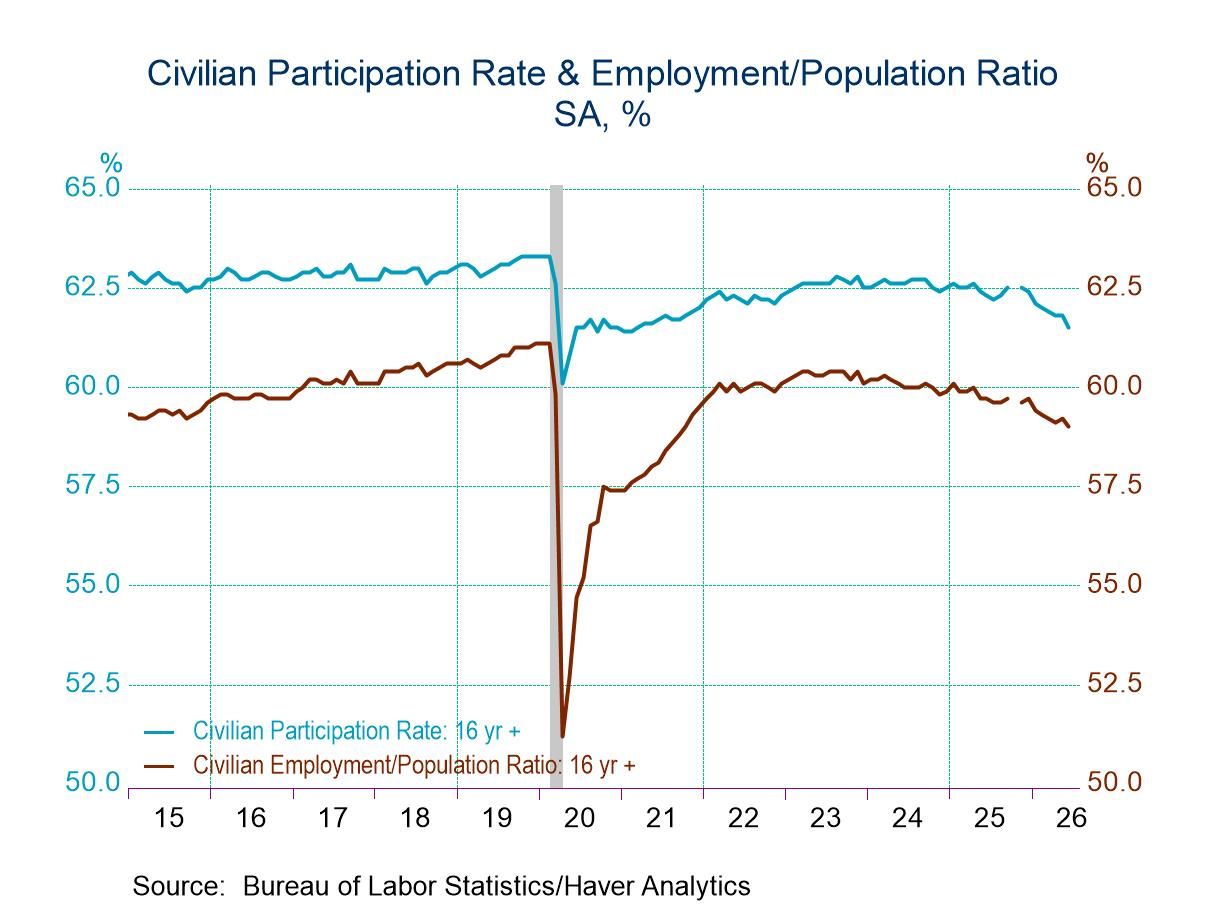
The weaker-than-expected payroll report was reinforced by a weak report from the household survey. While the number of unemployed fell 213,000 and the unemployment rate edged down to 4.2% from 4.3% in May, the number of employed slumped 507,000 in June, the largest monthly decline since May 2025 (with population adjustment to January 2026). The labor force plunged 720,000 with the labor force participation rate falling to 61.5%, its lowest level since March 2021.
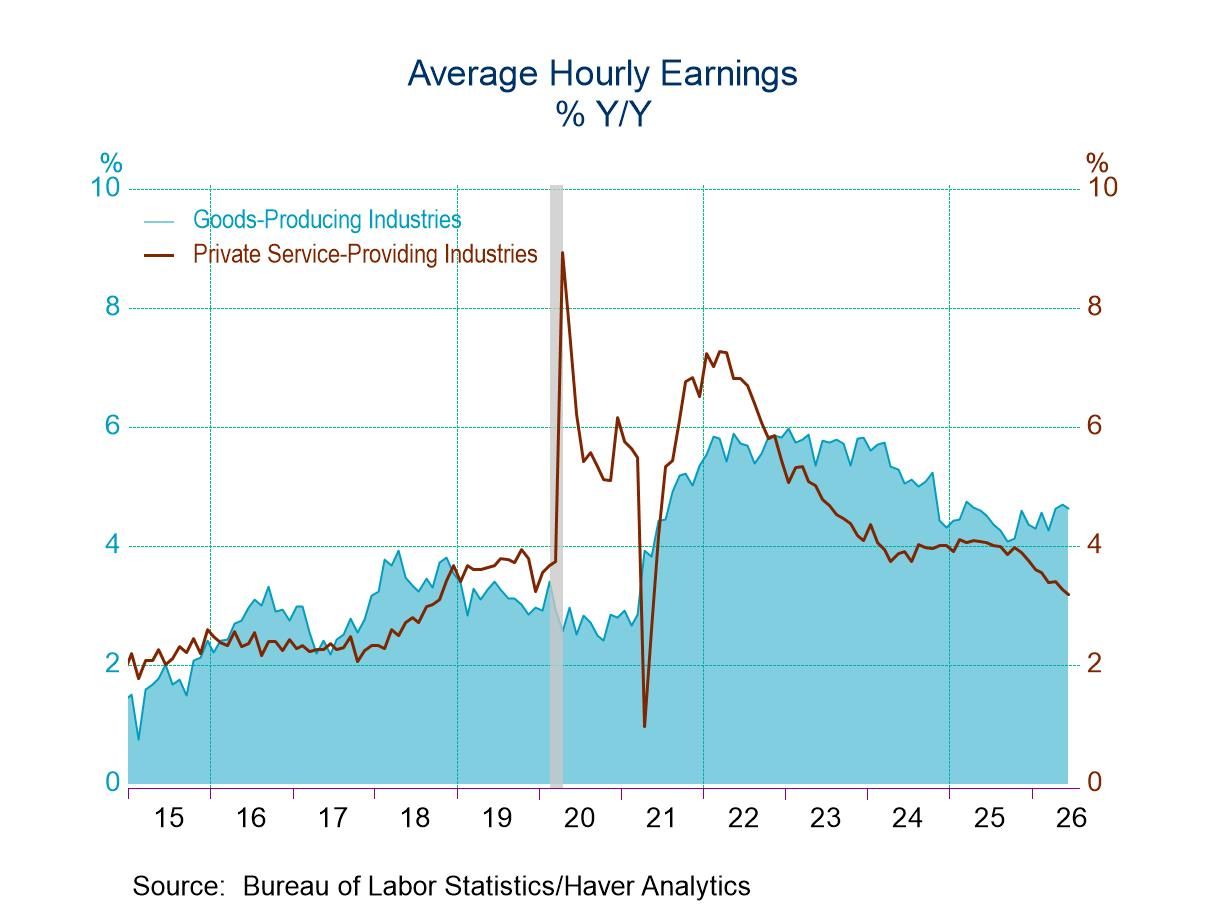
Growth of average hourly earnings (AHE), a key variable for the Federal Reserve, was relatively well behaved in June. AHE increased 0.3% m/m, the same monthly gain as in May, in line with expectations. The y/y rate of advance edged up to 3.5% in June from 3.4% in May. Wage growth in private services-producing firms picked up in June, rising 0.4% m/m (3.4% y/y) versus 0.2% m/m (3.2% y/y) in May. Goods-producing wages increased 0.2% m/m in June after 0.3% monthly gains in both April and May with the y/y rate holding at 4.1%.
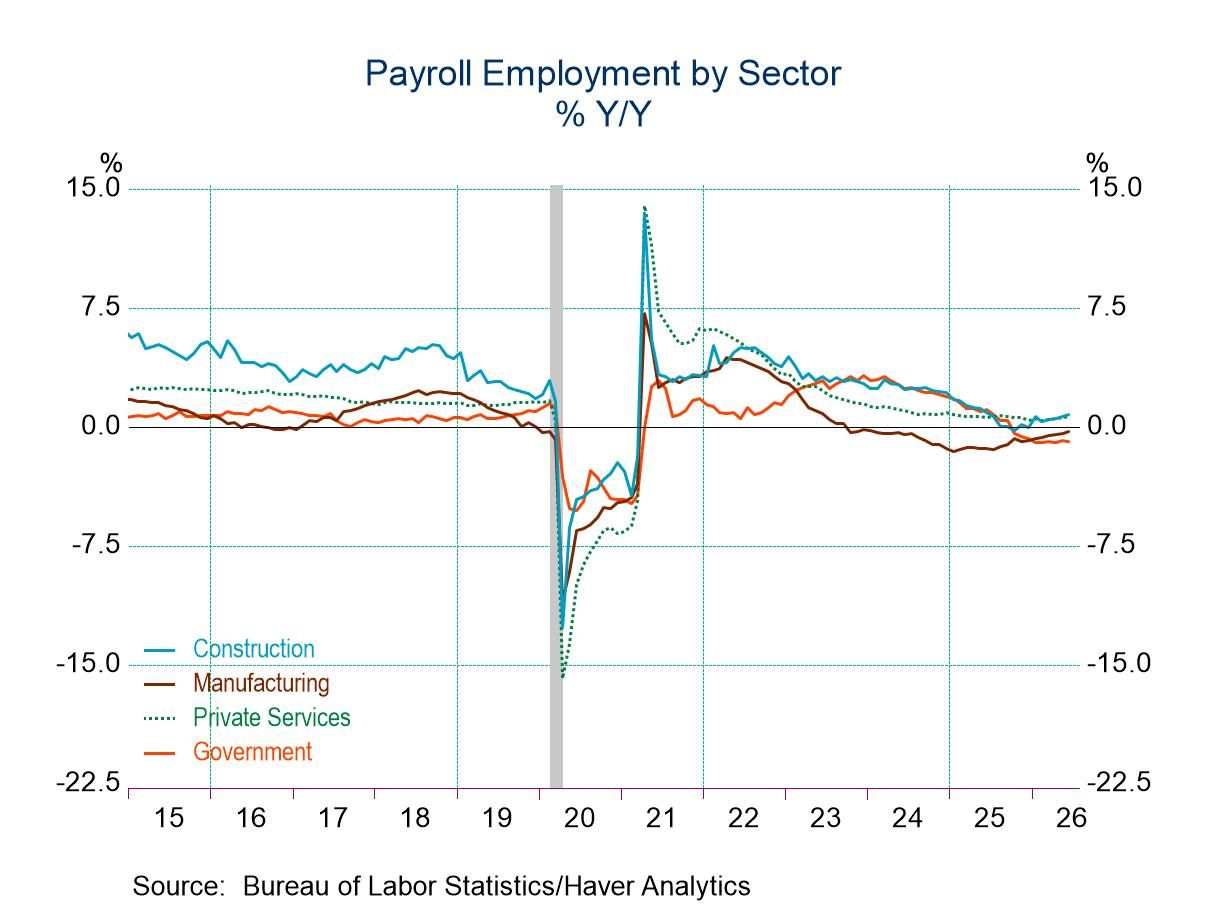
In the establishment survey, private-sector employment was also weaker than expected in June, increasing only 49,000 against an expected 115,000 increase. Moreover, April and May figures were also revised down by a total of 50,000. Government employment rose 8,000 following a 32,000 increase in May. Private goods-producing employment increased 10,000, its largest monthly gain in three months with an 11,000 gain in construction and a 3,000 rise in manufacturing jobs, the first increase in three months. In contrast, services-producing employment increased only 39,000 in June, its weakest monthly performance in four months. Private education and health services jobs posted another solid gain of 69,000, up from 45,000 in May. However, retail jobs fell 7,500, their first monthly decline in four months, and leisure and hospitality jobs slumped 61,000, their largest monthly decline since December 2020, after increasing 40,000 in May. There had been speculation in the market that the World Cup would generate additional leisure and hospitality jobs, but this obviously failed to pan out. On a brighter note, although the one-month payroll diffusion index, a measure of the breadth of job gains, slipped to 54.4 in June from 56.0 in May, it remained well above the key 50 level that indicates that more industries were adding jobs than losing them.
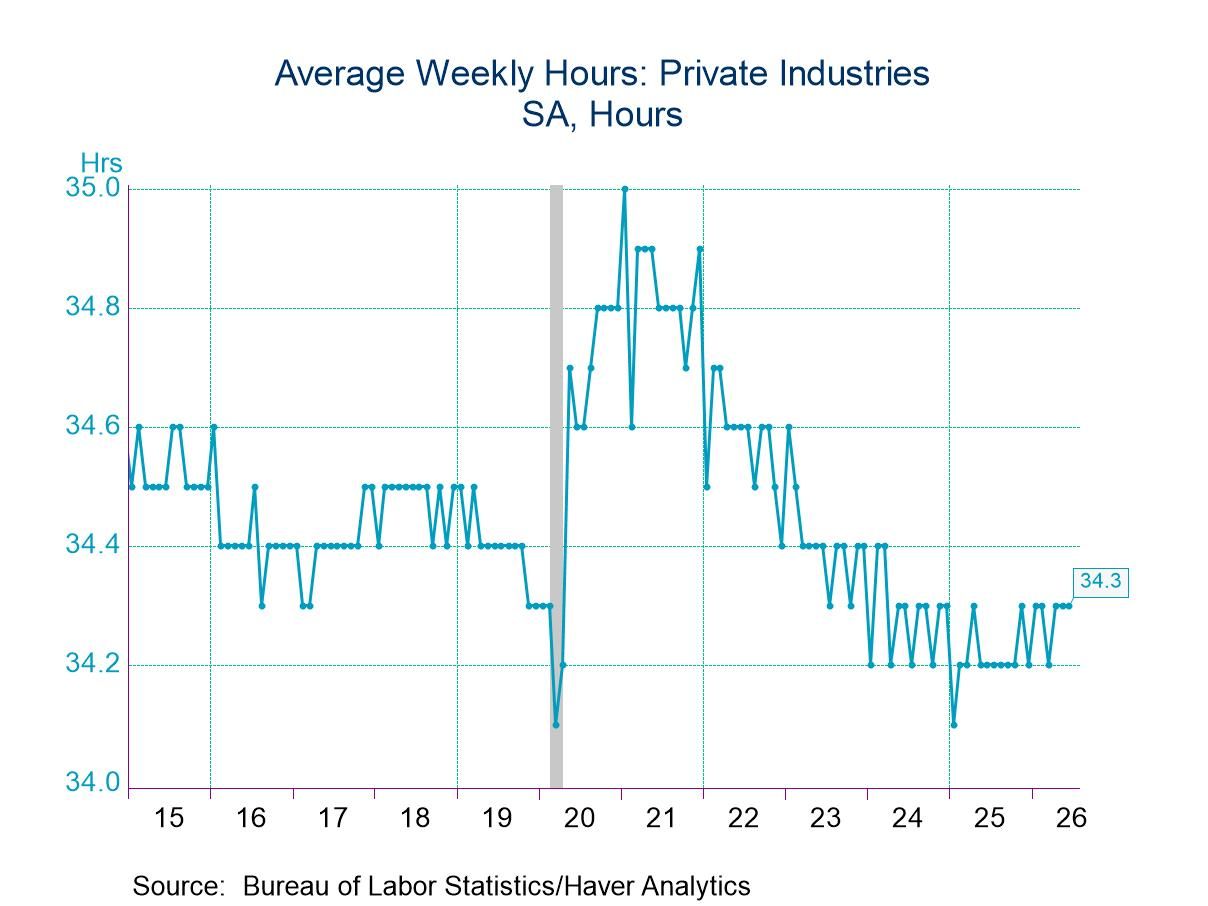
The length of the workweek was unchanged at 34.3 hours in June with the aggregate weekly hours index edging up 0.1% m/m, the same monthly gain as in May. The aggregate hours index rose 1.3% q/q saar in Q2, the fastest quarterly gain in four quarters, providing a solid base for Q2 real GDP growth. The goods-producing workweek was unchanged at 40.1 hours, the highest since January 2023, while the private service-producing workweek edged down to 33.2 hours from 33.3 hours in May.
The employment and earnings data are collected from surveys taken each month during the week containing the 12th day of the month. The labor market data are contained in Haver's USECON database. Detailed figures are in the EMPL and LABOR databases. The expectations figures are in the AS1REPNA database.

Sandy Batten
AuthorMore in Author Profile »Sandy Batten has more than 30 years of experience analyzing industrial economies and financial markets and a wide range of experience across the financial services sector, government, and academia. Before joining Haver Analytics, Sandy was a Vice President and Senior Economist at Citibank; Senior Credit Market Analyst at CDC Investment Management, Managing Director at Bear Stearns, and Executive Director at JPMorgan. In 2008, Sandy was named the most accurate US forecaster by the National Association for Business Economics. He is a member of the New York Forecasters Club, NABE, and the American Economic Association. Prior to his time in the financial services sector, Sandy was a Research Officer at the Federal Reserve Bank of St. Louis, Senior Staff Economist on the President’s Council of Economic Advisors, Deputy Assistant Secretary for Economic Policy at the US Treasury, and Economist at the International Monetary Fund. Sandy has taught economics at St. Louis University, Denison University, and Muskingun College. He has published numerous peer-reviewed articles in a wide range of academic publications. He has a B.A. in economics from the University of Richmond and a M.A. and Ph.D. in economics from The Ohio State University.
More Economy in Brief

 Global

