

U.S. Empire State Manufacturing Index Surprises to the Upside in August, Highest Since Dec. ’21
Summary
- General Business Conditions Index up 5.0 pts. to 20.6 in Aug.; fifth straight expansion.
- New orders (17.3) down 4.9 pts. and shipments (11.7) down 12.7 pts. from a four-year high, both still indicating expansion.
- Unfilled orders (15.5), highest since Apr. ’22; inventories (-5.2), first contraction since Jan.
- Employment (9.3), a three-month low following July’s highest level since Dec. ’22.
- Prices paid (58.6) up 6.3 pts. from July; prices received (22.7), a four-month low.
- Firms remaining optimistic: Future Business Conditions Index up to 32.1, a three-month high; future prices paid rising to 57.7 from a four-month low.
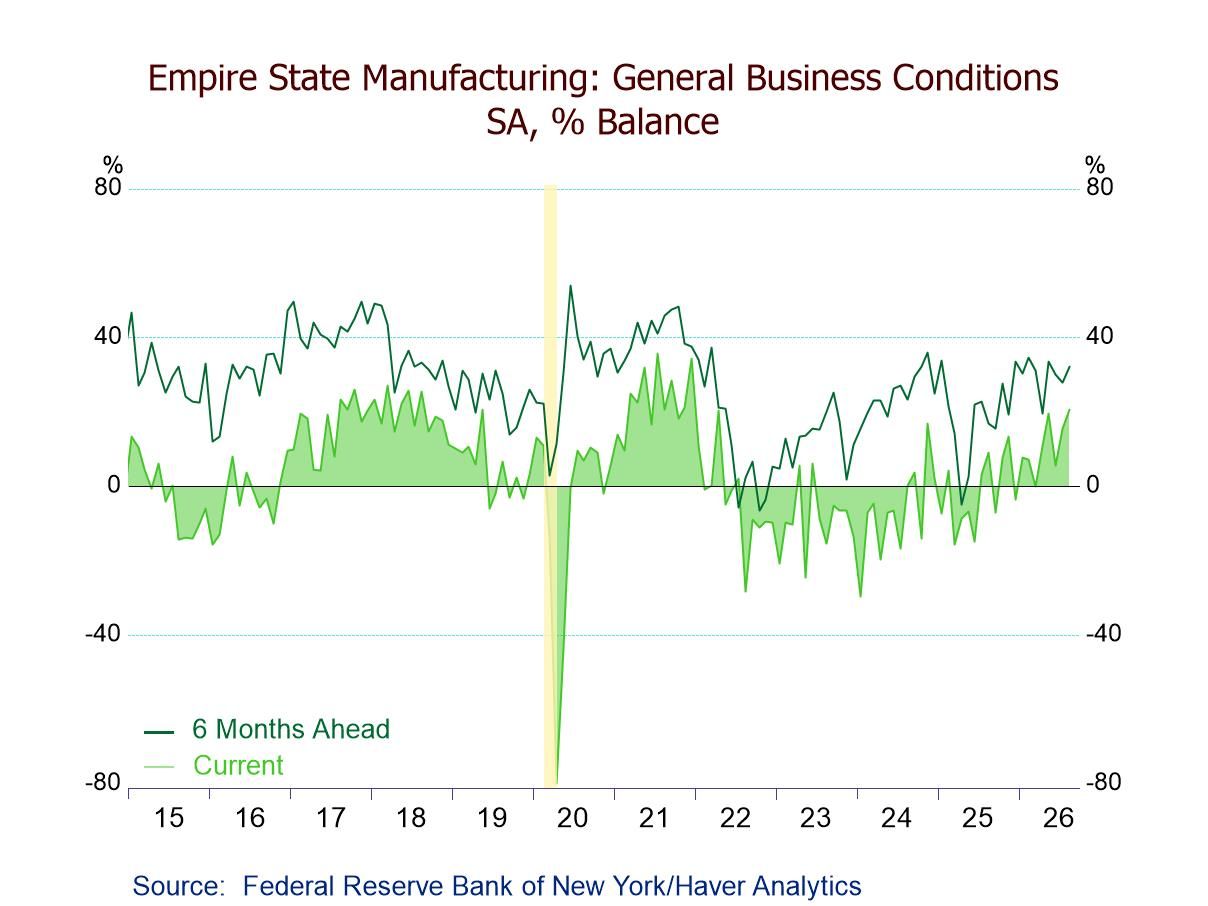
The Empire State Manufacturing Index of General Business Conditions unexpectedly rose to 20.6 in August following a 9.9-point rebound to 15.6 in July, according to the Empire State Manufacturing Survey released by the Federal Reserve Bank of New York. A reading of 10.0 for August had been expected in the Action Economics Forecast Survey. The positive August figure indicated that business activity in New York State expanded for the fifth consecutive month and at the fastest pace since December 2021; it was a sharp improvement from 9.1 in August 2025 and a low of -29.7 in January 2024. The percentage of respondents reporting an increase in general business conditions was 43.8% in August, up from 39.0% in July; the percentage reporting a decrease was 23.1%, down from July’s 23.4%. The latest survey was conducted between August 3 and August 10.
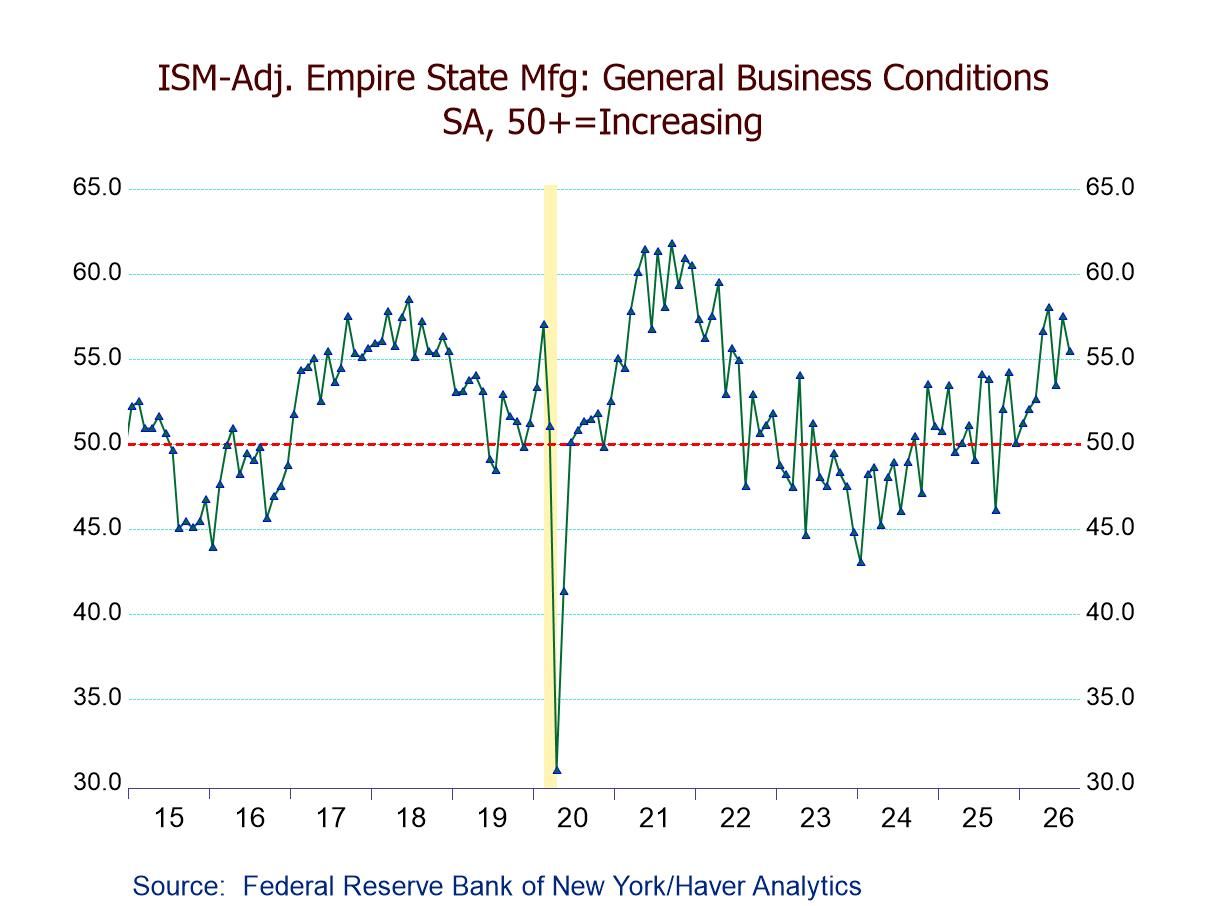
The headline index reflects the answer to a single question concerning the state of economic activity and is not calculated from the components. Haver Analytics calculates a composite index from the five major components, which is comparable to the ISM manufacturing index. This calculated index declined to 55.4 in August following a 4.1-point gain to 57.5 in July, representing the eighth straight expansion but at a slightly slower pace; it was modestly up from 53.8 in August 2025 and well above a low of 43.0 in January 2024. The index is the average of five diffusion indexes: new orders, shipments, employment, supplier deliveries and inventories, with equal weights (20% each).
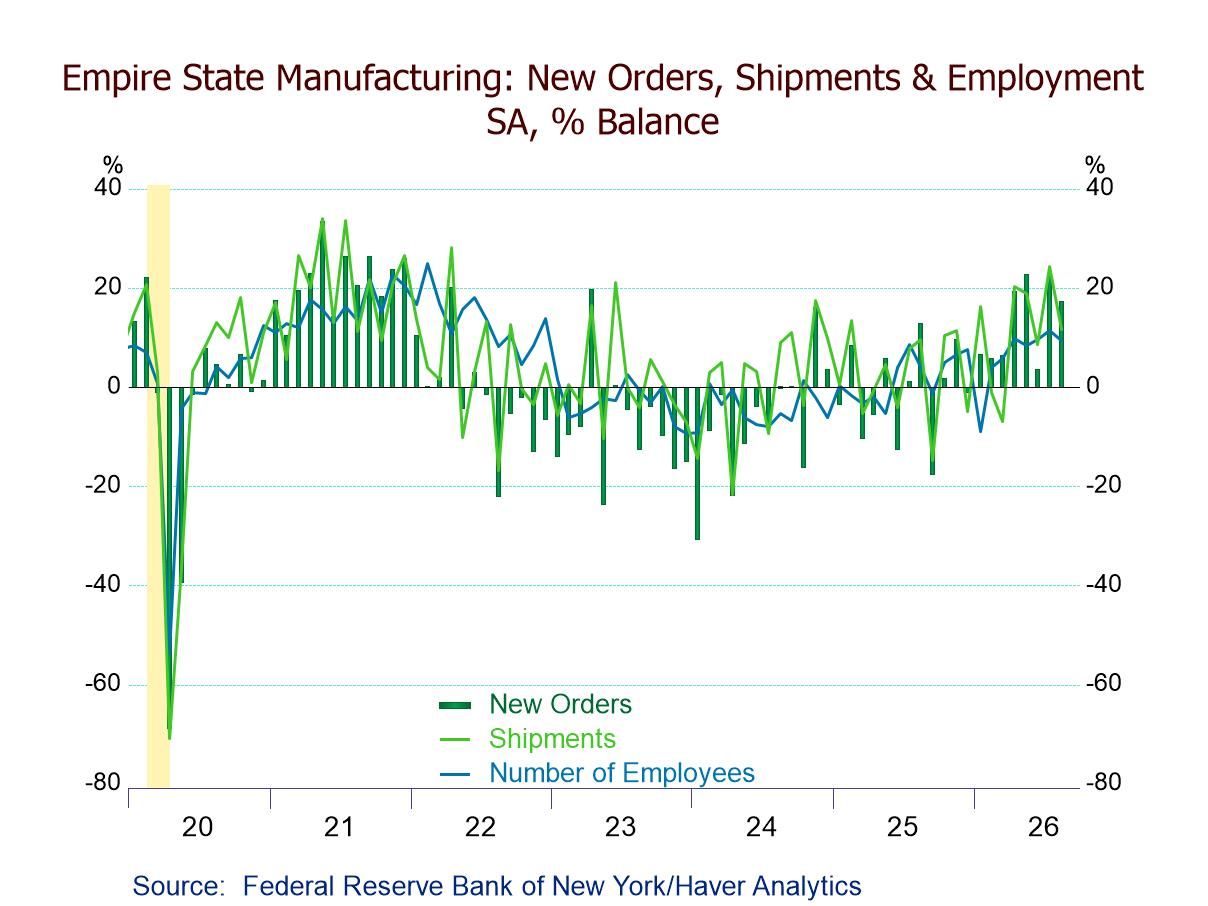
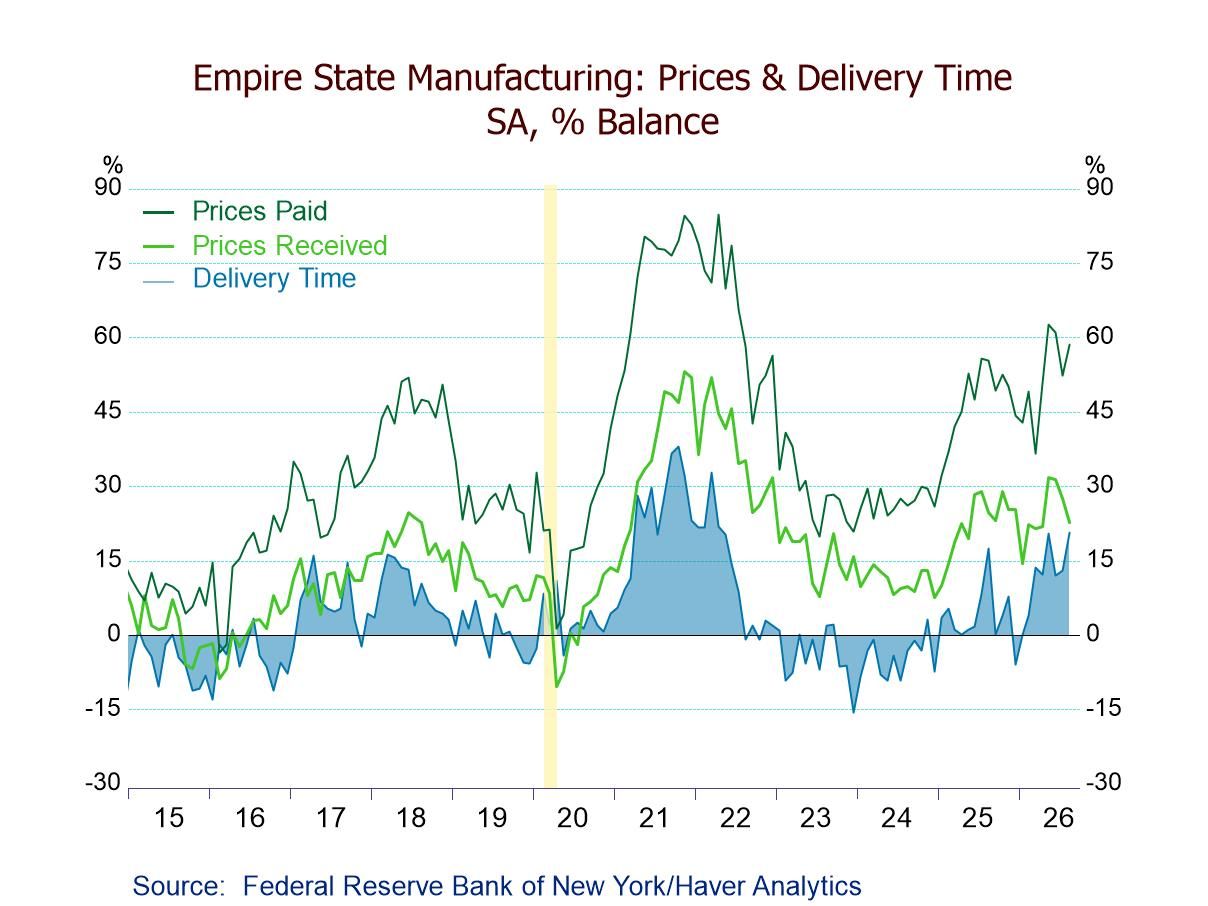
In the latest survey, the new orders index fell to 17.3 in August after an 18.7-point jump to 22.2 in July, marking the eighth consecutive expansion but at a slower pace; it was a sharp improvement from a low of -30.7 in January 2024 but a decline from a high of 19.6 in April 2023. The shipments index dropped to 11.7 in August following a 15.8-point recovery to 24.4 in July, representing the fifth successive expansion; it was well above a low of -21.7 in April 2024 but below a high of 21.0 in June 2023. The unfilled orders index jumped to 15.5 in August after holding at 5.0 in July and June, indicating unfilled orders expanded for the seventh straight month and at the highest level since April 2022; the index reached a low of -24.2 in January 2024. The inventories index fell to -5.2 in August following a 4.0-point increase to 4.0 in July, signaling inventories contracted for the first time since January and at the lowest level since August 2025. Meanwhile, the delivery times index rose to 20.6 in August, the highest reading since April 2022, from 13.0 in July, with 26.8% of respondents reporting longer delivery times and 6.2% reporting shorter times, indicating that delivery times continued to lengthen substantially.
On the labor front, the number of employees index decreased to 9.3 in August after a 1.8-point increase to 11.4 in July (the highest level since December 2022), indicating that employment expanded for the seventh consecutive month but at the slowest rate since May. The index remained well above a low of -9.3 in December 2023 but below a peak of 24.9 in February 2022. In August, 14.8% of respondents reported an increase in employment while 5.5% reported a decline. The average workweek index rebounded to 6.9 in August, a three-month high, from 2.8 in July (the lowest level since March), remaining positive for the seventh successive month.
Inflation pressures remained elevated in August. The prices paid index rose to 58.6 in August after an 8.7-point drop to 52.3 in July. The index was above a low of 25.9 in December 2024 and a low of 20.8 in December 2023, albeit remaining well below a peak of 84.9 in April 2022. In August, 59.4% of respondents reported higher prices paid while only 0.8% reported lower prices paid. The prices received index slid to 22.7 in August, a four-month low, from 27.6 in July. The index was above a low of 7.5 in December 2024 and a low of 7.7 in July 2023 but far below a high of 51.9 in March 2022. In August, 26.6% of respondents reported higher prices received while 3.8% reported lower prices received.
Firms remained optimistic about the future business outlook in the latest survey. The index for future business conditions increased to 32.1 in August, the highest level since May, after a 2.2-point easing to 27.9 in July, with 47.0% of respondents expecting business conditions to improve over the next six months. Future new orders climbed to 37.1 in August, the highest level since March 2022, from 33.2 in July, and future shipments rose to 33.7, a seven-month high, from 30.6. Growth in future employment accelerated to 28.2, the highest reading since March 2022, from July’s 14.4. Capital spending plans remained positive for the 10th straight month in August, with the future capital expenditures index rising to 16.5, a five-month high, from July’s 15.0. Expected prices paid rose to 57.7 in August from a four-month-low 53.0 in July, and expected prices received increased to 48.7 from a three-month-low 41.9.
The indexes in this report are diffusion indexes and measure the percentage of respondents indicating an increase minus the percentage indicating a decrease with zero separating expansion from contraction.
The New York Fed survey data are contained in Haver’s SURVEYS database. The expectations series is in Haver’s AS1REPNA database.

Winnie Tapasanun
AuthorMore in Author Profile »Winnie Tapasanun has been working for Haver Analytics since 2013. She has 20+ years of working in the financial services industry. As Vice President and Economic Analyst at Globicus International, Inc., a New York-based company specializing in macroeconomics and financial markets, Winnie oversaw the company’s business operations, managed financial and economic data, and wrote daily reports on macroeconomics and financial markets. Prior to working at Globicus, she was Investment Promotion Officer at the New York Office of the Thailand Board of Investment (BOI) where she wrote monthly reports on the U.S. economic outlook, wrote reports on the outlook of key U.S. industries, and assisted investors on doing business and investment in Thailand. Prior to joining the BOI, she was Adjunct Professor teaching International Political Economy/International Relations at the City College of New York. Prior to her teaching experience at the CCNY, Winnie successfully completed internships at the United Nations. Winnie holds an MA Degree from Long Island University, New York. She also did graduate studies at Columbia University in the City of New York and doctoral requirements at the Graduate Center of the City University of New York. Her areas of specialization are international political economy, macroeconomics, financial markets, political economy, international relations, and business development/business strategy. Her regional specialization includes, but not limited to, Southeast Asia and East Asia. Winnie is bilingual in English and Thai with competency in French. She loves to travel (~30 countries) to better understand each country’s unique economy, fascinating culture and people as well as the global economy as a whole.
More Economy in Brief
 Global