Global| Oct 15 2026
Charts of the Week: The Narrow Boom
by:Andrew Cates
|in:Economy in Brief
Summary
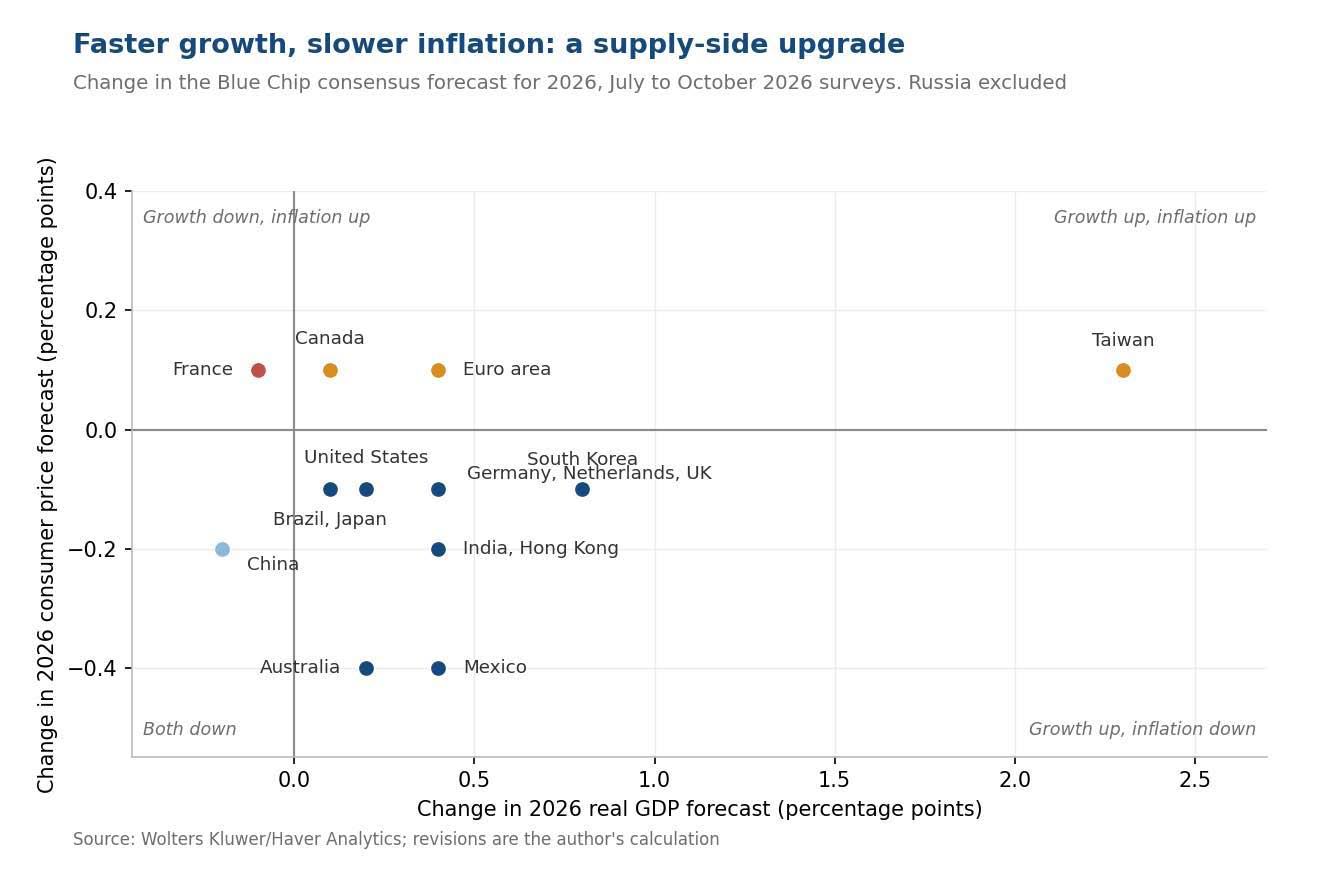
The past week saw investors begin to question the AI optimism that has sustained equity markets all year. Asian technology stocks fell sharply, the Nasdaq retreated to its weakest level this month, and government bonds attracted a defensive bid. The reappraisal arguably concerned positioning in the artificial-intelligence complex rather than the macroeconomic backdrop, which, if anything, improved. The October Blue Chip survey delivered growth upgrades across almost the entire panel alongside lower inflation forecasts for this year (chart 1), a combination consistent with an improvement in supply. The same US forecasters, however, made only modest changes to their view of the coming five years (chart 2). Chinese customs figures for September highlighted the growing importance of chips: exports rose 36.3 per cent on the year and the monthly surplus reached 133.5 billion dollars, with semiconductors furnishing close to a quarter of the increase (chart 4). For the European Union, the bilateral deficit with China has widened by more than $60 billion in 12 months (chart 5). Yet the composition of American construction spending (chart 3) and the uses to which European firms actually put AI technology (chart 6) suggest an expansion narrower than the headline figures imply.
A kinder mix The October Blue Chip Economic Indicators survey showed upward revisions to this year’s growth forecasts for fourteen of the sixteen economies the panel covers, and lower inflation forecasts for eleven. In eleven cases the two moved together, with stronger growth and lower inflation. The euro area, Canada and Taiwan were marked up on growth and inflation. France is the only economy with growth marked down and inflation up, while China is the only economy marked lower on both. Three months is a short window and some of this will prove to be noise. Faster growth with slower inflation is consistent with better supply rather than stronger demand, and the panel has rarely leaned this consistently in one direction.
Chart 1: Revisions to Blue Chip consensus forecasts for 2026 growth and inflation, July to October surveys
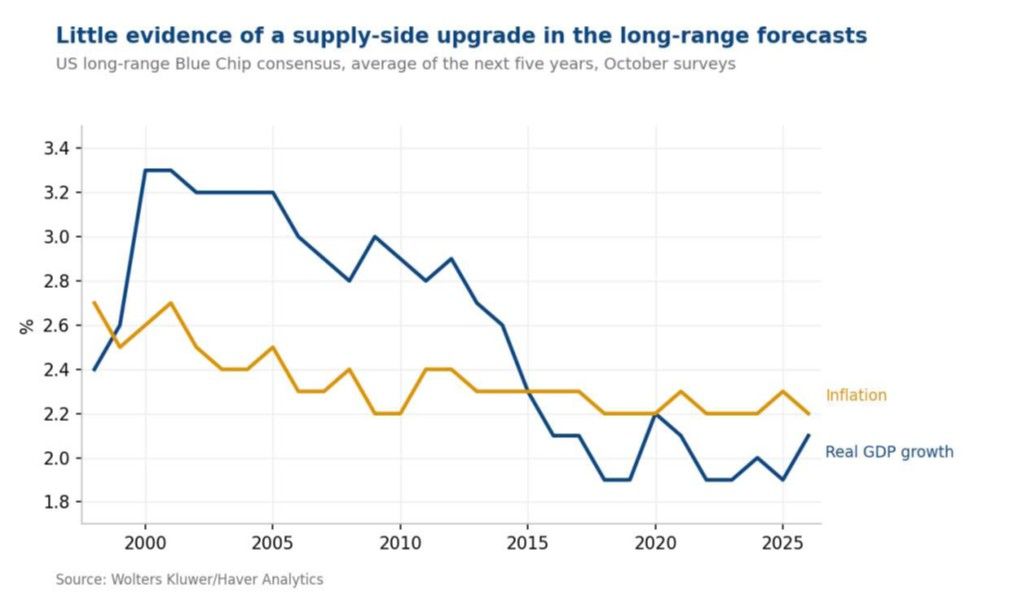
Little change at the horizon The October release also includes the semiannual long-range survey, and here the US panel has proved markedly less generous. Its estimate of American trend growth over the next five years has risen to 2.1 per cent, two tenths above a year ago, while its long-run inflation view slipped a tenth to 2.2 per cent. Directionally that is the same supply story. The scale of the revisions, however, is modest. Trend growth fell by a full percentage point between 2012 and 2018, and this year's move recovers a fifth of it; 2.1 per cent is precisely where the panel sat in 2016, 2017 and 2021. The long-run inflation estimate, for its part, has not left a 0.2 percentage point band since 2014 and offers little evidence of a change in expectations. Whatever forecasters expect of artificial intelligence, they have yet to write much of it into their long-term outlook.
Chart 2: US long-range consensus forecasts for real GDP growth and consumer price inflation, October survey vintages
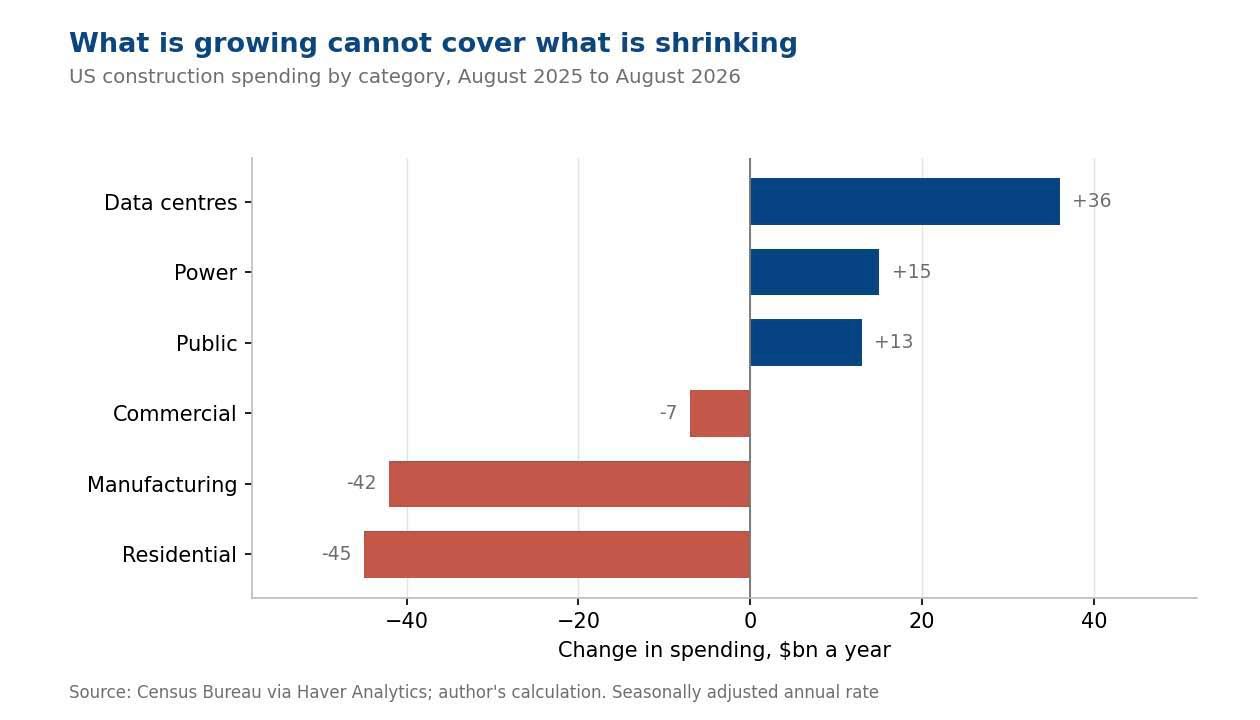
One sector doing the lifting US construction spending offers a plainer account of the same phenomenon. Data centres added $36 billion to annual spending in the year to August, power a further $15 billion and public works $13 billion. Against that, residential building fell by $45 billion, manufacturing structures by $42 billion and commercial construction by $7 billion. The expanding categories are precisely those the AI investment narrative celebrates; the contracting ones are larger, and together they more than offset those gains. An economy may run an investment boom in one sector while the remainder of its building activity declines, and the aggregate will appear unremarkable. That is roughly what the figures now describe, and it helps explain why a concentrated investment boom need not imply a large increase in economy-wide growth.
Chart 3: Contributions to the annual change in US construction spending by category
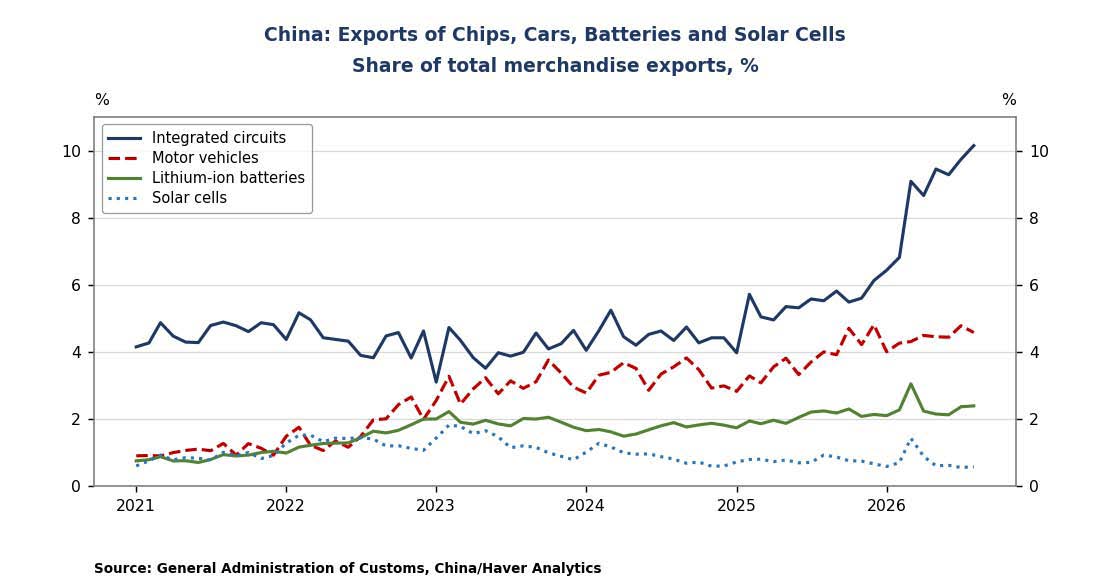
What China now sells The September trade figures from China, published this week, offered further evidence of the changing composition of demand. Exports rose at their fastest pace since February, and integrated circuits alone accounted for close to a quarter of the increase. Chips now constitute 10% of all Chinese merchandise exports, against roughly 4% through 2021. Motor vehicles have reached 4.6% and lithium-ion batteries 2.4%. Solar cells have travelled in the opposite direction, falling from a peak above 1.8% in early 2023 to little more than 0.5%, with August volumes down almost 40% on the year. The familiar grouping of electric vehicles, batteries and panels no longer moves in unison: two are climbing and the third is in retreat.
Chart 4: Chinese exports of various products as a share of total merchandise exports
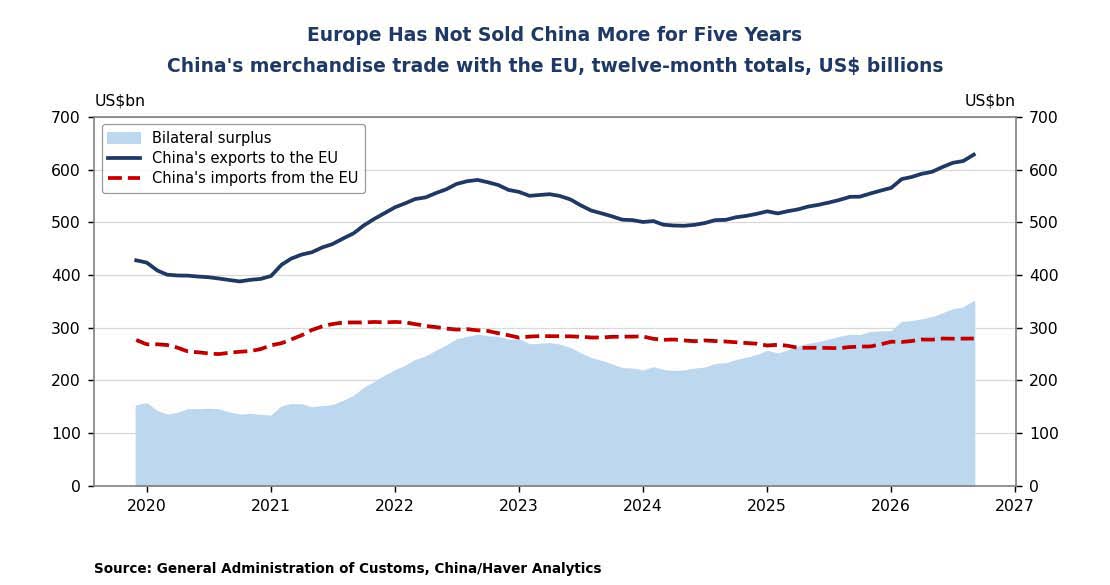
Europe's widening trade deficit For Brussels the arithmetic is uncomfortable. Over the 12 months to September, China sold the European Union $628 billion of goods and bought $279 billion, leaving a bilateral surplus of $349 billion against $285 billion a year earlier. In September alone, Chinese exports to the EU rose 25.3% while its imports rose 0.7%. European sales to China have been flat in nominal dollars for five years. That is the backdrop to this month’s restrictions on hybrid vehicles and to the pressure for rebalancing, although the September data offer little evidence that European measures have yet narrowed the imbalance.
Chart 5: Chinese merchandise trade with the European Union, twelve-month totals
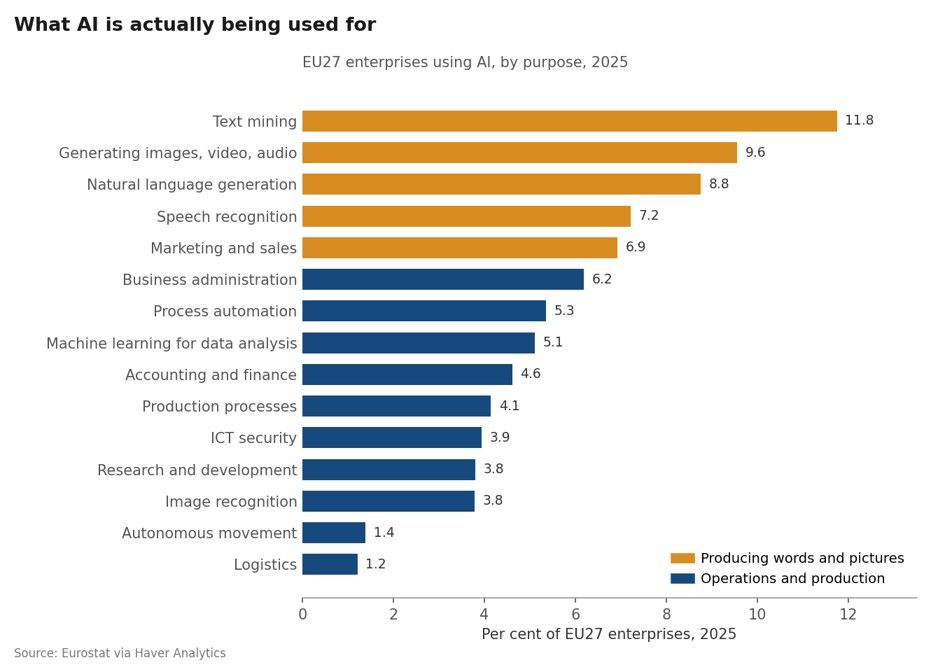
Words and pictures This leaves the question of what the technology is being used for. Among European enterprises reporting artificial-intelligence use last year, the most common applications were text mining, the generation of images, video and audio, and natural language generation. Applications with a more direct connection to operational efficiency sit lower down the list: process automation, production processes, logistics, autonomous movement. These are 2025 figures, and in a field moving this fast a year is a long time; the survey tells us where adoption had reached, not where it is heading. Even so, capital is flowing into data centres and the chips that fill them, and the chips are moving in volume, while adoption at the level of the firm appears concentrated in the production of content rather than the running of operations. Content generation can itself raise productivity. But until adoption spreads more widely across business operations, the Blue Chip panel has reason to remain cautious about the scale of the gains over the next five years.
Chart 6: Share of EU27 enterprises using artificial intelligence, by purpose

Andrew Cates
AuthorMore in Author Profile »Andy Cates joined Haver Analytics as a Senior Economist in 2020. Andy has more than 25 years of experience forecasting the global economic outlook and in assessing the implications for policy settings and financial markets. He has held various senior positions in London in a number of Investment Banks including as Head of Developed Markets Economics at Nomura and as Chief Eurozone Economist at RBS. These followed a spell of 21 years as Senior International Economist at UBS, 5 of which were spent in Singapore. Prior to his time in financial services Andy was a UK economist at HM Treasury in London holding positions in the domestic forecasting and macroeconomic modelling units. He has a BA in Economics from the University of York and an MSc in Economics and Econometrics from the University of Southampton.
More Economy in Brief