EMU HICP Detail and Building Pressures
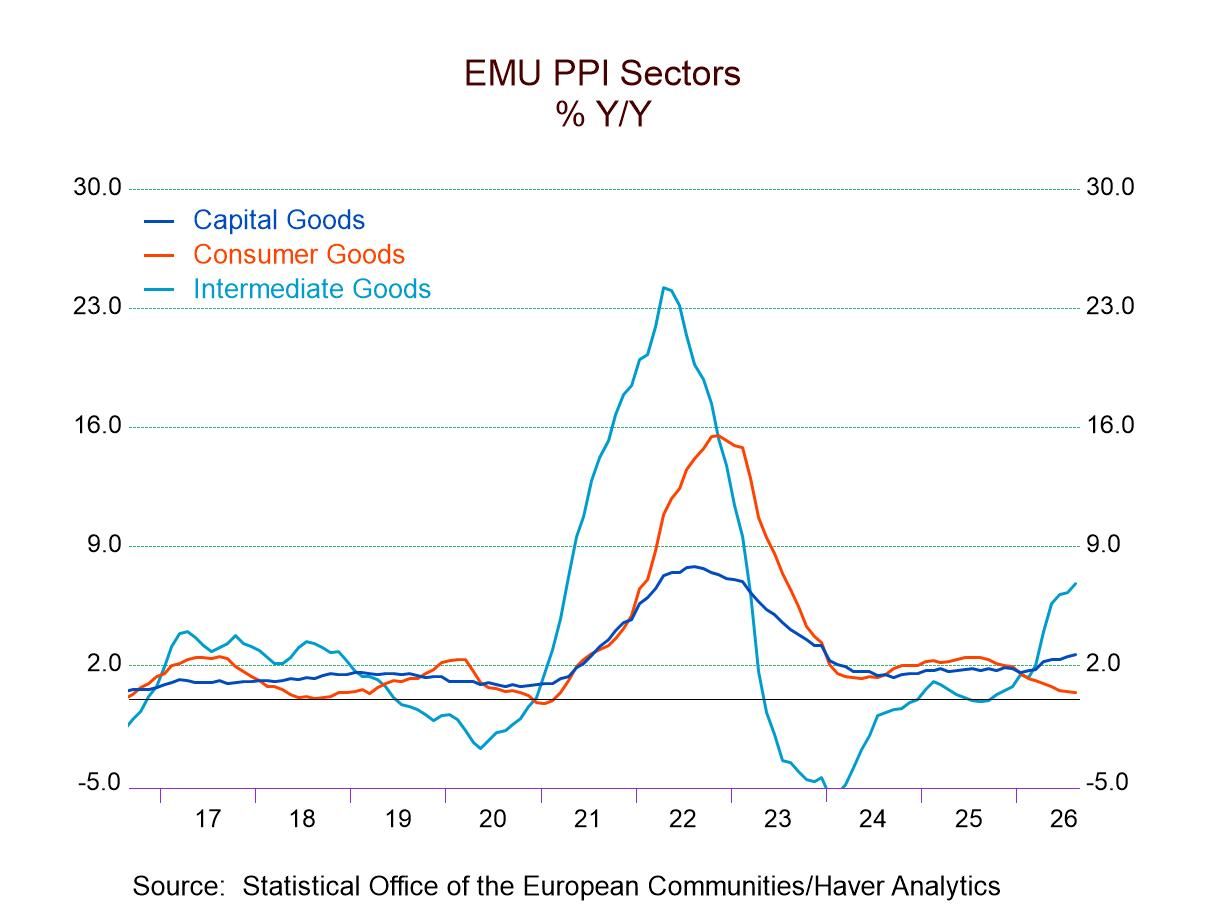
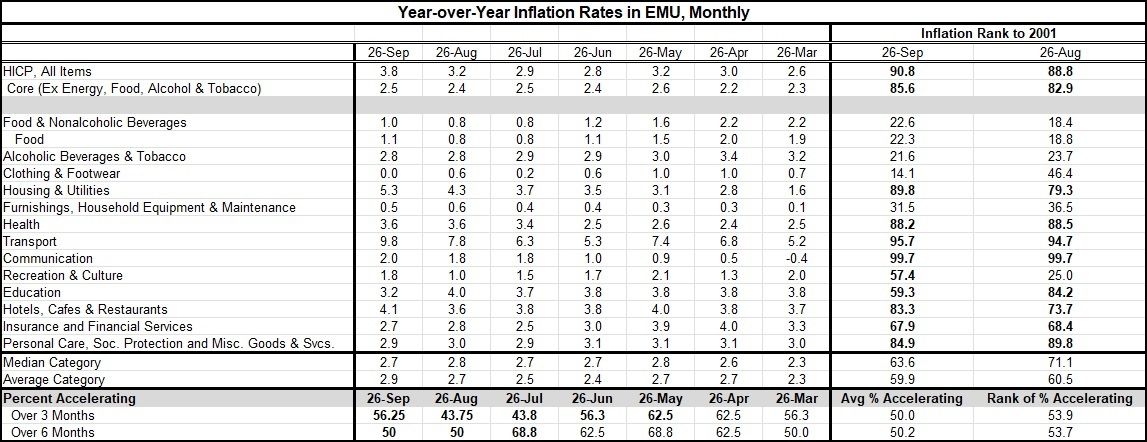
Think of this as though it's mixed doubles in tennis. This is a chart of the PPI pressures in the monetary union, while the table is a more detailed decomposition of pressures within the HICP consumer price measure. The PPI report is a graphic depiction of where the pressures are coming from in the inflation process at the primary levels. It shows us that the greatest pressures are coming from intermediate goods with a kick to inflation is the strongest. Next capital goods prices at the producer level are rising on a milder gradient enjoying an increase at a pace above 2%. However, consumer goods prices in the PPI framework are weak, with a growth rate that's migrated back down toward zero. Yet in the overall HICP data, consumer prices at the consumer level are showing considerable pressure they're also showing considerable upward momentum and they're showing us broad inflation pressures all on their own.
The pressures we see in consumer prices are not being pushed up through the producer price process per se. However, depending on how you look at or think about consumer prices we know they could part of the cost of consumer goods it was actually the selling of them to the public. That requires not just the production of consumer goods but also the transportation of them to the wholesale location and then to the retail location. Transportation costs are an important part of consumer prices and we're more aware of that these days because people do a lot more online shopping and they can see the difference that you pay between going to the store for a good by having it delivered to your house where you have to pay an explicit delivery charge. A delivery charge would of course reflect the fact that somebody has to come to deliver it but also that a vehicle has to be driven and that vehicle has to be fueled. The PPI shows us that a lot of the pressure that is being passed on is coming through that fuel channel.
Despite the fact that there's not a lot of cost to push coming from the producer-price stage of production, within the consumer, certainly does not mean that final product consumer price pressures don't exist. We see the pressures I'm a detailed consumer price report exhibited in the table. As of September, the HICP headline is up 3.8% / 12 months with the core at 2.5%. Both of those ring the cash register at a pace too high for the ECB target. As of September, that 3.8% pace at the 90.8 percentile standing on year over year inflation data back to 2001- a 25-year comparison. But the core the lower 2.5% pace still has an 85.6 percentile standing on that same timeline. These metrics tell us that not only is inflation too high by the standards of the European Central Bank, but they are also significantly elevated compared to what they've been historically.
We provide year over year inflation rates or detailed categories within the hicp as well as in the right-hand column the rankings of inflation for those different categories inflation clocks a pace above the 50% ranking for nine other categories in the hicp that we present to the table in contrast only 5 categories have rankings below 50%. The level of 50% is significant for rankings because it identifies the median for each of these measures, so we have above median inflation in nine categories and below median inflation in only 5.
Go to the bottom of the table we look at the percent of categories for inflation is accelerating over three months and over six months. Over three months inflation there's acceleration for 56% of the categories whereas for six-month inflation does acceleration in 50% of the categories. Acceleration tendencies are neutral by this I mean data back to 2021 the average percent accelerating over three months is 50% and the average accelerating over six months is 50.2% so that inflation accelerating or decelerating over this broad. There has been an even-handed proposition with inflation accelerating about half the time and decelerating about half the time. Or but that's just a statement about the proportion of categories that are accelerating the next question is how strong is the acceleration because the ranking at the far-right hand part of the table that shows that, for three months inflation, the ranking for the proportion of categories that are accelerating is at 53.9%, whereas over six-months, the ranking is at 53.7%. The table which of the median inflation but the categories listed in the table as well as the average the unweighted average for the same categories. In September, the median category saw inflation at 2.7% while the average category was at 2.9%. The median rank of inflation on data back to 2001 is at 63.6% while the average rank of inflation back to 2001 is 59.9%. There was a slight step down in the median and average inflation rates between August and September even though the inflation rate has gone up between the two periods.
These data_show inflation diagnostics vary depending on what aspect of inflation that we look at whether it's producer or consumer, and depending on the time horizon that we choose, and whether we're looking at the level of inflation, or the change in inflation, or inflation's tendency to accelerate. All of these are reasonable and even necessary ways to look at inflation in order to understand how virulent it is and how it compares to trends historically. That is a much more complicated exercise than just understanding if inflation is running above or below a central bank's 2% target.
The inflation level data are high in terms of either the headline or the core measures. The breadth of inflation across the categories is tilted to being high based upon a comparison of historic rankings that allows comparison of each category to its own history. The proportion of categories with inflation accelerating it is also troublesome. Inflation, while not roaring as it did in the 1970s, appears to have insinuated instead broadly in the developed economies because it has been lurking and pressuring prices in different ways for so long. And with supply shocks coming unpredictably, it is hard to be optimistic about containing inflation. When central bankers seem more worried about doing something that will protect their reputations, and contain expectations rather than actually reducing inflation, you can be sure inflation will linger.

Robert Brusca
AuthorMore in Author Profile »Robert A. Brusca is Chief Economist of Fact and Opinion Economics, a consulting firm he founded in Manhattan. He has been an economist on Wall Street for over 25 years. He has visited central banking and large institutional clients in over 30 countries in his career as an economist. Mr. Brusca was a Divisional Research Chief at the Federal Reserve Bank of NY (Chief of the International Financial markets Division), a Fed Watcher at Irving Trust and Chief Economist at Nikko Securities International. He is widely quoted and appears in various media. Mr. Brusca holds an MA and Ph.D. in economics from Michigan State University and a BA in Economics from the University of Michigan. His research pursues his strong interests in non aligned policy economics as well as international economics. FAO Economics’ research targets investors to assist them in making better investment decisions in stocks, bonds and in a variety of international assets. The company does not manage money and has no conflicts in giving economic advice.
More Economy in Brief
 Global