Global| Jul 09 2026
Charts of the Week: Growth Holds Firm
by:Andrew Cates
|in:Economy in Brief
Summary
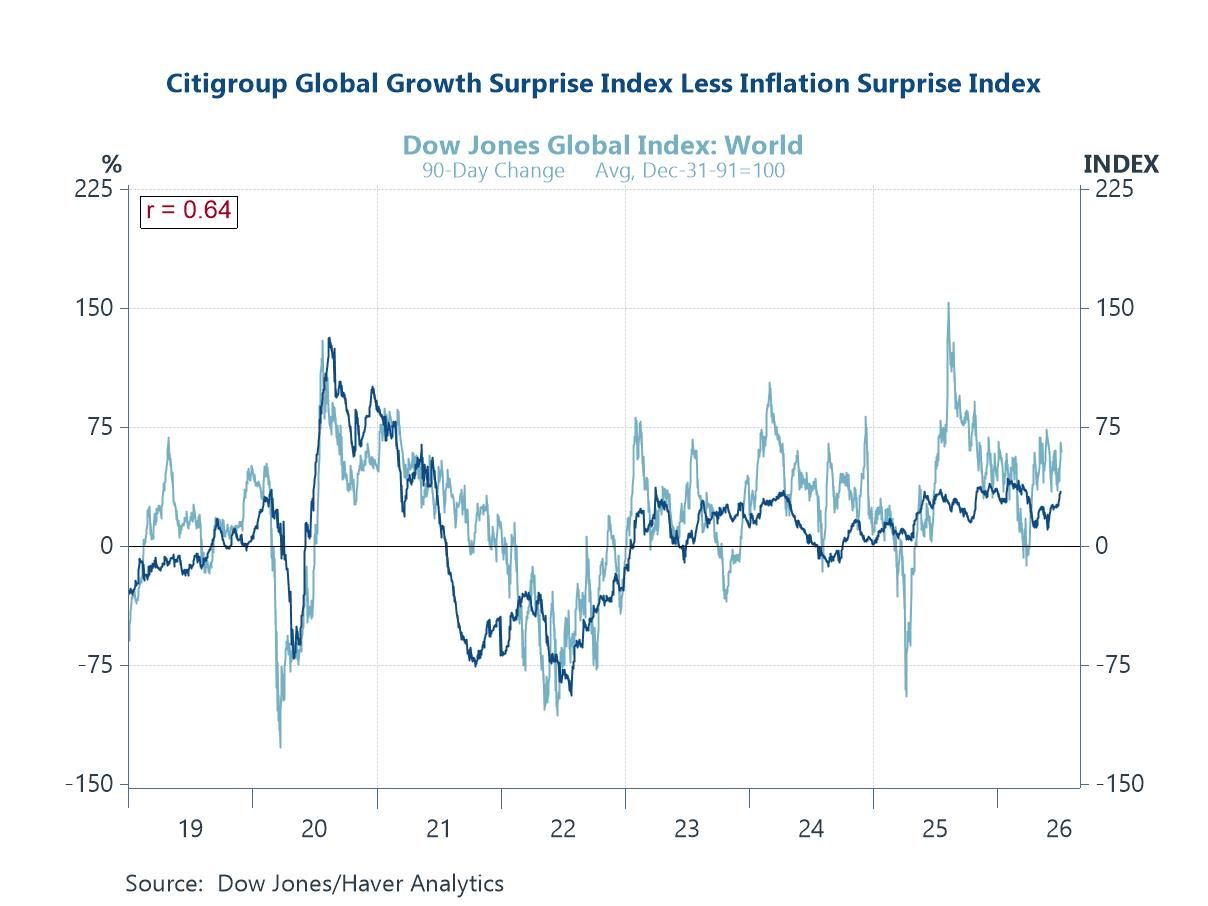
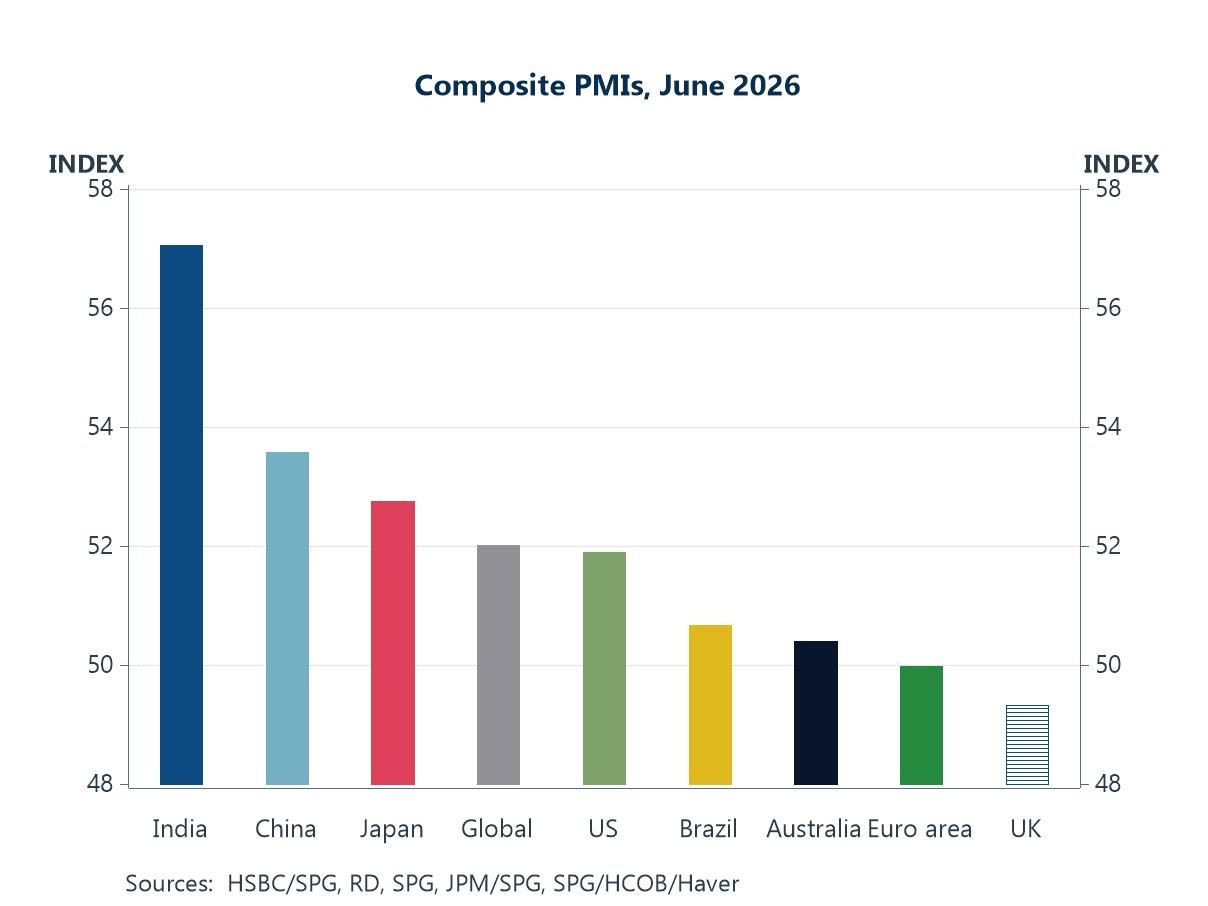
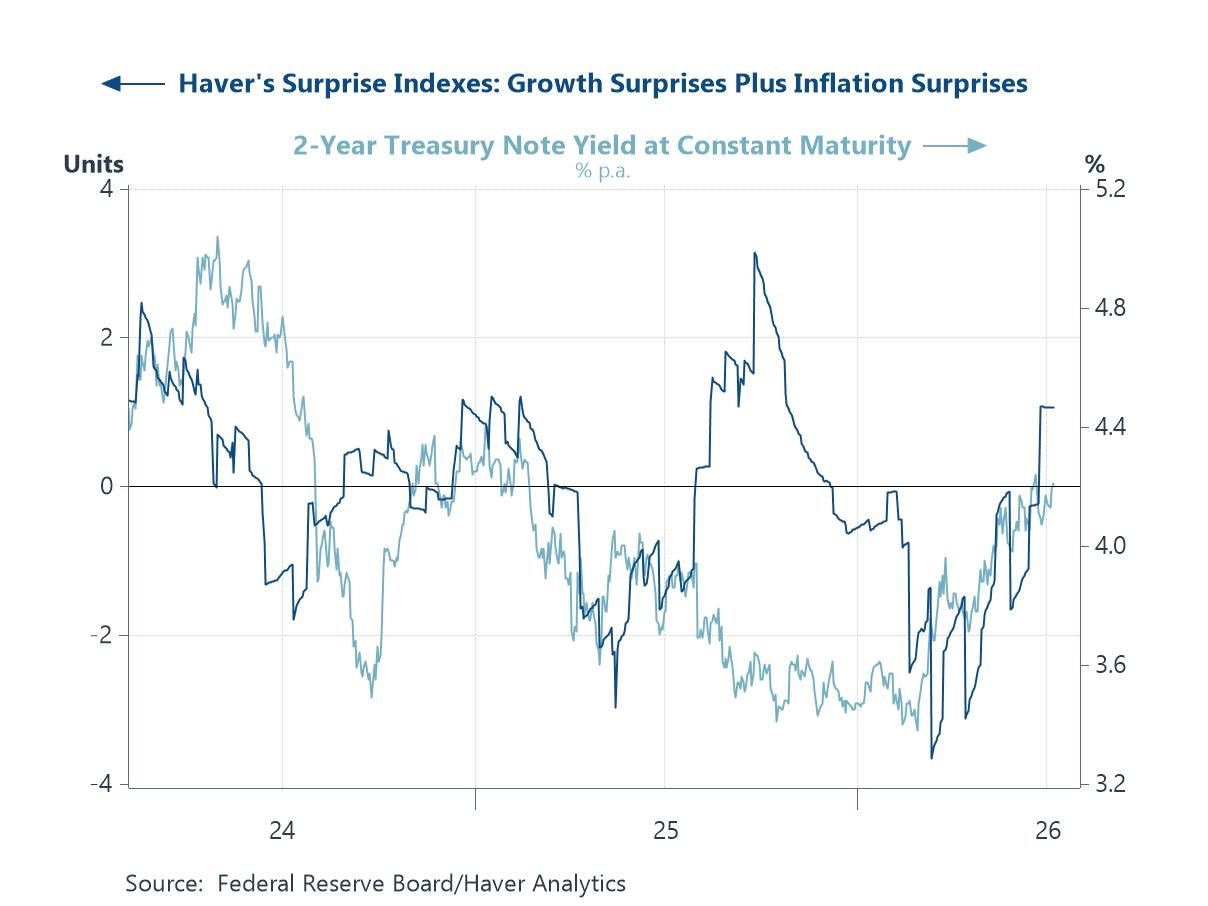
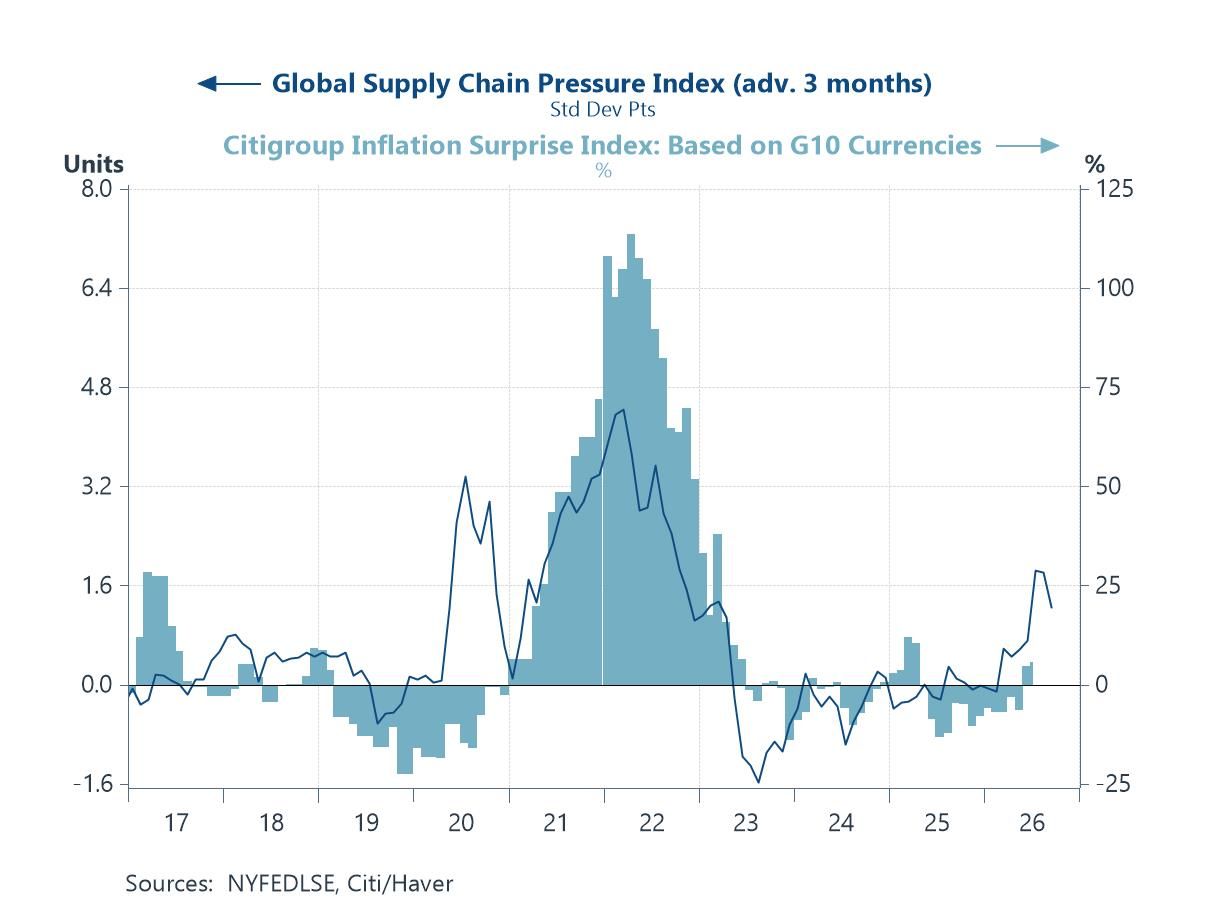
Global markets head into this week’s closing stages digesting a mixed set of signals. Last week's US non-farm payrolls report undershot expectations, adding to questions about the durability of the US labour market even as broader activity data have continued to hold up well. Compounding that picture, news broke today of renewed instability in the Middle East, reintroducing a geopolitical risk premium into markets just as investors had begun to look past it. Global equity markets have nonetheless remained resilient, continuing to track the broadly encouraging tone of incoming activity data (chart 1). That resilience was reinforced by a solid set of global PMIs across most major economies over the past few days (chart 2). Haver's surprise indices tell a similar story of positive growth momentum in the US, but with an important caveat: incoming inflation data have also been surprising to the upside, driven largely by higher oil prices (chart 3). These inflation risks could persist moreover, as global supply chain pressures have picked up in recent months and today's flare-up in the Middle East threatens to add further strain (chart 4). The world economy remains vulnerable to other supply-side shocks too, such as the extreme heat gripping much of Europe this week (chart 5). Still, on the other side of the ledger the enormous scale of investment now flowing into artificial intelligence could be a genuine source of supply-side potential (chart 6).
Growth Surprises Continue to Underpin Equity Resilience Global equity markets have proved remarkably resilient in recent weeks, shrugging off intermittent bouts of geopolitical and policy uncertainty to grind higher. Chart 1 below helps explain why: it tracks the relationship between global growth-versus-inflation surprises and world equity markets, and on that measure the recent run of global growth data has continued to surprise on the upside relative to inflation outturns — a combination that has historically been supportive for risk assets. Whether that resilience persists will depend on whether the growth-surprise advantage evident in the chart below can be sustained in the face of the inflationary pressures explored below.
Chart 1: Global Growth Surprises vs. Global Equity Markets
PMIs Confirm a Broadly Solid Global Expansion This week's final composite PMI readings for June reinforced the broader impression of resilient global growth. As chart 2 below shows, most major economies posted readings comfortably in expansionary territory, with India continuing to lead the pack and the US not far behind. Even the laggards in the sample are hovering close to the expansion threshold rather than falling decisively below it, suggesting stabilisation rather than outright contraction (and with the UK a notable exception).
Chart 2: Composite PMIs, June 2026
Inflation Surprises Are Creeping Back, and Bond Yields Are Taking Notice The US growth picture painted by Haver's surprise indices broadly echoes the message from the global PMI data. Chart 3 below shows the combined growth-and-inflation surprise index drifting higher this week, and closer inspection suggests growth is doing most of that work, with activity data continuing to outperform expectations. That is, on the face of it, good news. But it has not stopped bond markets from taking notice: short-dated Treasury yields have remained elevated in recent weeks, as stronger growth keeps alive the possibility that the Federal Reserve holds rates higher for longer or even lifts them in coming weeks.
Chart 3: US Growth and Inflation Surprises vs. 2-Year Treasury Yield
Supply Chains Are Tightening Latest data show that global supply chain pressures tightened by less in June than they had the month before, likely reflecting the easing of Middle East tensions through much of the period. Chart 4 below shows that pressures troughed in the middle of last year and have been building gradually since, though June's slower pace of tightening suggests that easing had started to feed through. Still, today's flare-up threatens to undo that improvement, particularly if it affects shipping routes or energy flows through the region once again.
Chart 4: Global Supply Chain Pressures vs. G10 Inflation Surprises
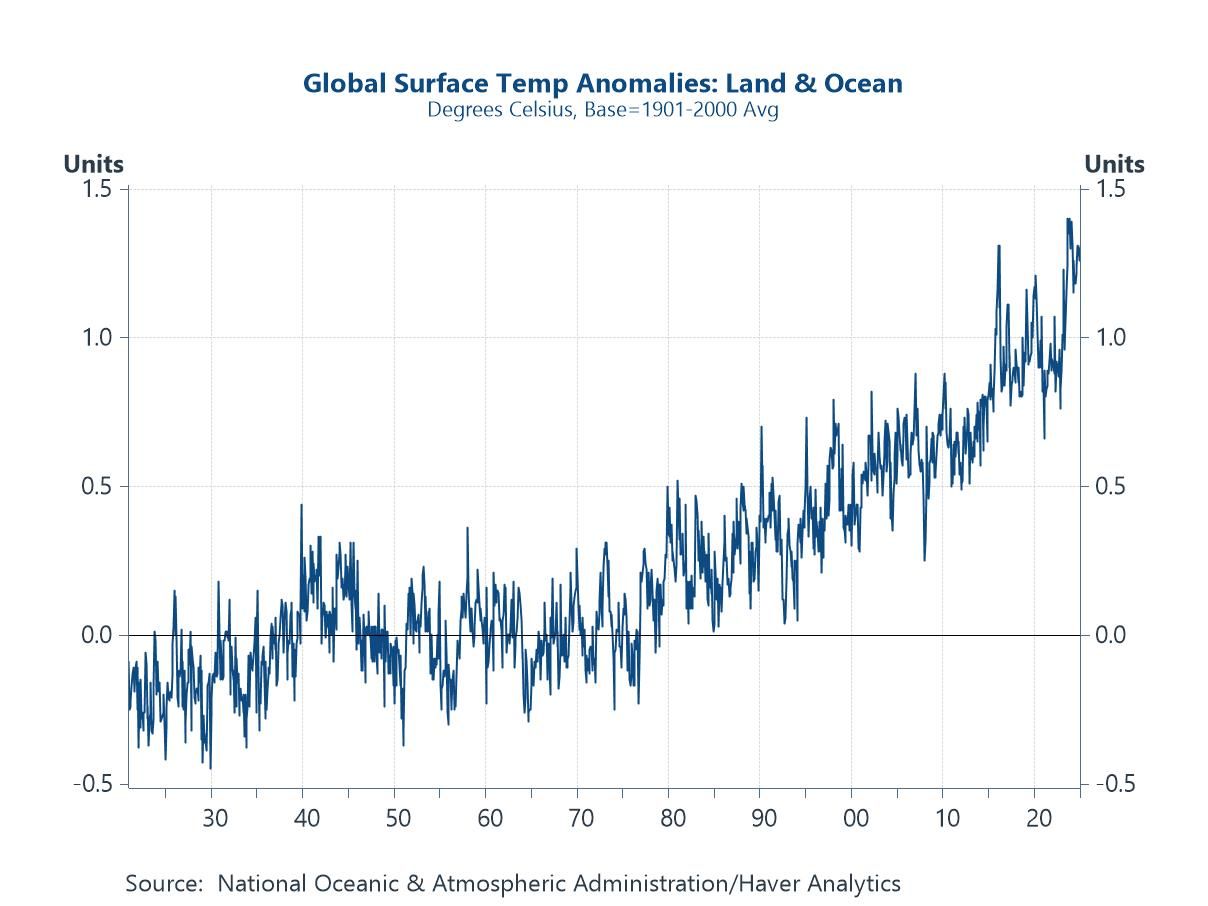
Extreme Weather: An Old Supply-Side Risk Returns Geopolitics is not the only source of supply-side risk currently in play. Large parts of Europe have been gripped this week by another intense and prolonged heatwave, with temperatures in several major cities running well above seasonal norms. Extreme heat of this kind carries real economic costs: it depresses labour productivity, particularly in outdoor and manufacturing-adjacent sectors, strains electricity grids as air-conditioning demand spikes, and can disrupt agricultural output and river-based transport when water levels fall. Episodes like this have become more frequent in recent years, and while any single heatwave rarely shifts the macro picture on its own, the cumulative effect of more frequent and more severe weather events could start showing up in productivity and inflation data across the advanced economies. It is a reminder that the supply side of the global economy faces structural as well as cyclical challenges, and that climate-related disruption deserves a permanent place alongside geopolitics and demographics in any assessment of medium-term inflation risk.
Chart 5: Global Temperature Anomalies
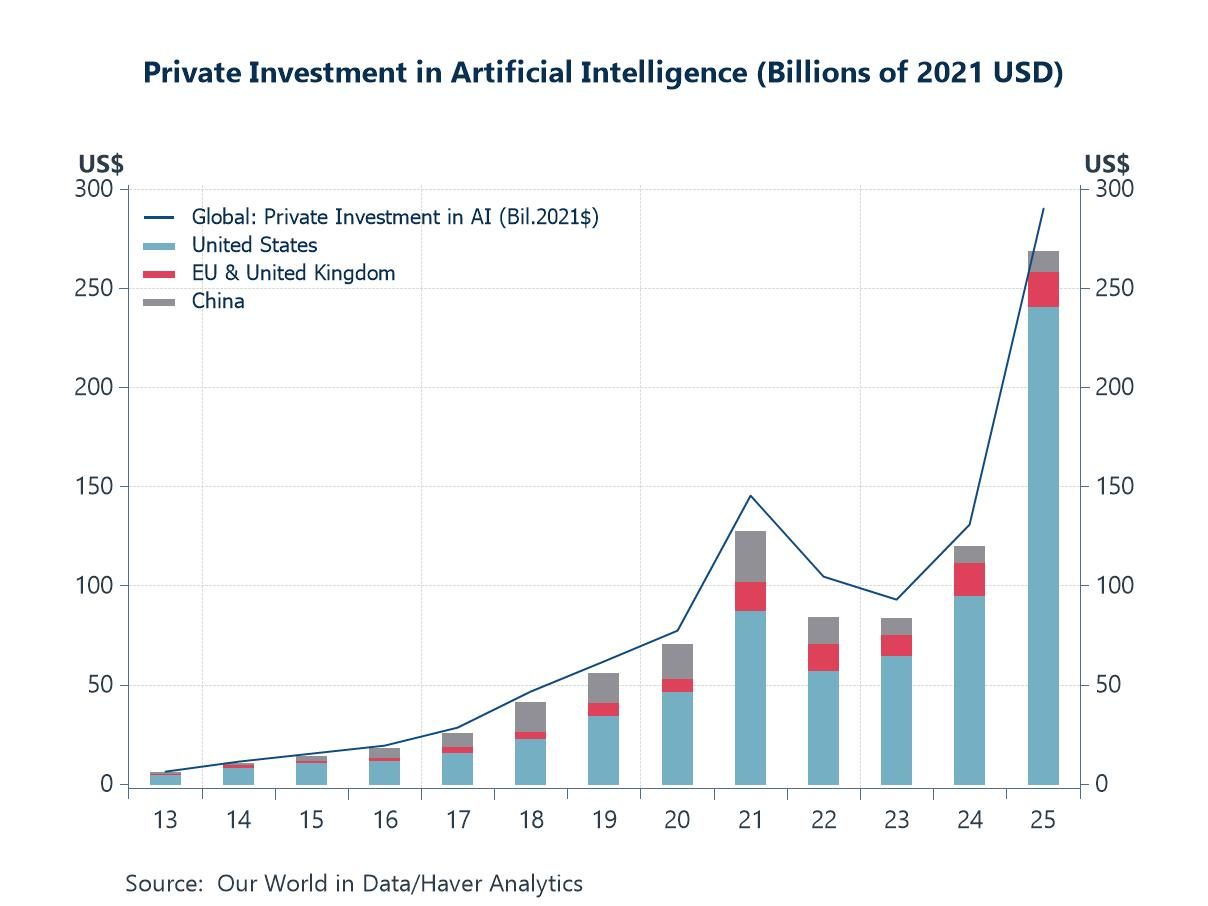
AI Investment: The Other Side of the Supply Equation Set against these supply-side headwinds is a genuinely positive structural development: the extraordinary scale of private investment now flowing into artificial intelligence. Chart 6 below shows just how sharply that investment has grown in recent years, reaching a fresh high last year. If even a fraction of that investment translates into genuine productivity gains, it could provide a meaningful long-run offset to the energy, climate and geopolitical constraints highlighted elsewhere in this week's charts. The scale of the bet now being placed on AI is large enough that it is beginning to show up in aggregate investment and capital expenditure data across the advanced economies, and it is likely to remain one of the defining structural themes shaping the global growth outlook over the remainder of this decade.
Chart 6: Private Investment in Artificial Intelligence

Andrew Cates
AuthorMore in Author Profile »Andy Cates joined Haver Analytics as a Senior Economist in 2020. Andy has more than 25 years of experience forecasting the global economic outlook and in assessing the implications for policy settings and financial markets. He has held various senior positions in London in a number of Investment Banks including as Head of Developed Markets Economics at Nomura and as Chief Eurozone Economist at RBS. These followed a spell of 21 years as Senior International Economist at UBS, 5 of which were spent in Singapore. Prior to his time in financial services Andy was a UK economist at HM Treasury in London holding positions in the domestic forecasting and macroeconomic modelling units. He has a BA in Economics from the University of York and an MSc in Economics and Econometrics from the University of Southampton.
More Economy in Brief