

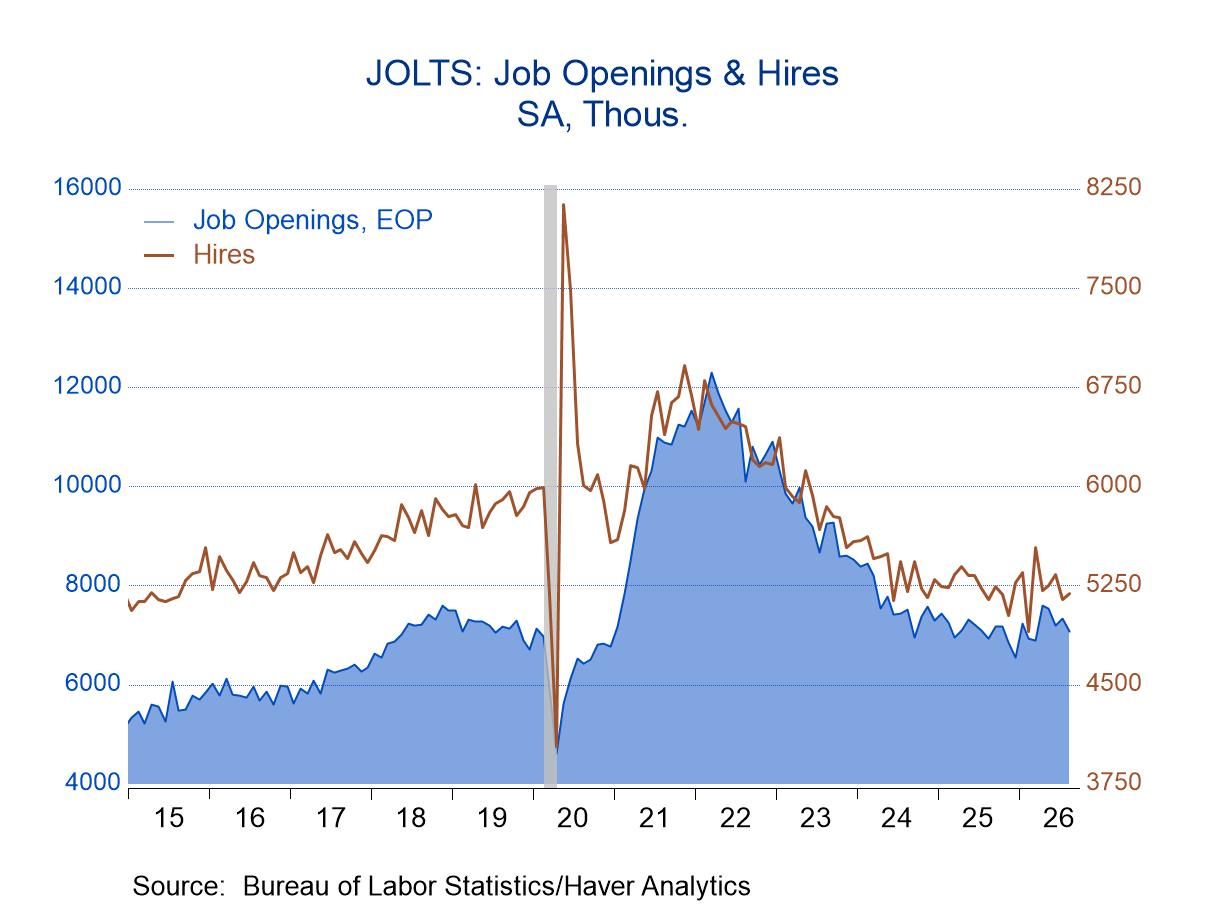
- Openings slid 256,000 in August, the third monthly decline in the past four months.
- However, the number of openings marginally exceeded the number of unemployed for the fifth consecutive month.
- Hiring edged up 46,000, the third monthly increase in the past four months, due entirely to increased state and local government hiring.
- Separations fell 58,000, led by a 61,000 decline in layoffs.
USA| Sep 29 2026
U.S. JOLTS: Openings Slipped and Hiring Edged Up in August
by:Sandy Batten
|in:Economy in Brief
More Commentaries
 Global| Sep 25 2026
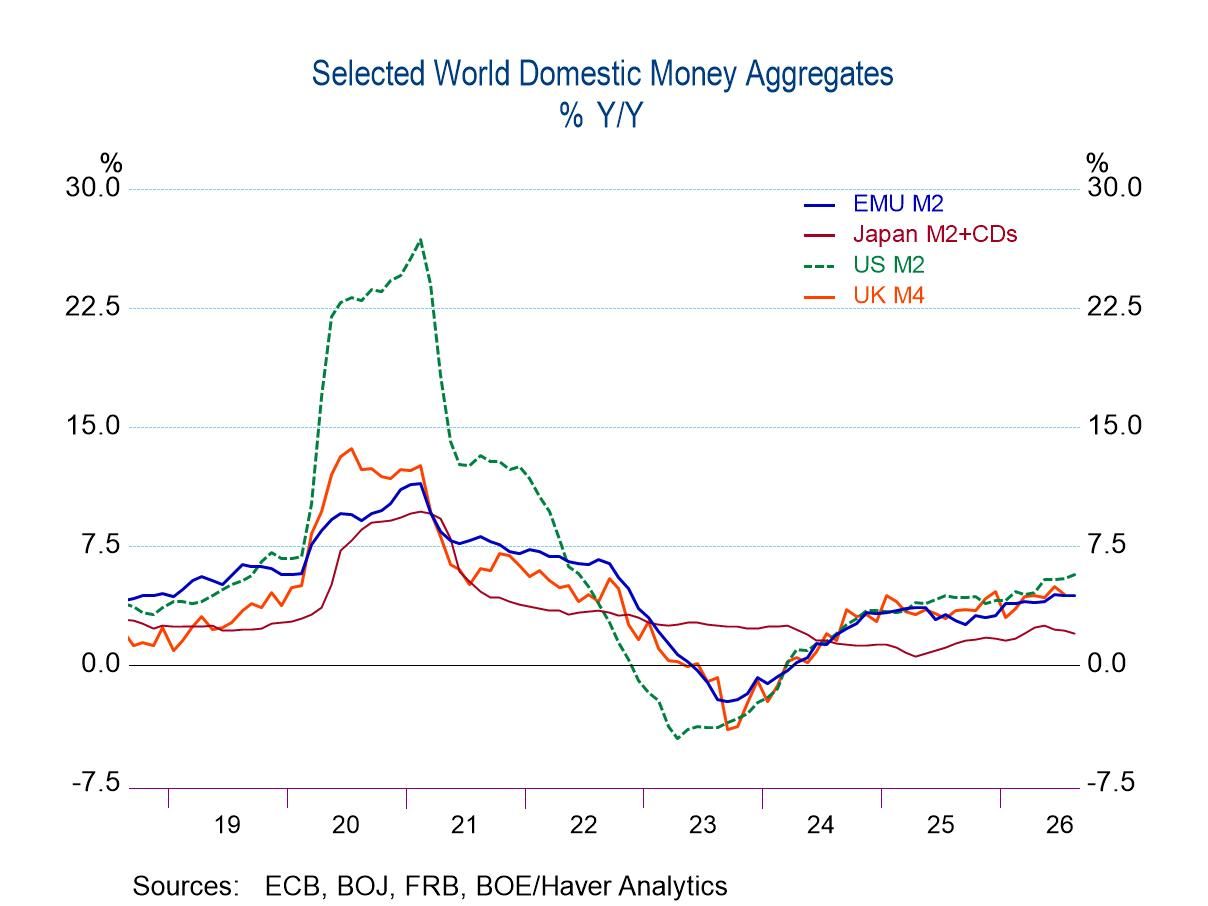
Money Supply Growth Slows Except in the U.S.
Globally, money growth is easing but the U.S. has become an exception to global trends.
In the EMU, money growth has been slowing within the last year as 12-month growth at 4.3% turns to 2.8% over six months and to 2.4% over three months. In addition, speaking more broadly, the three-month and six-month growth rates are slower than the cumulative pace over three years and two years.
The performance of credit growth in the EMU runs along very similar lines, with greater easing within the 12-month span and growth being broadly weaker over three months and six months than over the last two years and three years cumulatively.
EMU money growth in real terms—real money balances—show not just slower growth but contraction over both three months and six months. They show a broad slowing, with some irregularity compared to longer periods.
The U.K. is not a clear read on money trends, but its three-month nominal growth rate is weaker although there is a small pickup over 12 months and six months compared to previous periods. U.K. real money balances also show contraction over three months but have speeded up over six months and 12 months from very weak rates of growth in their performance in earlier periods.
Japan shows clear slowing in nominal growth from 12 months on. Its recent growth rates are slower than its already slow rates over two years and three years. Japan’s real balance growth also shows real balance contraction over three months and six months as well as more broadly.
The U.S. is an outlier, with slightly weaker three-month nominal growth but with accelerations over 12 months and six months, and with three-month growth that is stronger than over the longer horizons of two years and three years. Growth in real money balances in the U.S. has accelerated and is accelerating within the last year and over the longer horizon as well. U.S. real balance performance shows monetary stimulus running flat-out, marking the U.S. as a clear monetary outlier.
While tracking and relying on monetary signals has fallen “out of fashion,” a lot of that is because of monetary innovation. It is not clear that the finding that U.S. real balances are accelerating should be treated as a benign event. Money growth in the U.S. is strong in real and nominal terms.
 Global| Sep 24 2026
Charts of the Week: Narrow Shoulders
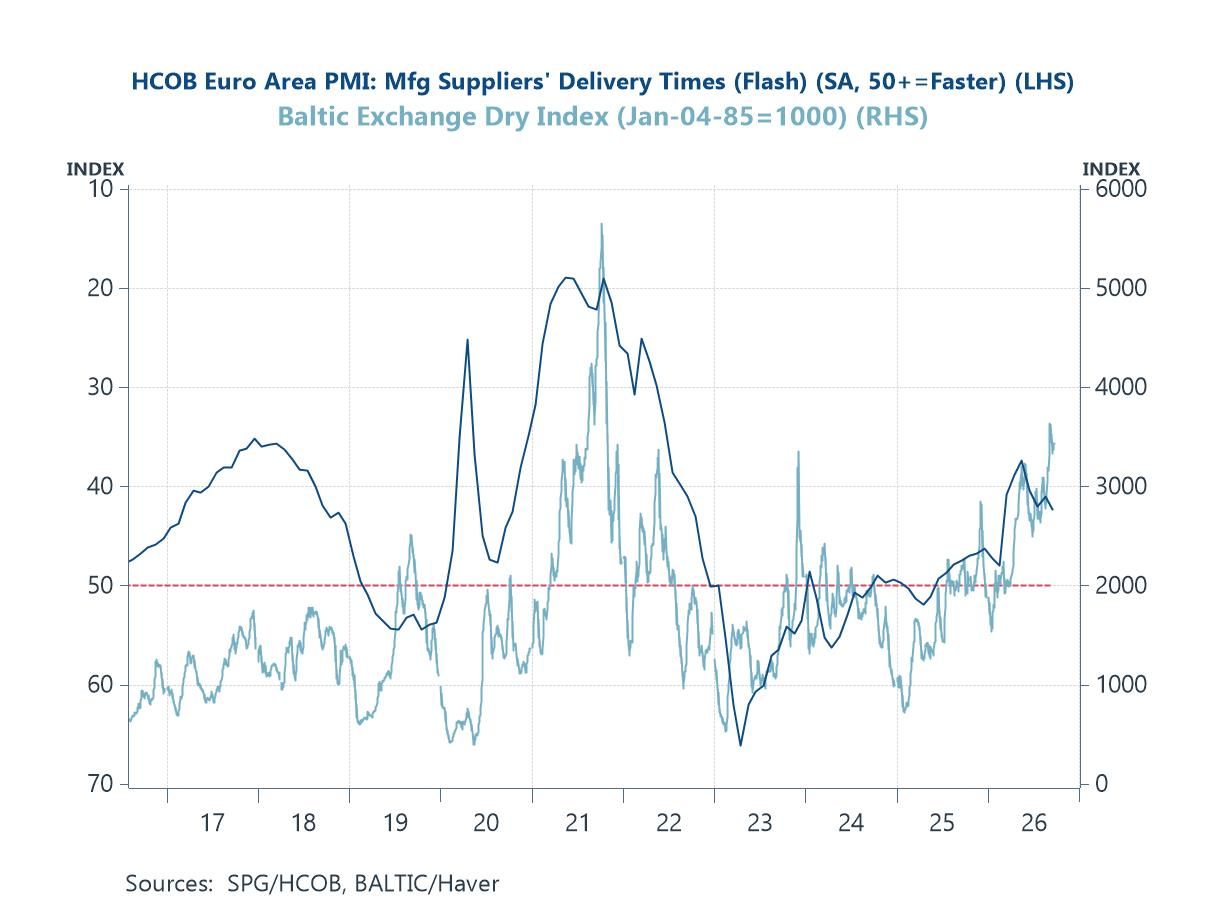
Financial markets have spent this week weighing whether this year's energy shock has passed its peak, and have changed their minds more than once. Brent slipped below $99 as Hormuz shipments were reported recovering and Gulf leaders gathered in New York, only to recover above $100 within a day. The relief in the energy market has proved neither durable nor shared by the bond market. The Federal Reserve raised rates last week for the first time in three years, the ECB has tightened alongside it and the Bank of Japan has moved again, leaving ten-year Treasury yields at levels last seen in 2007 and Bunds at seventeen-year highs. This week’s flash purchasing managers’ surveys help explain the discomfort, with European supply chains lengthening once more as dry bulk freight rates climb (chart 1). The aggregate global growth picture has nonetheless held up better than the geopolitics would imply, though the latest Blue Chip consensus survey continues to suggest that this resilience is concentrated in only a small group of semiconductor exporters rather than shared across the world economy (chart 2). Part of the explanation for the wider containment lies in the oil balance, where a drawdown in stocks without precedent in the available record has substituted for the spare capacity that once cushioned disruptions of this kind (chart 3), and part lies in the character of the commodity shock itself, which now has at least three unrelated sources (chart 4). Labour markets are where the strain has begun to show, and it is showing very unevenly across the advanced economies (chart 5). In European bond markets, meanwhile, the consequences have turned political, with the premium demanded on French debt over German reaching levels not seen since the euro crisis (chart 6).
by:Andrew Cates
|in:Economy in Brief
 USA| Sep 24 2026
U.S. New Home Sales Rebound to an Eight-Month High in August
- Sales +6.4% m/m (-2.0% y/y) to 684,000 in Aug.; up 27.9% from a July ’22 low.
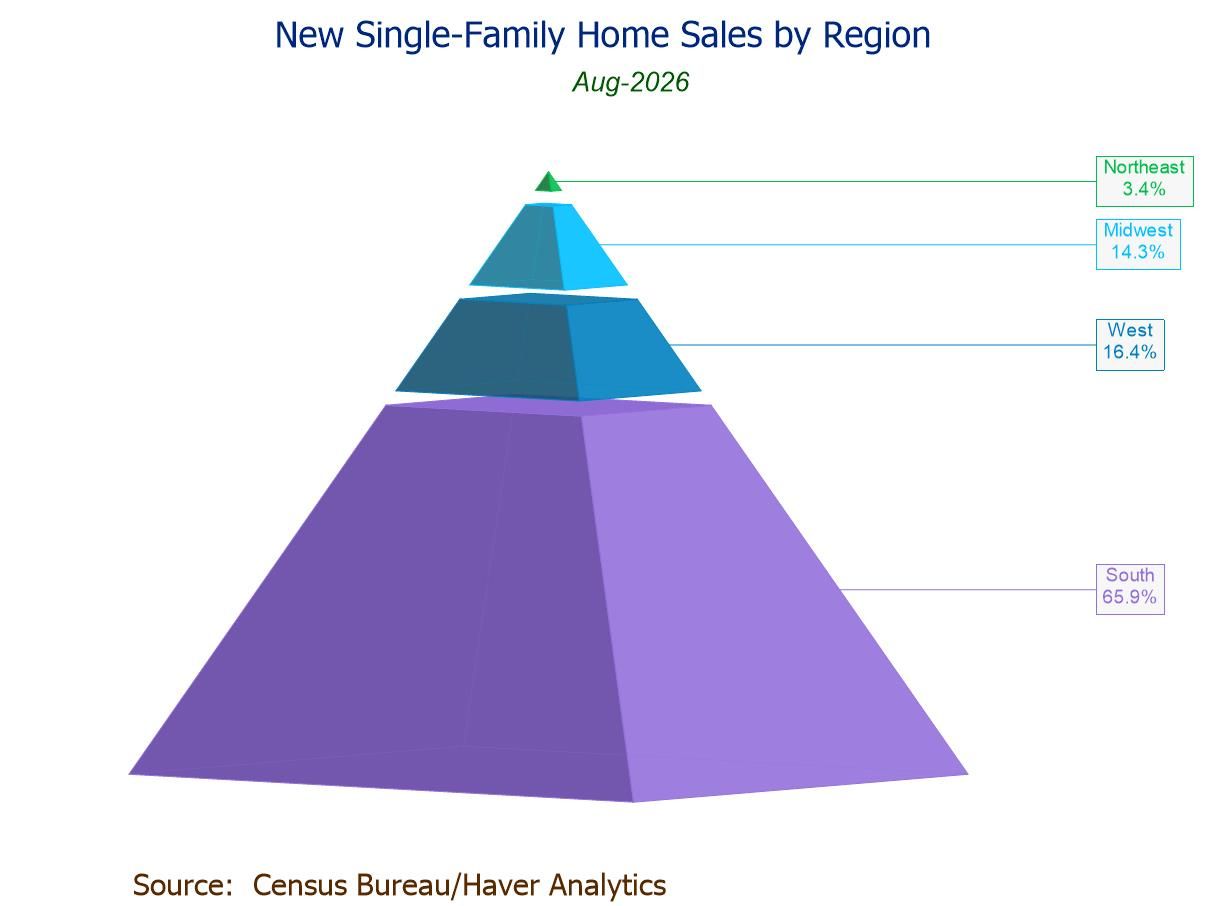
- Sales m/m up in the Midwest (+84.9%) and South (+6.9%); down in the Northeast (-36.1%) and West (-15.2%).
- Median sales price +0.4% m/m to $393,700, first rise since Apr.; avg. price -9.1% m/m to $478,700, a two-year low.
- Unsold inventory unchanged (-2.0% y/y) at 483,000; months' supply down to 8.5 mths., lowest since Dec. ’25.
 USA| Sep 24 2026
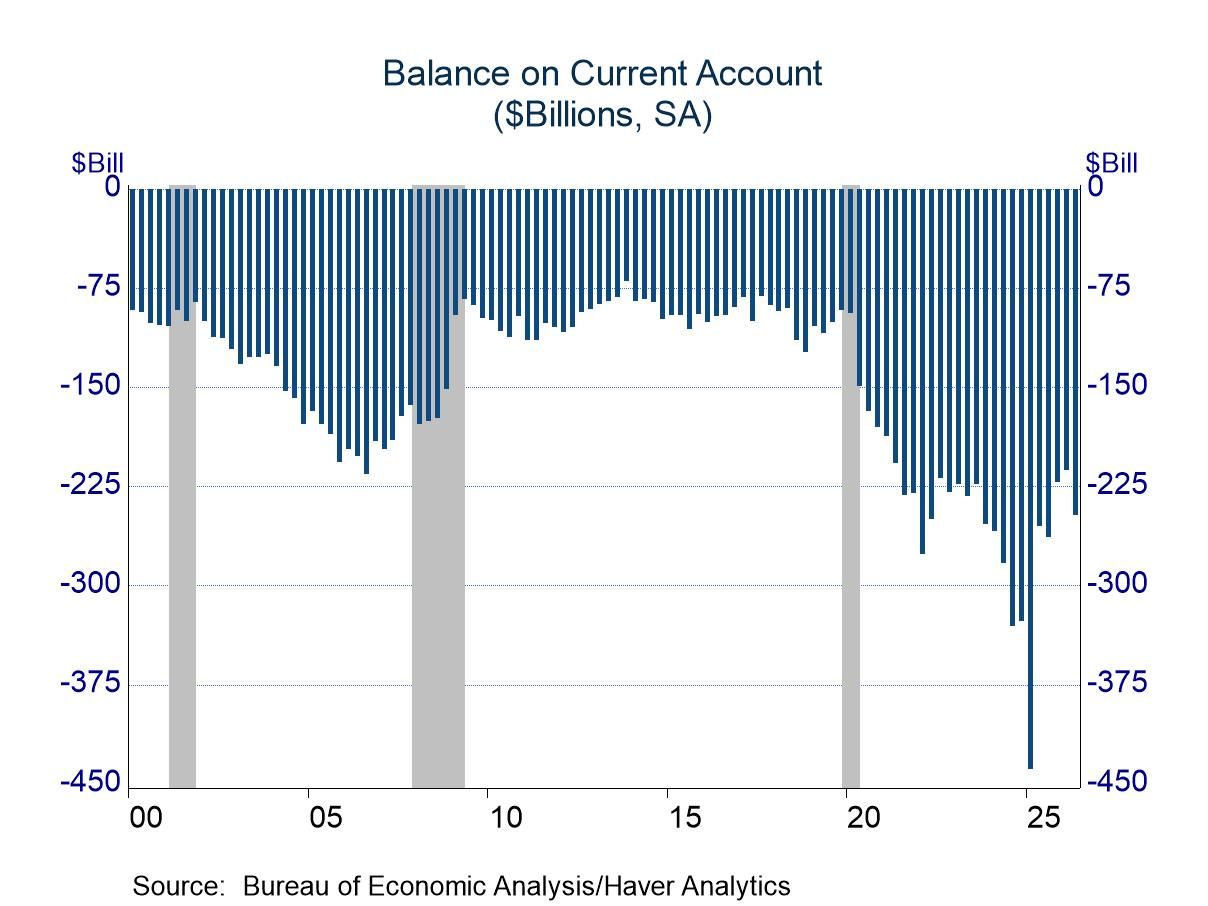
US Current Account in Q2: Additional Slippage
- A widening in the trade deficit deepened the current account shortfall.
- Both primary and secondary income improved slightly (i.e. became less negative).
 United Kingdom| Sep 24 2026
U.K. Retail Sales Come Up Lame in September
BOE Decision to Hold Rates in the Face of Inflation Seems Prescient While inflation continued to be a problem as the Bank of England had its last policy meeting, the BOE decided to hold the line on the policy rate despite a slightly worse inflation report than expected just prior to the meeting of the central bank committee. One reason was that inflation, which was flaring because of pressure on oil prices, had not been spreading in the economy. The BOE didn't see a reason to raise interest rates to stop a spread that wasn't occurring, and the MPC knew there was no reason to raise interest rates to roll back oil prices because interest rates would have no effect on oil prices, which were rising globally for completely different reasons.
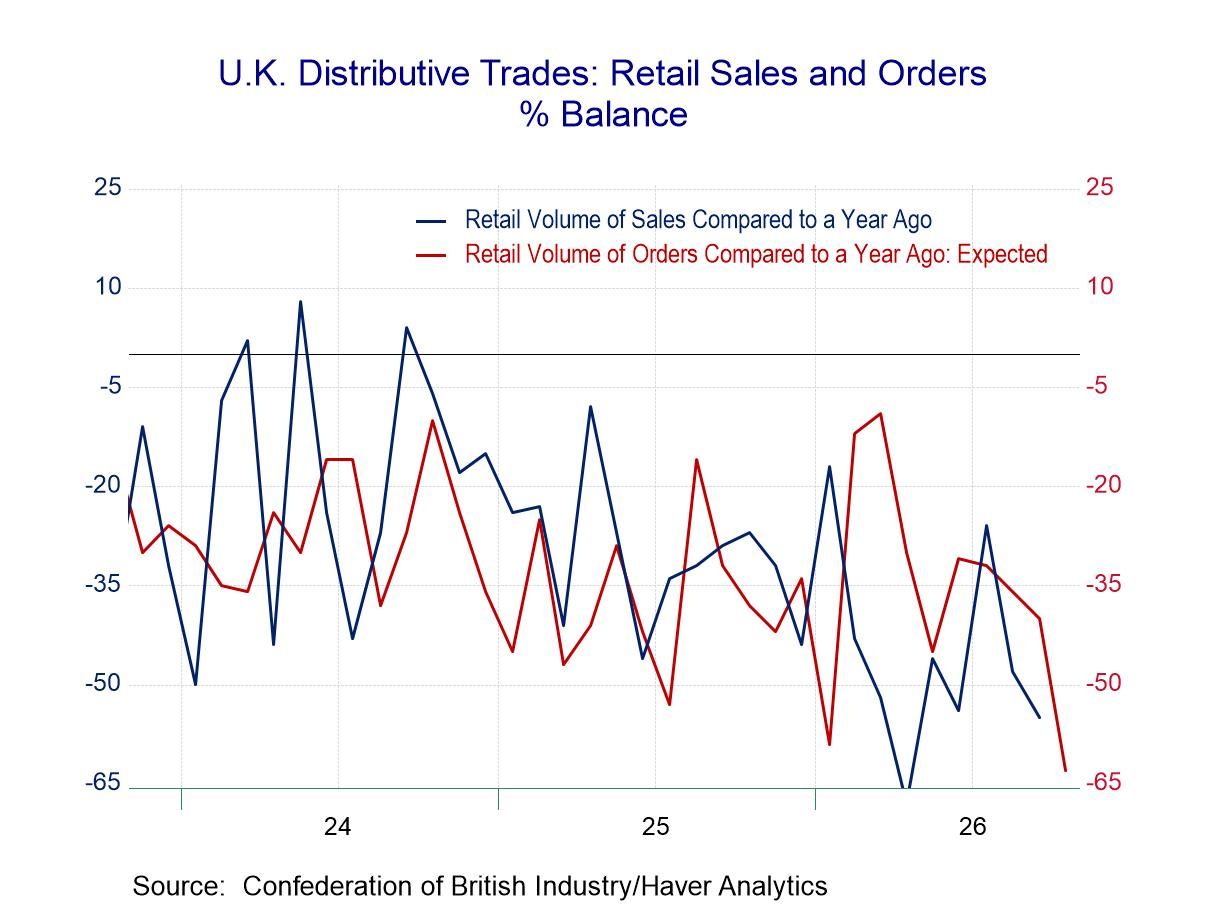
The decision to hold off on interest rates is certainly further justified as the CBI retail sales report for September shows a worsening in sales compared to a year ago, a worsening in orders, a worsening of sales for time of year, and a small pickup in the level of stocks that is arguably involuntary.
The changes on the month are in fact severe, and not technical, with sales compared to a year ago falling to -55 in September from -48 in August, while orders compared to a year ago posted a net reading of -62, down from -29, more than doubling their previous negative value. Sales for the time of year also fell severely to a net reading of -40 in September from -26 in August. These are massive changes in already negative numbers on a monthly basis.
The percentile standings for these values are also extremely low. Orders compared to a year ago are at the lowest value seen in data since December 2001. Sales compared to a year ago have been weaker only 1% of the time. Sales compared to what they normally do this time of year have a 4.4 percentile standing; they are weaker, less than 5% of the time. While the inventory number crawled higher, it has a 21.1 percentile standing. None of these figures inspire any confidence as to the shape of the consumer. And the outlook doesn’t get better either.
A survey of expectations also shows severe deterioration, not just deterioration, for October compared to September. Sales, compared to a year ago, dropped to a net value of -37 in October from -22 in September, carving out a 6.4 percentile standing, another extremely weak standing, this time for expected sales. Orders compared to a year ago logged a reading of -63 in October compared to -40 in September; this is another very sharp deterioration in view of severe weakness the month before. It’s another all-time low for the reading on data since December 2001. Sales for the time of year weakened to a reading of -39 in October from -29 in September, creating a 4.3 percentile standing, yet another bottom 5% standing, this time for expected sales for the time of year.
 Global| Sep 23 2026
S&P PMIs Five of Seven Early Reporters Show Stronger Output in September
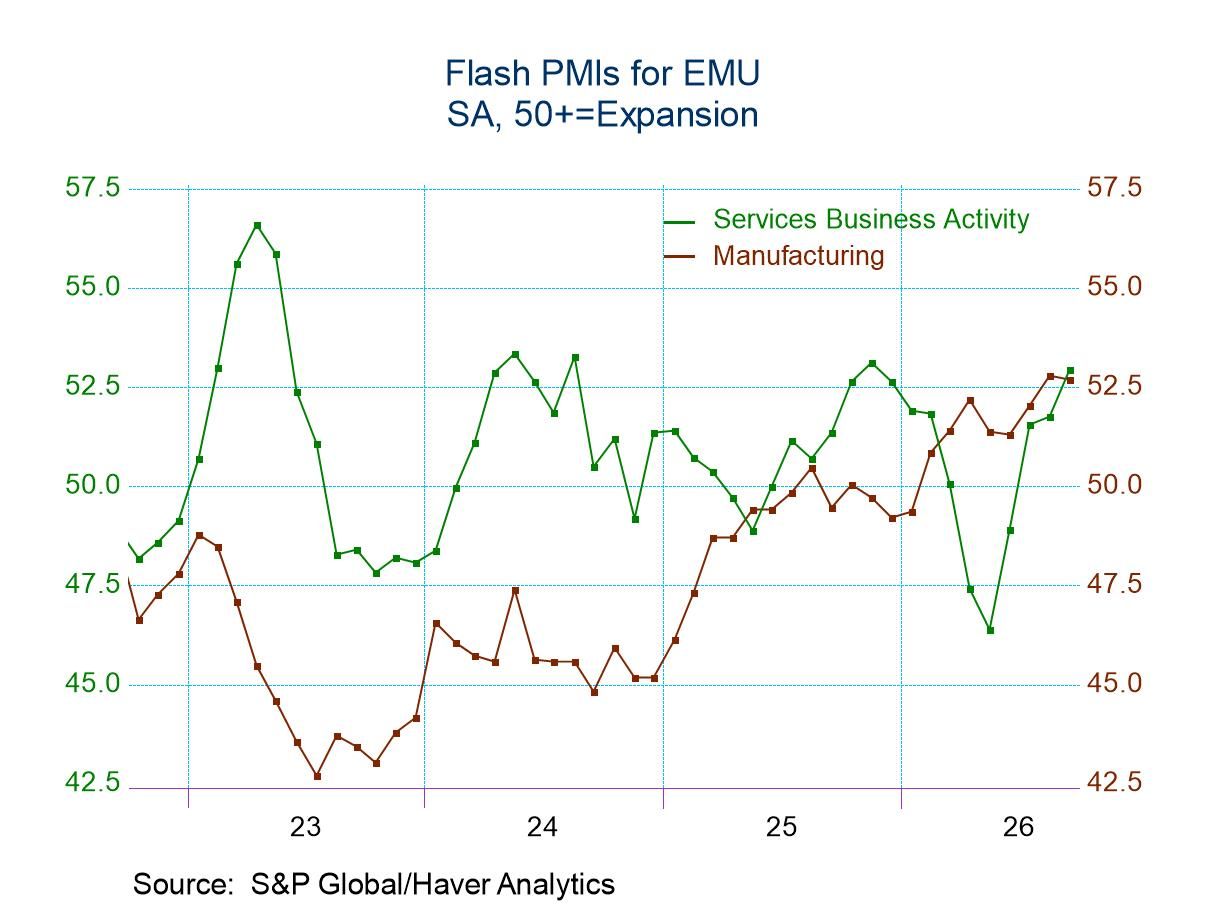
Japan, a usual early reporter, has not reported early this month. But among the seven reporters, five show improved monthly performance in September compared to August. The United Kingdom and Australia are weaker on the month. The euro area, Germany, France, India, and the United States are better on the month. Four of seven reporters show queue standings for monthly readings that are above their averages of the past 4½ years. The U.S. composite queue standing is exceptionally strong, with an 89.7 percentile standing for its composite index in September.
Ironically, India, which has the lowest queue-ranking index, has the second highest diffusion reading among the September reporters, at 56.5. It is second only to the U.S. at 58.4. That result for India simply underscores how well India’s economy has done over the past 4½ years compared to everyone else. To flesh that out, over the past 4½ years India’s composite average has been 58.1; the U.S., 53.6; the U.K., 52.4; the euro area, 51.3; Australia, 51.1; Germany, 50.9; and France, 49.9. France is the only reporter in the table to have averaged a composite index that shows a net decline over the whole period.
These average rankings give you some idea of how weak the past 4½ year period has been. Both Germany and France also log manufacturing readings below 50, indicating manufacturing sector contraction on average. In the euro area, the average reading was 50.9—above breakeven of 50 but by less than one diffusion point—obviously weighed down by France and Germany. Australia is the only country that has an average services reading weaker than its manufacturing reading for the full period.
Sequentially, the manufacturing data are improving from 12 months to six months to three months. Services are close to that same phenomenon but on relatively flat numbers. Over the past three months, the composite index, manufacturing, and services are all steadily progressing higher when a simple average of the seven responses is collected. There are three sectors and seven countries sketching out 21 comparisons each month. August and September each have eight weaker responses out of 21, while July had only three responses of ‘weaker’ out of 21.
The queue standings, which rank the current index levels across sectors for the last 4½ years, show 14 of 21 readings above their respective means, that is, with a standing of over 50%. India’s standing is the weakest with all readings below 50%, but that is much more a statement about past strength than about current weakness. The U.K. and Australia each have two sectors below 50% in standing. For Australia, it is the composite and manufacturing; for the U.K., it is the composite and services. However, for all countries, manufacturing performance in September is worse than it was in January 2021.
As of September, there is still a good deal of manufacturing weakness in play, with four of seven early reporters showing manufacturing weaker monthly in September. Only the U.K. and Australia have weaker service sectors month-to-month.
On balance, the S&P PMI readings show that the global economy is still getting stronger despite inflation, rate hikes, and challenges posed by war and geopolitical tensions. However, we should not assume that progress will continue apace. To some extent growth has been maintained by running down stocks of scarce goods, and some stocks of needed items may now be low. Winter is coming, and with it will come the demand for a winter energy source. It is no time to get complacent.
 USA| Sep 21 2026
Chicago Fed National Activity Index Negative in August After July’s Upwardly Revised Positive Level
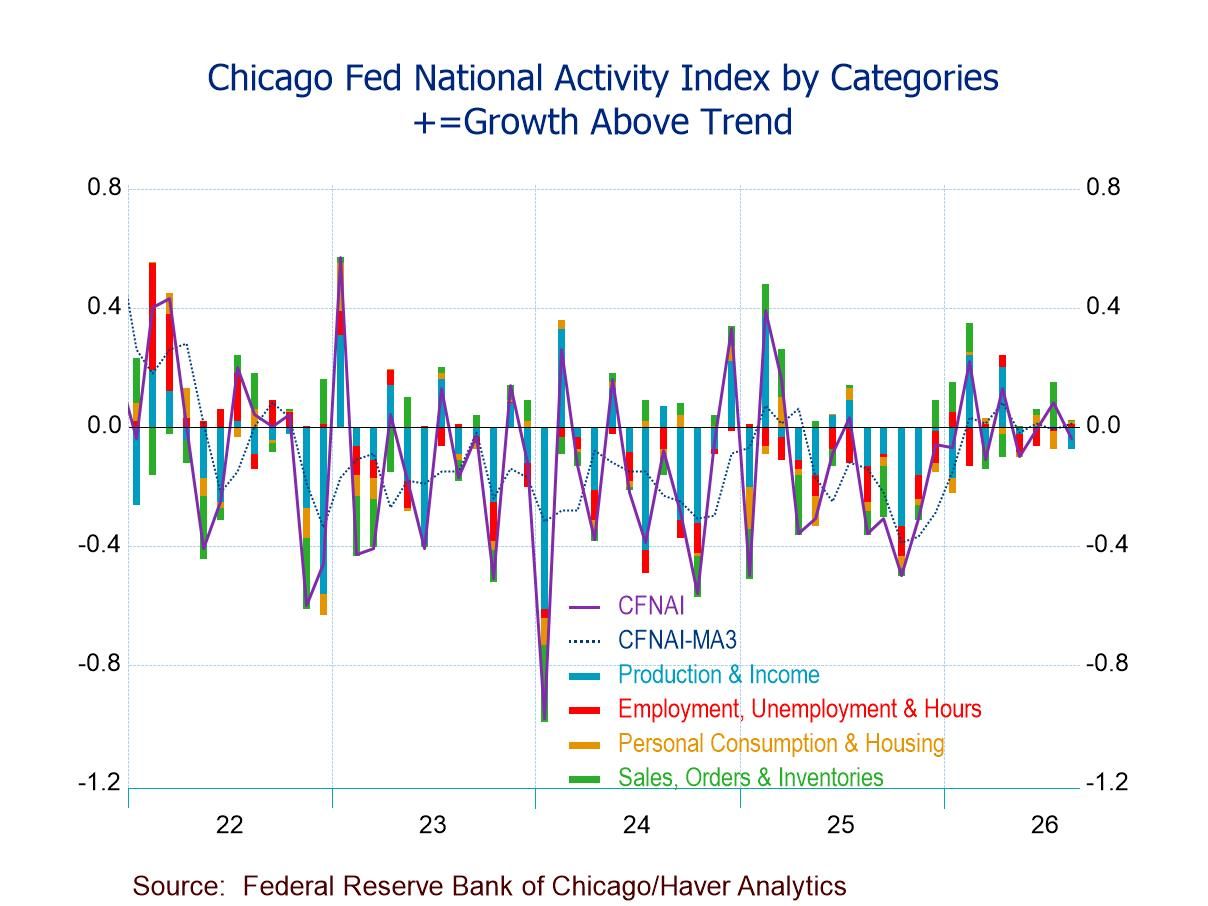
- CFNAI down to -0.04 in Aug., negative for the third time in four mths.
- Two of four CFNAI components down m/m; one makes a negative contribution.
- CFNAI-MA3 up to +0.01, second positive reading in three mths.; above -0.70 (recession signal).
- CFNAI Diffusion Index down to +0.02, still positive for the sixth straight mth.
 United Kingdom| Sep 21 2026
U.K. Housing Surveys and Consumer Sentiment Support the View of Weak Growth
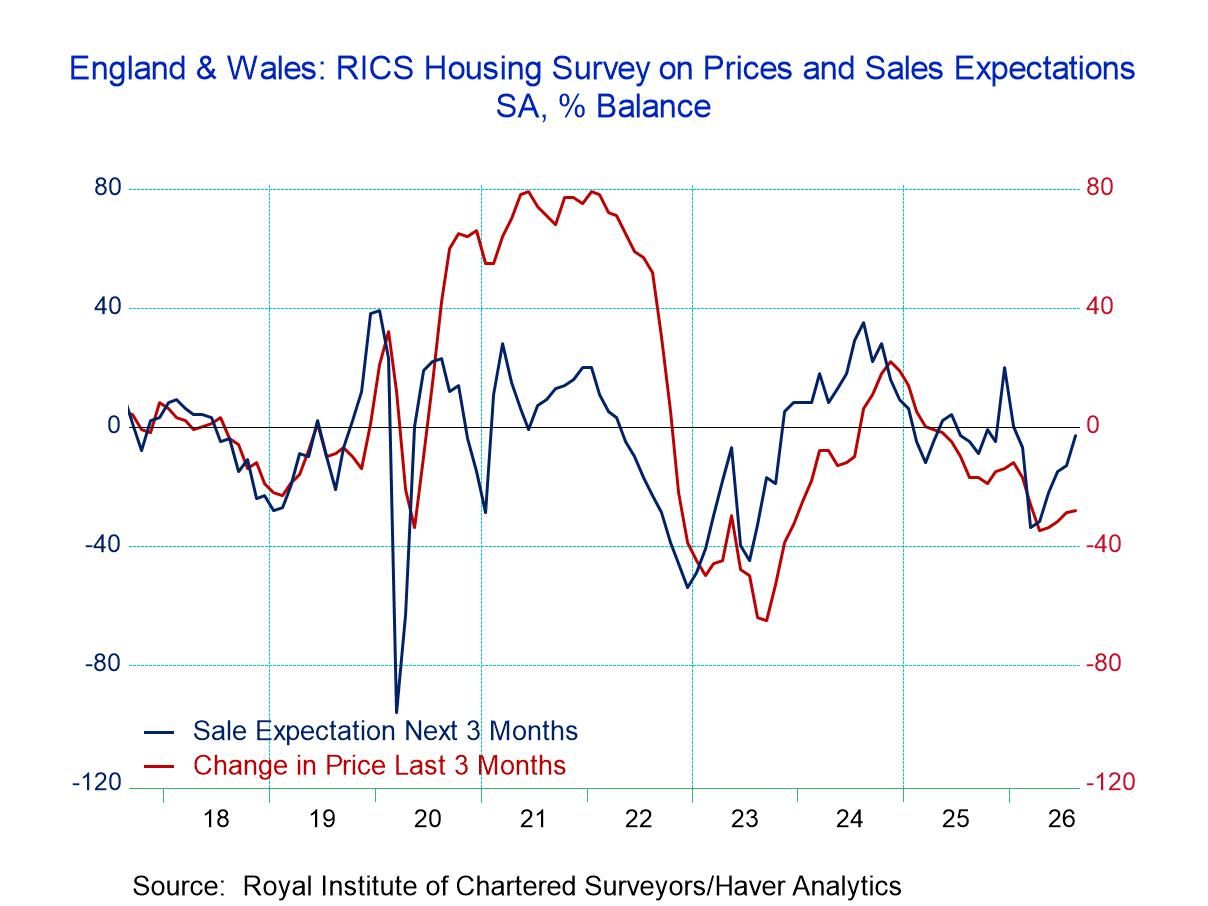
The exhibits in this report feature a graph based on the RICS survey showing U.K. sales expectations for the next three months versus the last three months, while tabular data show Nationwide housing prices and how they are moving month-to-month as well as year-over-year. In addition, the table provides the recent GfK survey results on consumer confidence in the U.K. and presents rankings of housing prices and consumer confidence.
These statistics paint a somewhat mixed picture of the U.K. economy although clearly they paint a picture of an economy that is not firing on all cylinders. The ranking on year-over-year house price changes in the Nationwide survey and the ranking for the GfK consumer confidence index give highly similar relative signals, with both of them around the 30th to 40th percentiles in their historic queues of data extending back to 1992.
Housing prices are still advancing more slowly than they did in previous years. While consumer confidence is still low, it has shown improvement in recent months, and the last two readings showed year-over-year improvement in the monthly data. The RICS chart on the pace of sales shows some improvement, if not yet outright gains. Still, housing conditions are weak, and the question of whether they are limping back into the black, whether prices are holding on for small gains, or whether there is a more solid recovery taking place remain unanswered. So far, at least, it does not look like backsliding.
- of165Go to 1 page