U.S. Durable Goods Orders Flat in August on Nondefense Aircraft Weakness
Summary
- August headline orders unchanged after two straight m/m rises; +8.5% y/y, positive since Jan. ’25 except for May; still up 21.3% from a Nov. ’22 low.
- Nondefense aircraft & parts -4.3% m/m vs. July’s +12.0%.
- Transportation orders -0.6%, third fall in four months; orders ex transp. +0.3%, 16th consecutive m/m increase.
- Core capital goods shipments +0.6%, 11th gain in 12 mths., pointing to a solid contribution to Q3’26 GDP from business equipt. spending.
- Durable goods shipments -0.2% (+8.6% y/y); unfilled orders +0.6% (+8.8% y/y); inventories +0.5% (+3.0% y/y).
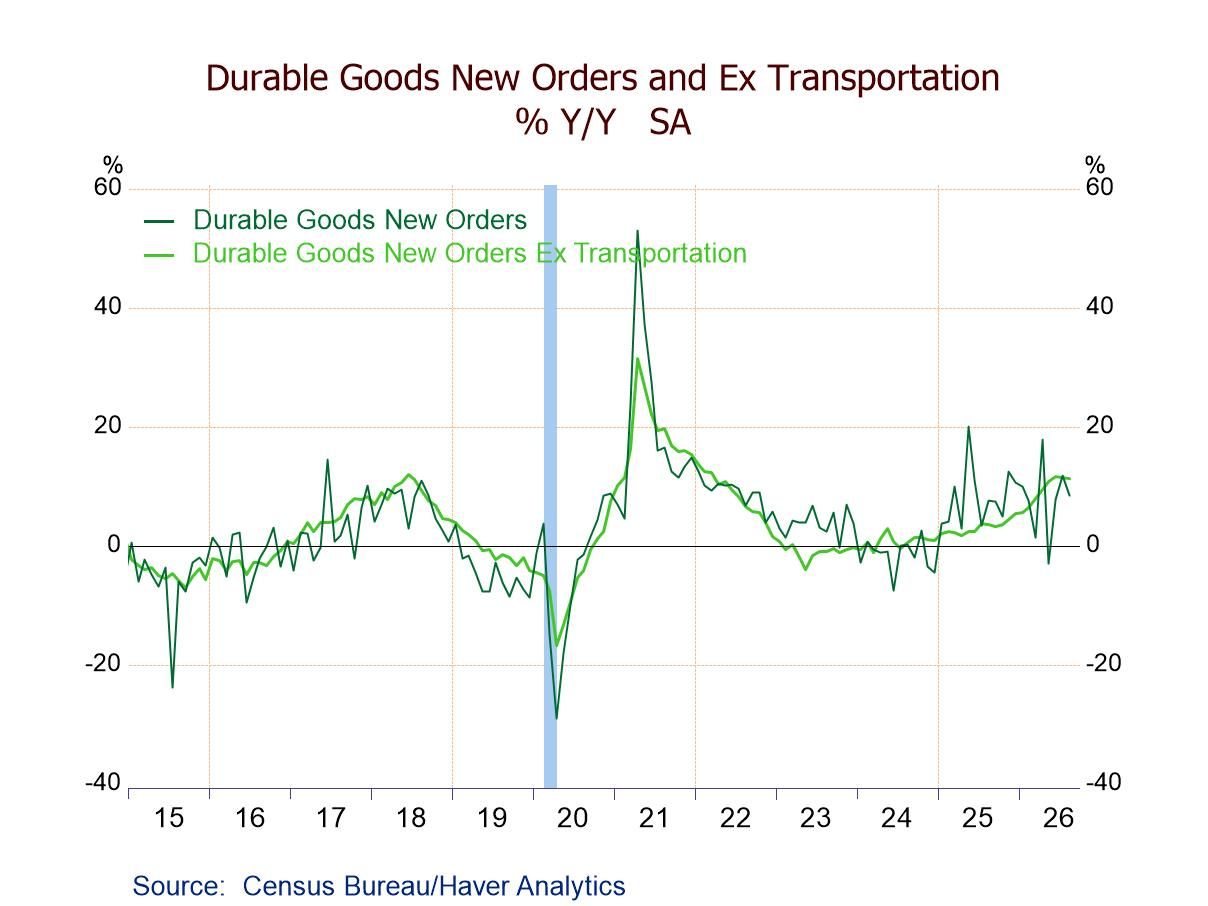
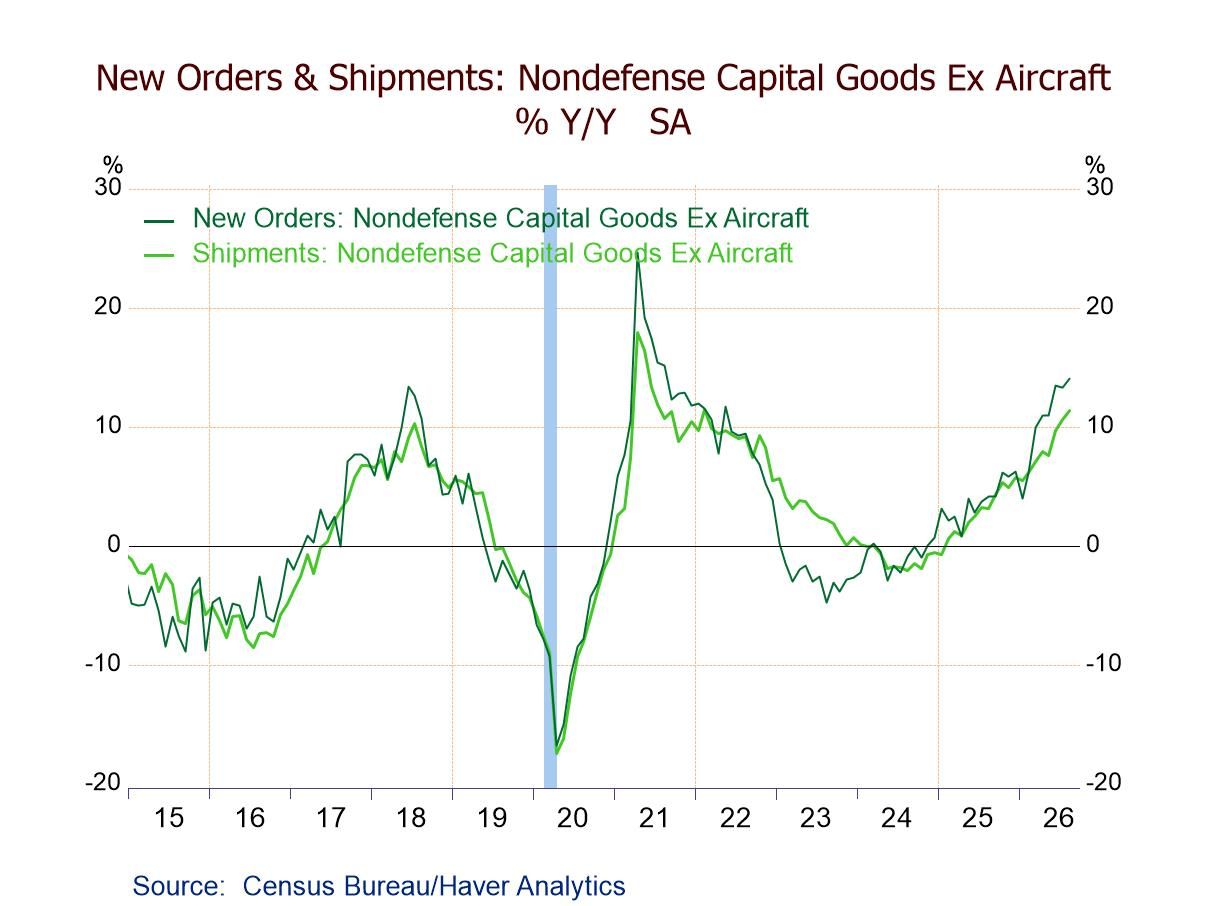
New orders for durable goods were virtually unchanged m/m in August to $338.6 billion after rises of 0.9% in July (+1.1% initially) and 0.6% in June, according to today’s advance report from the U.S. Census Bureau. The Action Economics Forecast Survey had expected a 0.3% m/m August decline. The latest reading was still up 21.3% from a low of $279.1 billion in November 2022. The year-on-year rate decelerated to 8.5% in August from 11.8% in July (7.7% in August 2025), remaining positive since January 2025 except for May (-3.0%). Excluding transportation, durable goods orders grew 0.3% (11.2% y/y) in August, the 16th straight m/m increase, after a 0.7% rise in July. Durable goods orders excluding defense inched up 0.1% (7.9% y/y), the fourth m/m gain in five months, following a 1.4% July advance.
The m/m flat reading in August durable goods orders reflected a 4.3% m/m decrease in orders for nondefense aircraft & parts, following a 12.0% jump in July and a 2.9% decline in June. Orders for defense aircraft & parts rose 5.9% (-9.2% y/y), the first m/m rise since May, after drops of 13.0% in July and 7.0% in June. Orders excluding aircraft edged up 0.1% (11.2% y/y), the ninth successive m/m gain, after a 0.5% July increase.
Durable goods orders for transportation fell 0.6% (+3.4% y/y) in August, the third m/m fall in four months, following a 1.2% gain in July. In addition to August’s m/m decrease in nondefense aircraft orders and rise in defense aircraft orders, motor vehicles & parts orders slid 0.6% (+9.4% y/y) after a 0.8% July rebound. Orders for fabricated metal products dropped 1.3% (+8.6% y/y), down for the second time in three months, reversing a 0.3% July increase. Orders for computers & electronic products were essentially unchanged m/m (+16.5% y/y) following a 0.7% July decline and two consecutive m/m rises. To the upside, orders for primary metals climbed 1.2% (20.1% y/y), up for the ninth straight month, adding to a 2.1% July increase. Machinery orders grew 1.1% (15.1% y/y) on top of a 1.5% July rise, continuing a string of gains since March 2025. Orders for electrical equipment, appliances & components rose 1.1% (7.6% y/y) following a flat July reading and four successive m/m increases. Orders for all other durable goods were up 0.4% (4.0% y/y), the 12th straight m/m gain, after a 0.6% July rise.
Capital goods orders grew 0.7% (10.1% y/y) in August, the fifth m/m rise in six months, following a 0.6% increase in July. Nondefense capital goods orders rose 1.2% (6.0% y/y), up for the fourth time in five months, after a 2.3% July rise. Core capital goods orders (i.e., nondefense capital goods orders excluding aircraft) advanced 1.6% (14.1% y/y), the sixth m/m gain in seven months, following a 0.6% July increase. Defense capital goods orders, however, fell 1.5% (+34.6% y/y), the third m/m decline in four months, after a 6.4% July drop. Notably, core capital goods shipments (core capex shipments)—a reliable coincident indicator of business spending on equipment in the national accounts—rose 0.6% (11.4% y/y), the 11th m/m gain in 12 months, adding to a 1.4% July increase and pointing to a solid contribution to Q3 2026 GDP from business equipment spending.
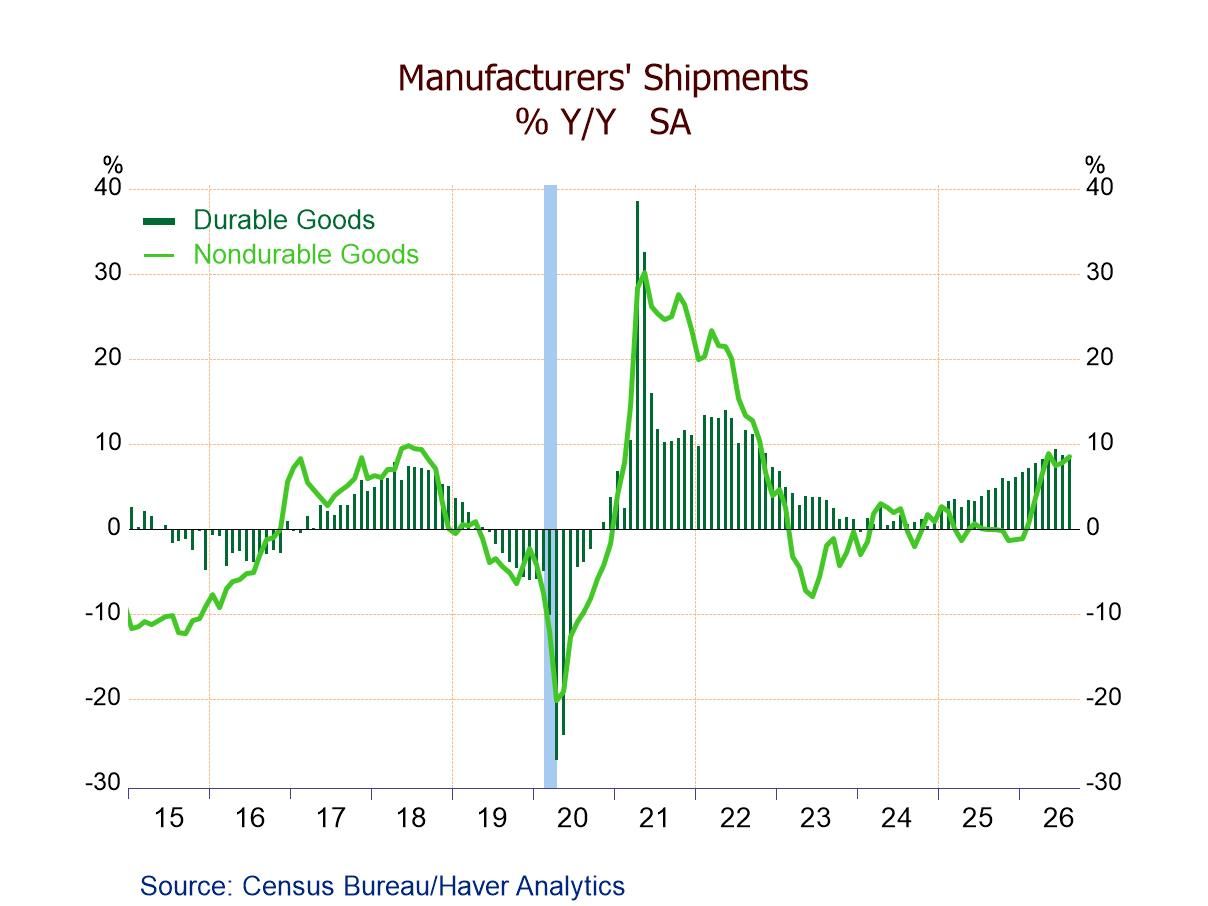
Shipments of all manufactured goods held steady m/m (+8.6% y/y) in August following a 0.8% increase in July and no change in June. Durable goods shipments slipped 0.2% (+8.6% y/y), the first m/m decline since November 2025, after a 0.9% July rise. Nondurable goods shipments increased 0.3% (8.6% y/y), the eighth m/m rise in nine months, building on a 0.6% July gain.
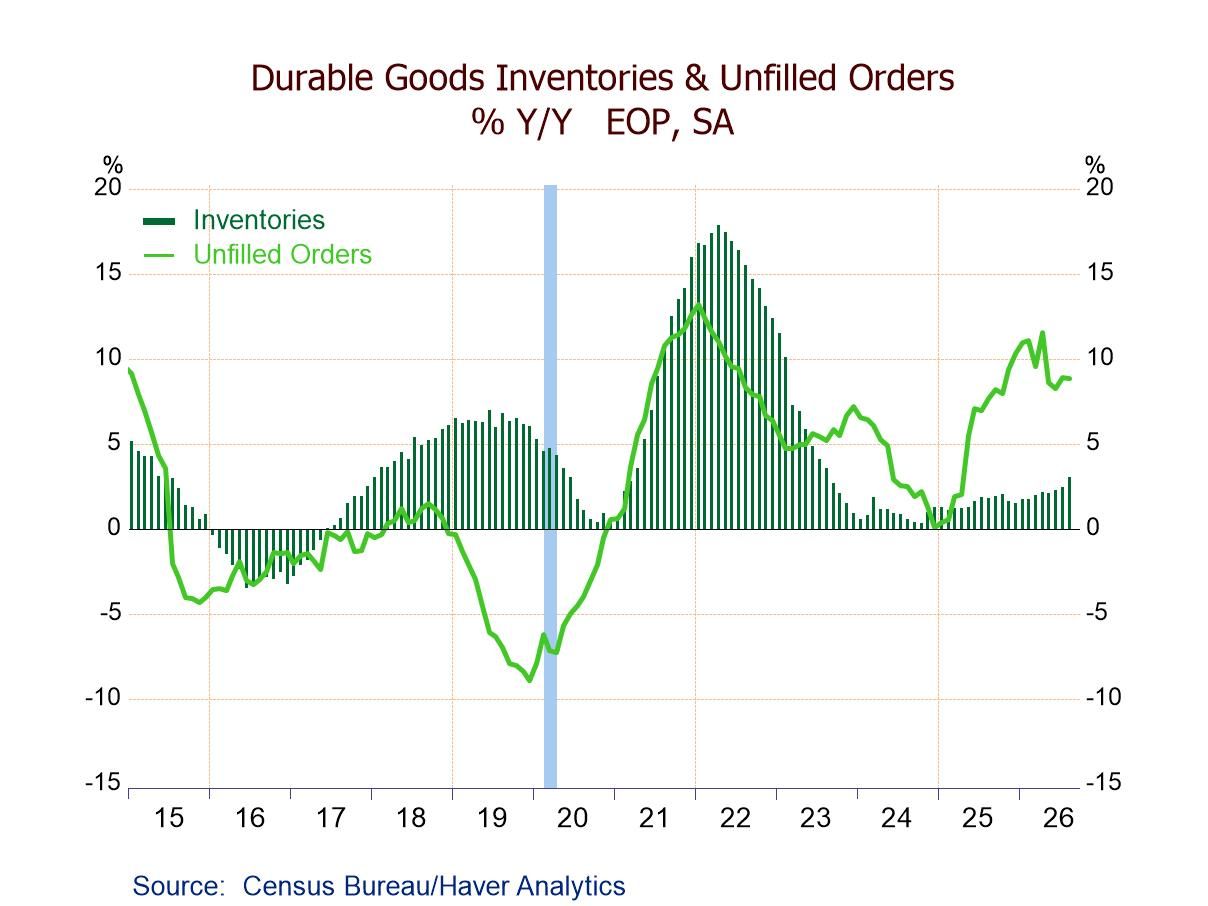
Unfilled orders of durable goods climbed 0.6% (8.8% y/y) in August after rising at the same pace in July and June. Excluding transportation, unfilled orders rose 0.9% (7.1% y/y) after a 1.0% July gain. Both series posted the 13th consecutive m/m increase.
Manufacturing inventories advanced 0.5% (2.6% y/y) in August, up for the 10th month running, on top of a 0.4% rise in July. Durable goods inventories grew 0.5% (3.0% y/y), the 11th straight m/m increase, after rising at the same rate in July. Nondurable goods inventories rose 0.5% (1.9% y/y), up for the sixth time in seven months, following a 0.3% July rebound.
Manufacturers’ orders and shipments of durable and nondurable goods, along with unfilled orders and inventories, are compiled by the U.S. Census Bureau. They are available in Haver’s USECON database. The Action Economics forecast data are in the AS1REPNA database.

Winnie Tapasanun
AuthorMore in Author Profile »Winnie Tapasanun has been working for Haver Analytics since 2013. She has 20+ years of working in the financial services industry. As Vice President and Economic Analyst at Globicus International, Inc., a New York-based company specializing in macroeconomics and financial markets, Winnie oversaw the company’s business operations, managed financial and economic data, and wrote daily reports on macroeconomics and financial markets. Prior to working at Globicus, she was Investment Promotion Officer at the New York Office of the Thailand Board of Investment (BOI) where she wrote monthly reports on the U.S. economic outlook, wrote reports on the outlook of key U.S. industries, and assisted investors on doing business and investment in Thailand. Prior to joining the BOI, she was Adjunct Professor teaching International Political Economy/International Relations at the City College of New York. Prior to her teaching experience at the CCNY, Winnie successfully completed internships at the United Nations. Winnie holds an MA Degree from Long Island University, New York. She also did graduate studies at Columbia University in the City of New York and doctoral requirements at the Graduate Center of the City University of New York. Her areas of specialization are international political economy, macroeconomics, financial markets, political economy, international relations, and business development/business strategy. Her regional specialization includes, but not limited to, Southeast Asia and East Asia. Winnie is bilingual in English and Thai with competency in French. She loves to travel (~30 countries) to better understand each country’s unique economy, fascinating culture and people as well as the global economy as a whole.
More Economy in Brief
 Global