Global| Sep 24 2026
Charts of the Week: Narrow Shoulders
by:Andrew Cates
|in:Economy in Brief
Summary
Financial markets have spent this week weighing whether this year's energy shock has passed its peak, and have changed their minds more than once. Brent slipped below $99 as Hormuz shipments were reported recovering and Gulf leaders gathered in New York, only to recover above $100 within a day. The relief in the energy market has proved neither durable nor shared by the bond market. The Federal Reserve raised rates last week for the first time in three years, the ECB has tightened alongside it and the Bank of Japan has moved again, leaving ten-year Treasury yields at levels last seen in 2007 and Bunds at seventeen-year highs. This week’s flash purchasing managers’ surveys help explain the discomfort, with European supply chains lengthening once more as dry bulk freight rates climb (chart 1). The aggregate global growth picture has nonetheless held up better than the geopolitics would imply, though the latest Blue Chip consensus survey continues to suggest that this resilience is concentrated in only a small group of semiconductor exporters rather than shared across the world economy (chart 2). Part of the explanation for the wider containment lies in the oil balance, where a drawdown in stocks without precedent in the available record has substituted for the spare capacity that once cushioned disruptions of this kind (chart 3), and part lies in the character of the commodity shock itself, which now has at least three unrelated sources (chart 4). Labour markets are where the strain has begun to show, and it is showing very unevenly across the advanced economies (chart 5). In European bond markets, meanwhile, the consequences have turned political, with the premium demanded on French debt over German reaching levels not seen since the euro crisis (chart 6).
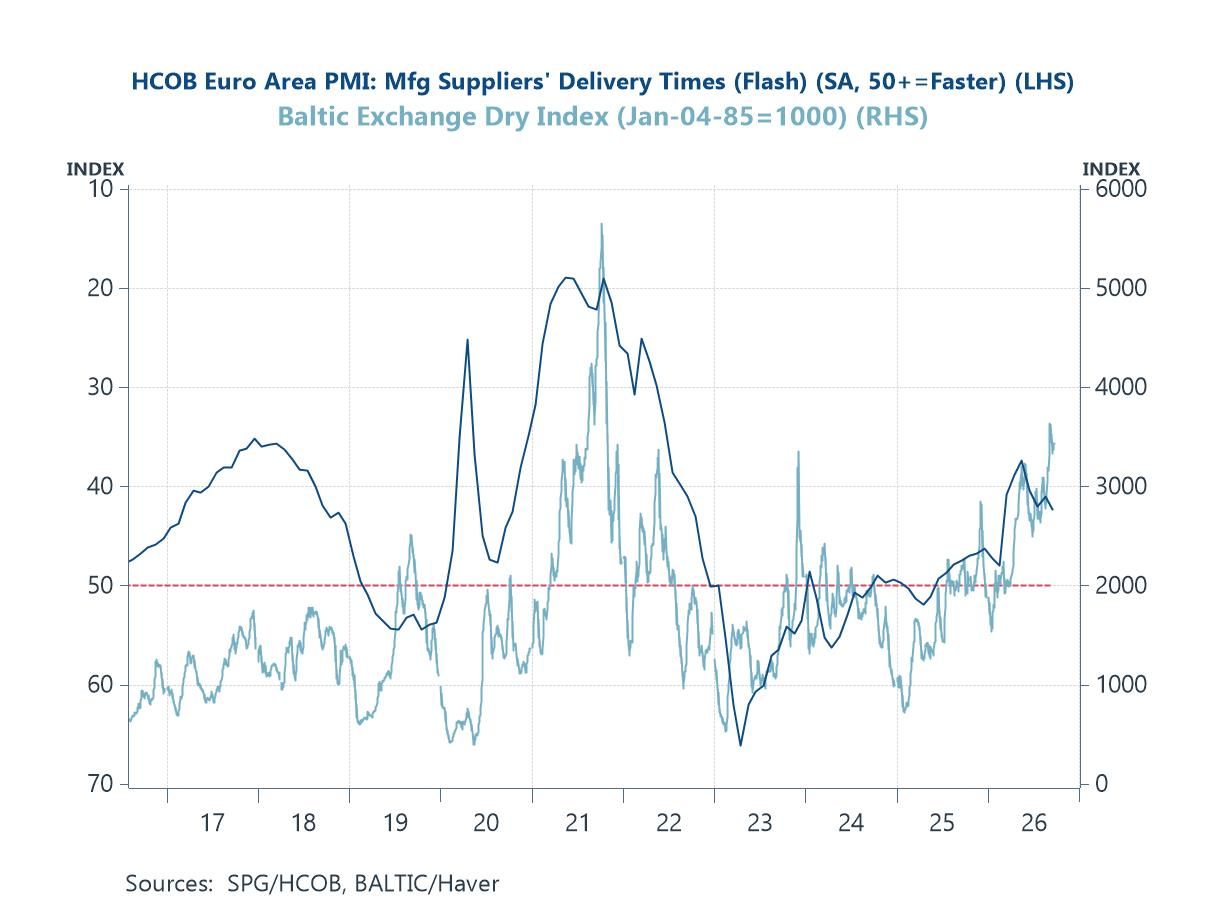
The Plumbing Tightens Again Euro area manufacturers reported a further lengthening of suppliers’ delivery times in this week’s flash survey, taking the index to its most stretched since the disrupted trading conditions of 2022. Dry bulk freight rates have risen in step, and the coincidence is not accidental. Neither series is signalling strong demand. Vessels diverted away from Bab el-Mandeb and the Gulf are sailing considerably further to deliver the same cargo, which absorbs tonnage, extends voyage times and tightens the freight market without any increase in the volume of goods actually being moved. Manufacturers meet the same phenomenon as delay, and respond by ordering earlier and holding more, which tightens it further. Delivery times of this kind fed producer prices with a lag of two to three quarters after 2021, and there is little reason to expect a different sequence now. The more awkward feature for firms building plans for next year is that the friction is a function of route length rather than of order books, so it will not ease simply because activity slows.
Chart 1: Euro Area Manufacturing Delivery Times and Dry Bulk Freight Rates
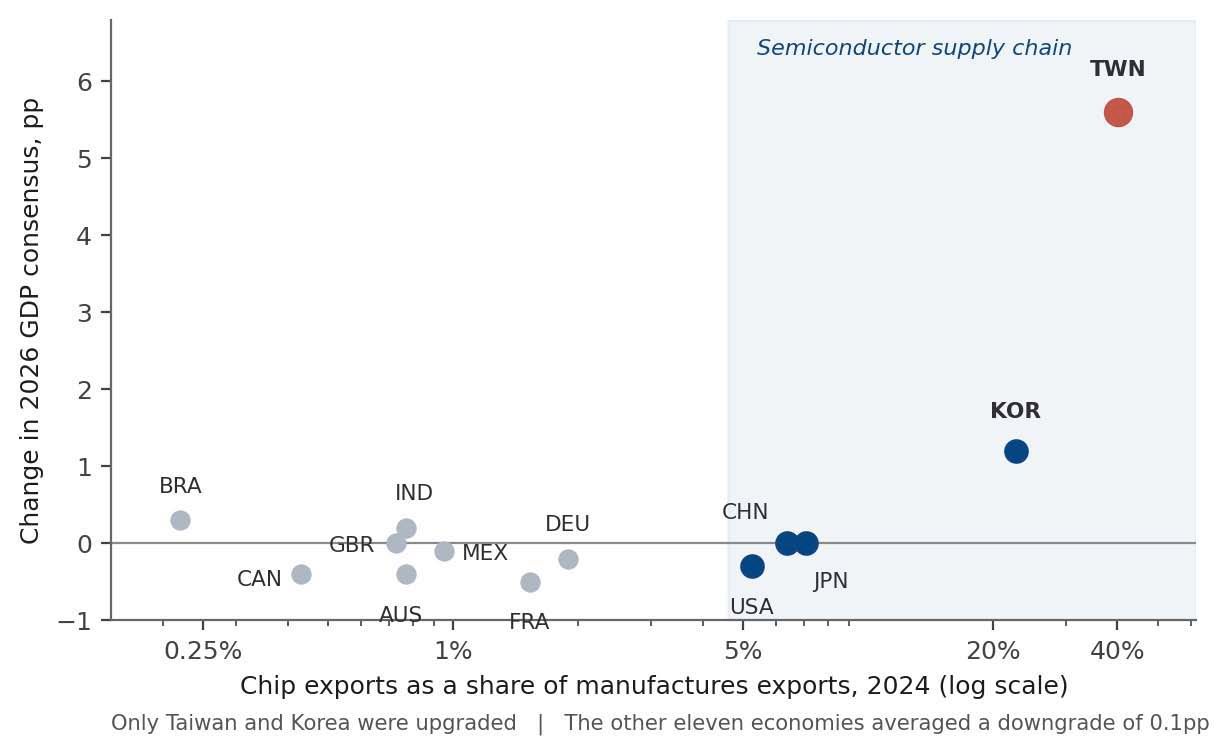
A Very Narrow Base Consensus forecasts for growth this year have been marked down only modestly since February, which looks surprising set against six months of disrupted energy supply. The aggregate conceals an unusual degree of dispersion. Economies at the centre of the semiconductor supply chain have been upgraded substantially, Taiwan by several percentage points and Korea by more than one, on the strength of an investment boom in artificial intelligence whose physical apparatus they build. Almost everywhere else the revisions run from flat to negative, with Germany, France, Canada and Australia absorbing the energy shock without any equivalent windfall. Strip the chip exporters out and the world number reads considerably worse. That matters for anyone using the global aggregate as an input, because this year it carries less information about the typical economy than usual, and the handful of observations doing most of the work are levered to a single investment cycle.
Chart 2: Semiconductor Export Exposure and Revisions to 2026 Growth Forecasts
Sources: Blue Chip Economic Indicators, WTO and Haver Analytics
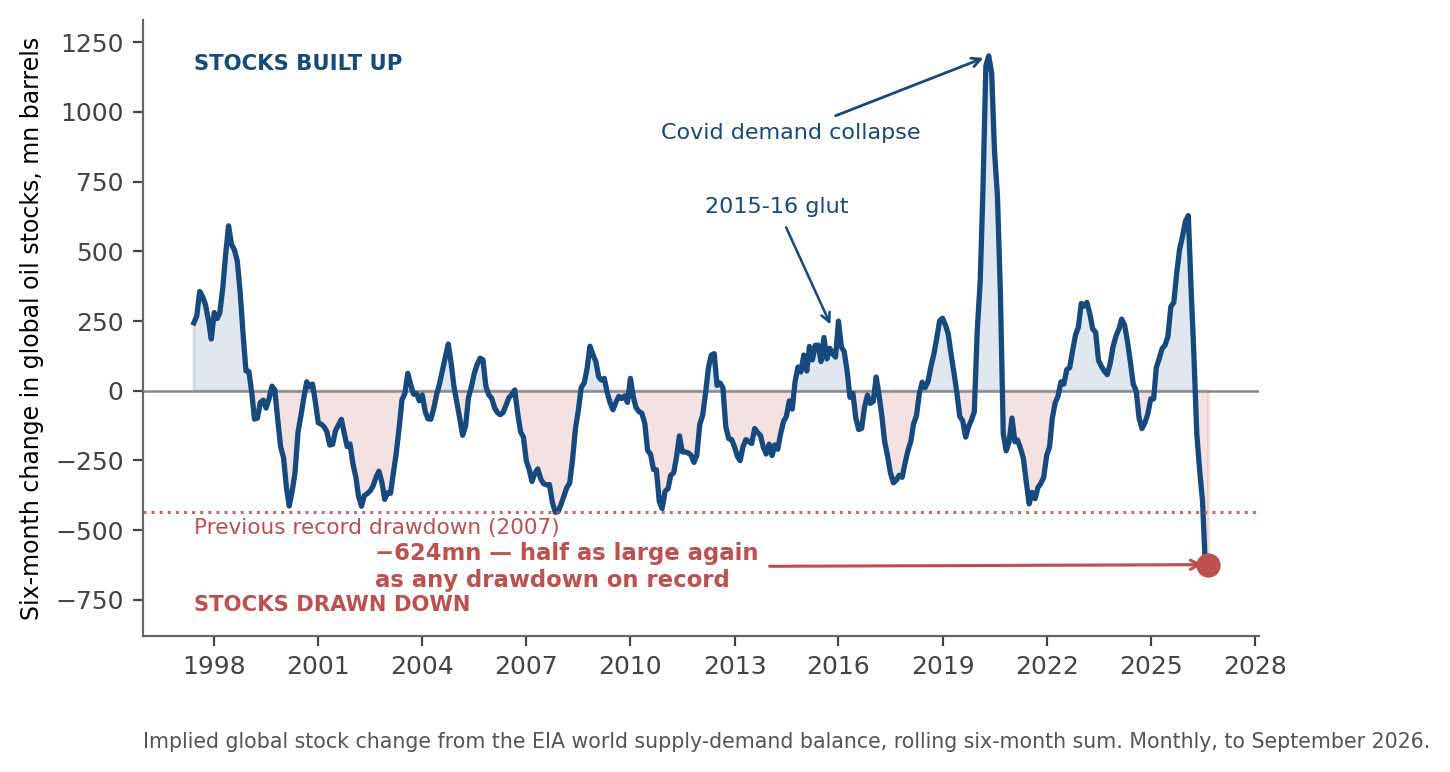
Spending the Buffer The world has kept itself supplied with fuel through six months of disruption by drawing on the oil it had already stored, and the scale of that drawdown has no parallel in the available record. The starting position helped, since stocks were built up rapidly through late 2025 and the conflict arrived with storage unusually full. Two things follow. Inventories are a stock rather than a flow, and can be run down only once. And the apparent mildness of the macroeconomic damage so far has been bought with a buffer that is now largely spent, which leaves the system materially less able to absorb whatever arrives next. Some caution is warranted in reading the series, since implied stock change is the residual between estimated world supply and estimated world demand and therefore collects the measurement error in both. Neither the direction nor the magnitude is easily dismissed on those grounds.
Chart 3: Six-Month Change in Global Oil Stocks
Sources: US Energy Information Administration and Haver Analytics
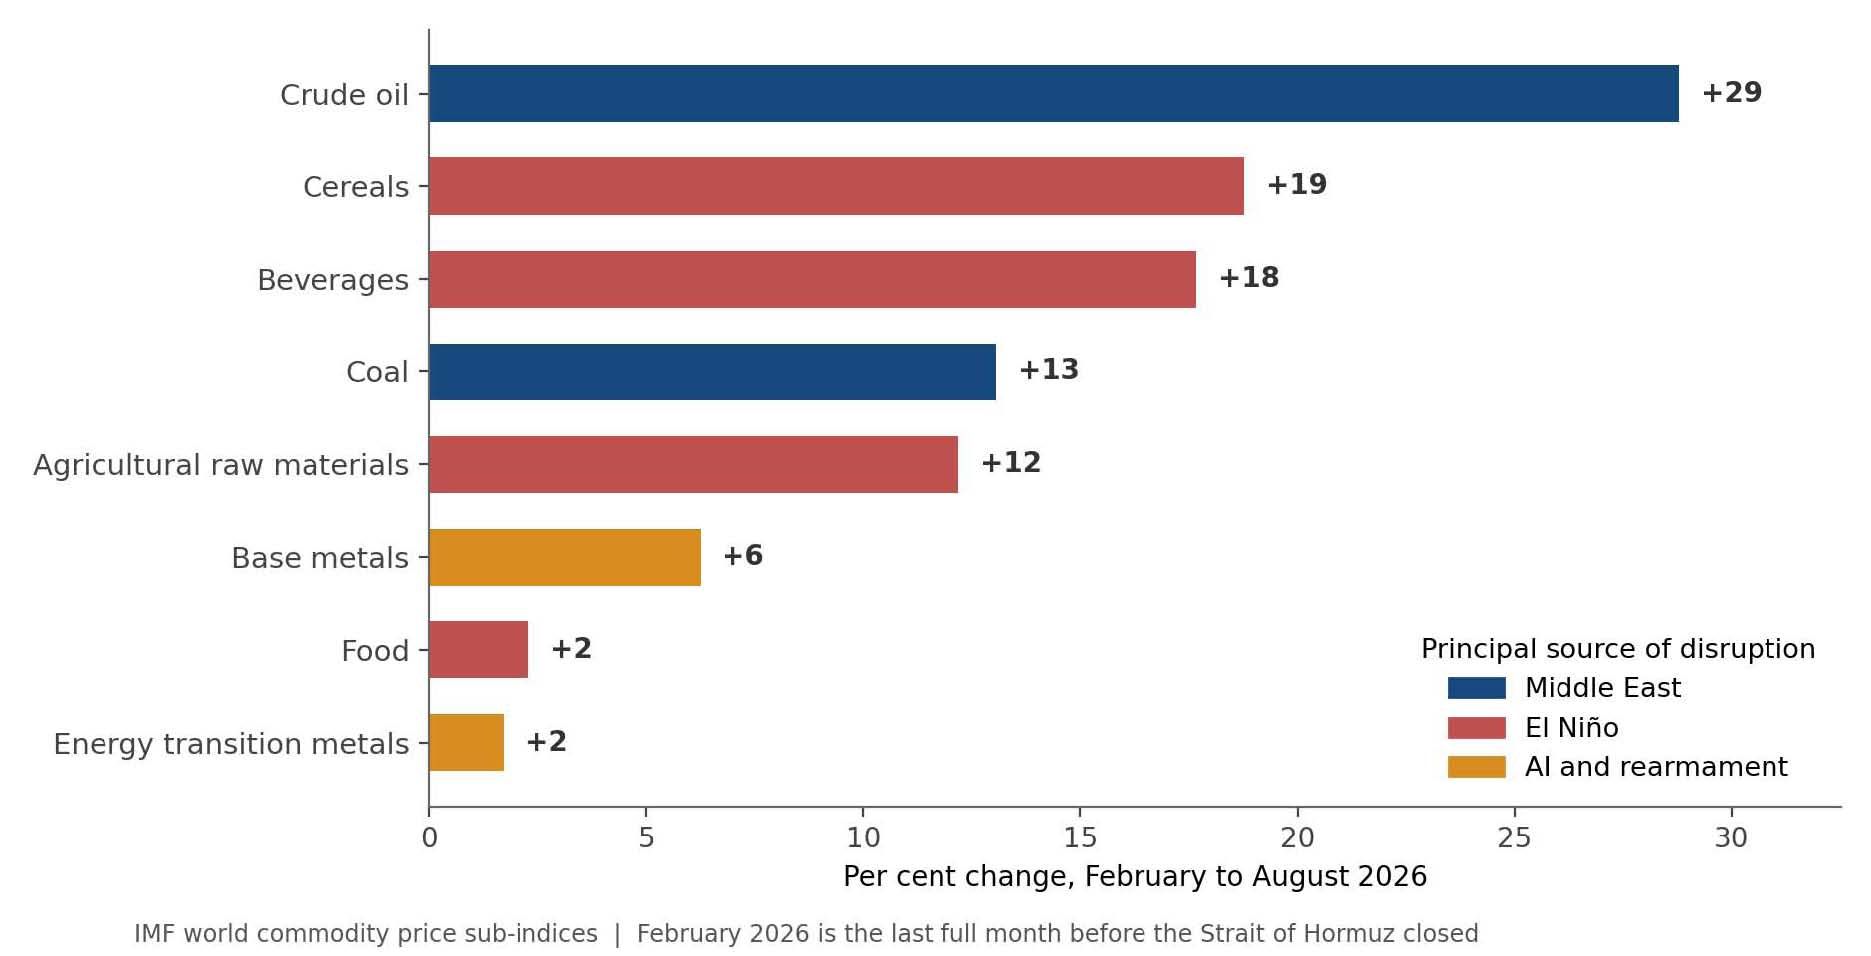
Three Disturbances at Once Central banks are usually content to look through a commodity shock, and the justification for doing so rests on an assumption that the move will reverse. What has happened since February fits that description less well than usual. Crude and coal have risen because of the Middle East. Cereals, beverages and agricultural raw materials have risen because the World Meteorological Organization put the odds of an El Niño event near ninety per cent at the beginning of June, and West Africa, Southeast Asia and eastern Australia all dry out during the warm phase. Base metals have risen because artificial intelligence and rearmament have made them contested. Three disturbances of broadly comparable size, with different origins and little correlation between them, are therefore running at the same time. That is not a commodity cycle, in which the complex rises and falls together and a policymaker can reasonably wait. It is a queue of supply failures, each arriving before the last has cleared the annual comparison, and a queue is considerably harder to distinguish from a persistent inflation problem — for the policymaker, and for the public whose expectations the policymaker is trying to anchor. Assigning each sub-index to a principal source is a judgement rather than a decomposition, but the point about correlation survives any reasonable redrawing of the categories.
Chart 4: Commodity Price Changes Since February by Principal Source of Disruption
Sources: IMF and Haver Analytics
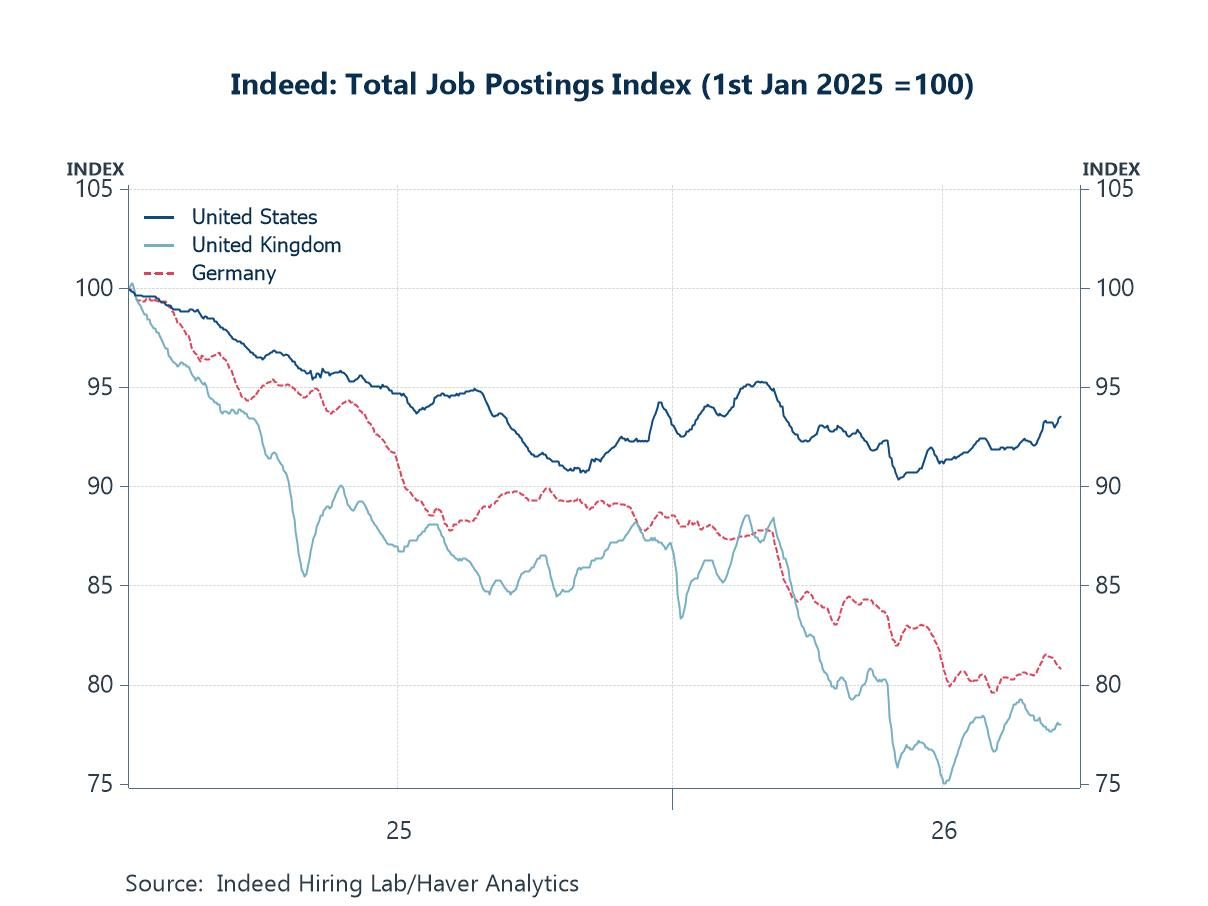
Where the Strain Registers Labour demand is the clearest evidence so far that the shock has reached the real economy, and it has reached it selectively. Online job postings in the United States drifted lower through last year but have stabilised and turned modestly higher since the spring. In the United Kingdom and Germany they have kept falling, and the British decline has been steep enough to leave postings far below where they began 2025. The official statistics point the same way. German unemployment has been above three million for most of this year, with the Federal Employment Agency describing labour demand as weak even as fiscal policy turns sharply expansionary, while British recruiters have reported falling permanent placements for months. The divergence follows the distributional logic of an energy shock. Economies that import their energy have transferred real income to those that produce it, and firms facing higher input costs and an uncertain demand outlook adjust first by not hiring rather than by dismissing, which is why the deterioration shows up in postings well before it shows up in unemployment. Loosening of this kind would ordinarily argue for easier policy. With the inflation coming from the supply side, it has not.
Chart 5: Online Job Postings in the United States, United Kingdom and Germany
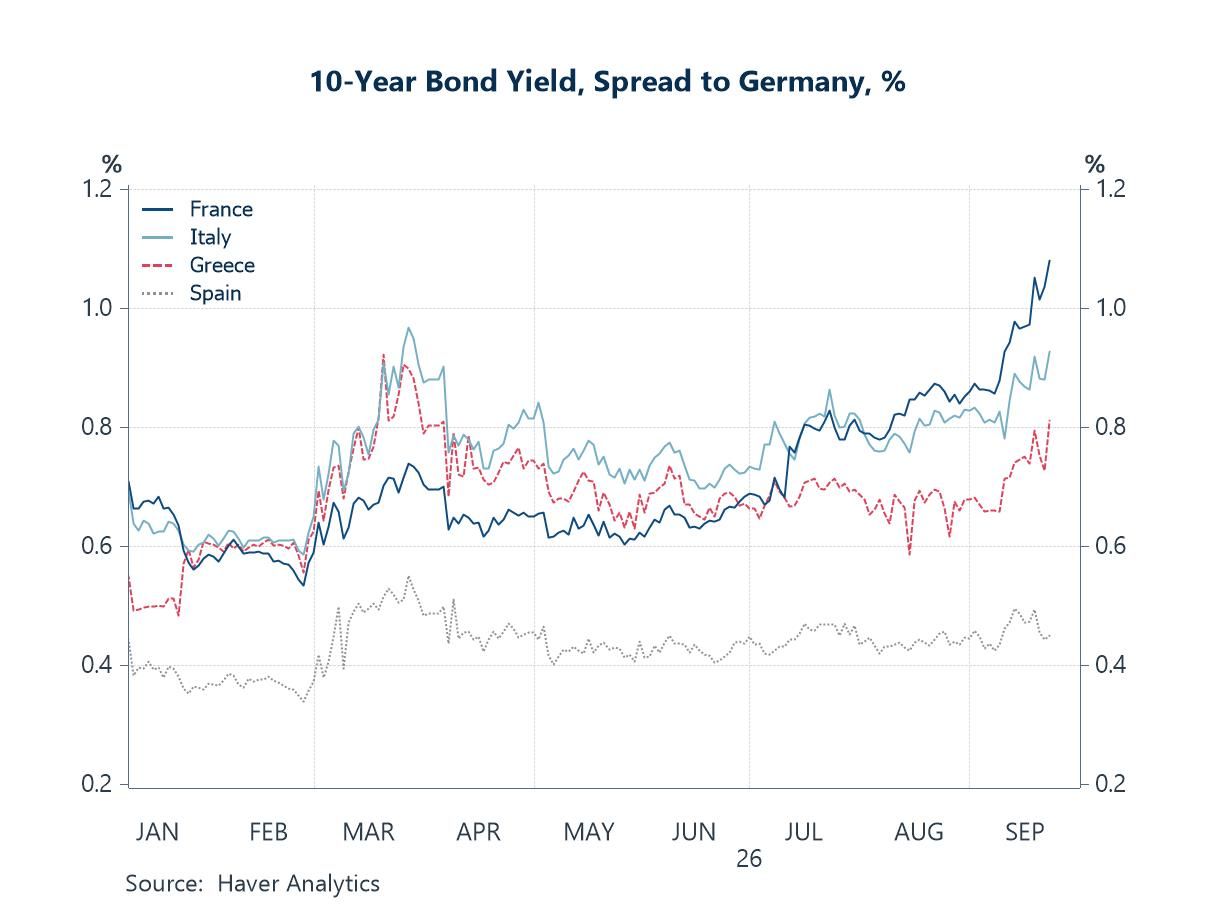
France Steps Away from the Core The French premium over Bunds crossed one hundred basis points last week for the first time since the euro crisis of 2011 and 2012, and it now trades wider than Italy’s. Spain, once the standard measure of peripheral stress, sits at less than half the French spread, and that reordering of the currency union’s credit hierarchy is the more telling development. The proximate cause is domestic. Public debt has reached around 119 per cent of output, the deficit remains close to twice the European ceiling, and the Lecornu government is attempting a consolidation of some fifty-four billion euros through a parliament that has already censured two of its predecessors, with a draft budget due at the end of this month. With a presidential election in 2027 and no obvious centrist majority beyond it, what investors are pricing is not the arithmetic of the deficit but the political capacity to act on it. The German side of the spread is no longer still either. Bunds stand at seventeen-year highs, reflecting a borrowing programme that runs to a five-hundred-billion-euro infrastructure fund and defence spending exempted from the debt brake above one per cent of output, and German politics has itself become much less predictable.
Chart 6: Ten-Year Government Bond Spreads to Germany

Andrew Cates
AuthorMore in Author Profile »Andy Cates joined Haver Analytics as a Senior Economist in 2020. Andy has more than 25 years of experience forecasting the global economic outlook and in assessing the implications for policy settings and financial markets. He has held various senior positions in London in a number of Investment Banks including as Head of Developed Markets Economics at Nomura and as Chief Eurozone Economist at RBS. These followed a spell of 21 years as Senior International Economist at UBS, 5 of which were spent in Singapore. Prior to his time in financial services Andy was a UK economist at HM Treasury in London holding positions in the domestic forecasting and macroeconomic modelling units. He has a BA in Economics from the University of York and an MSc in Economics and Econometrics from the University of Southampton.
More Economy in Brief
 Global| Sep 23 2026
S&P PMIs Five of Seven Early Reporters Show Stronger Output in September
U.K. Housing Surveys and Consumer Sentiment Support the View of Weak Growth