Asia| Sep 21 2026
Economic Letter from Asia: Held in Reserve
This week, we assess whether Asia is really moving away from the dollar by examining its US asset holdings, reserves, gold purchases and trade settlement. We then turn to Japan’s monetary normalisation. Asia’s presence in US portfolio markets has declined since the early 2010s (chart 1). Japan's share of foreign holdings of US long-term securities has halved, and mainland China's has fallen further still. The euro area and the UK have absorbed most of that ground. Even so, Japan is still the largest foreign holder of Treasuries, and a reshuffling among creditors need not mean an exit from dollar assets. Official reserves tell a similar story (chart 2). The dollar's share is down close to 6 percentage points over eight years, to 57.1%, yet no single currency has picked up all of it. The residual group of other currencies gained most, which points to diversification rather than substitution. Gold fits that reading (chart 3), with Singapore, India, Thailand and China all adding heavily in volume terms. Reserve growth alone may explain part of the rise. Trade settlement has moved least of all (chart 4). South Korea still settles about 84% of exports and 79% of imports in dollars, and broader studies point the same way. Moving to Japan, the central bank raised its policy rate to 1.25% last week, with Governor Ueda striking a hawkish note (chart 5). The spread to Fed, ECB and Bank of England policy rates has narrowed to about 2 percentage points. The yen, meanwhile, has rebounded from a record low after coordinated intervention, while the 10-year JGB yield has touched 3% (chart 6).
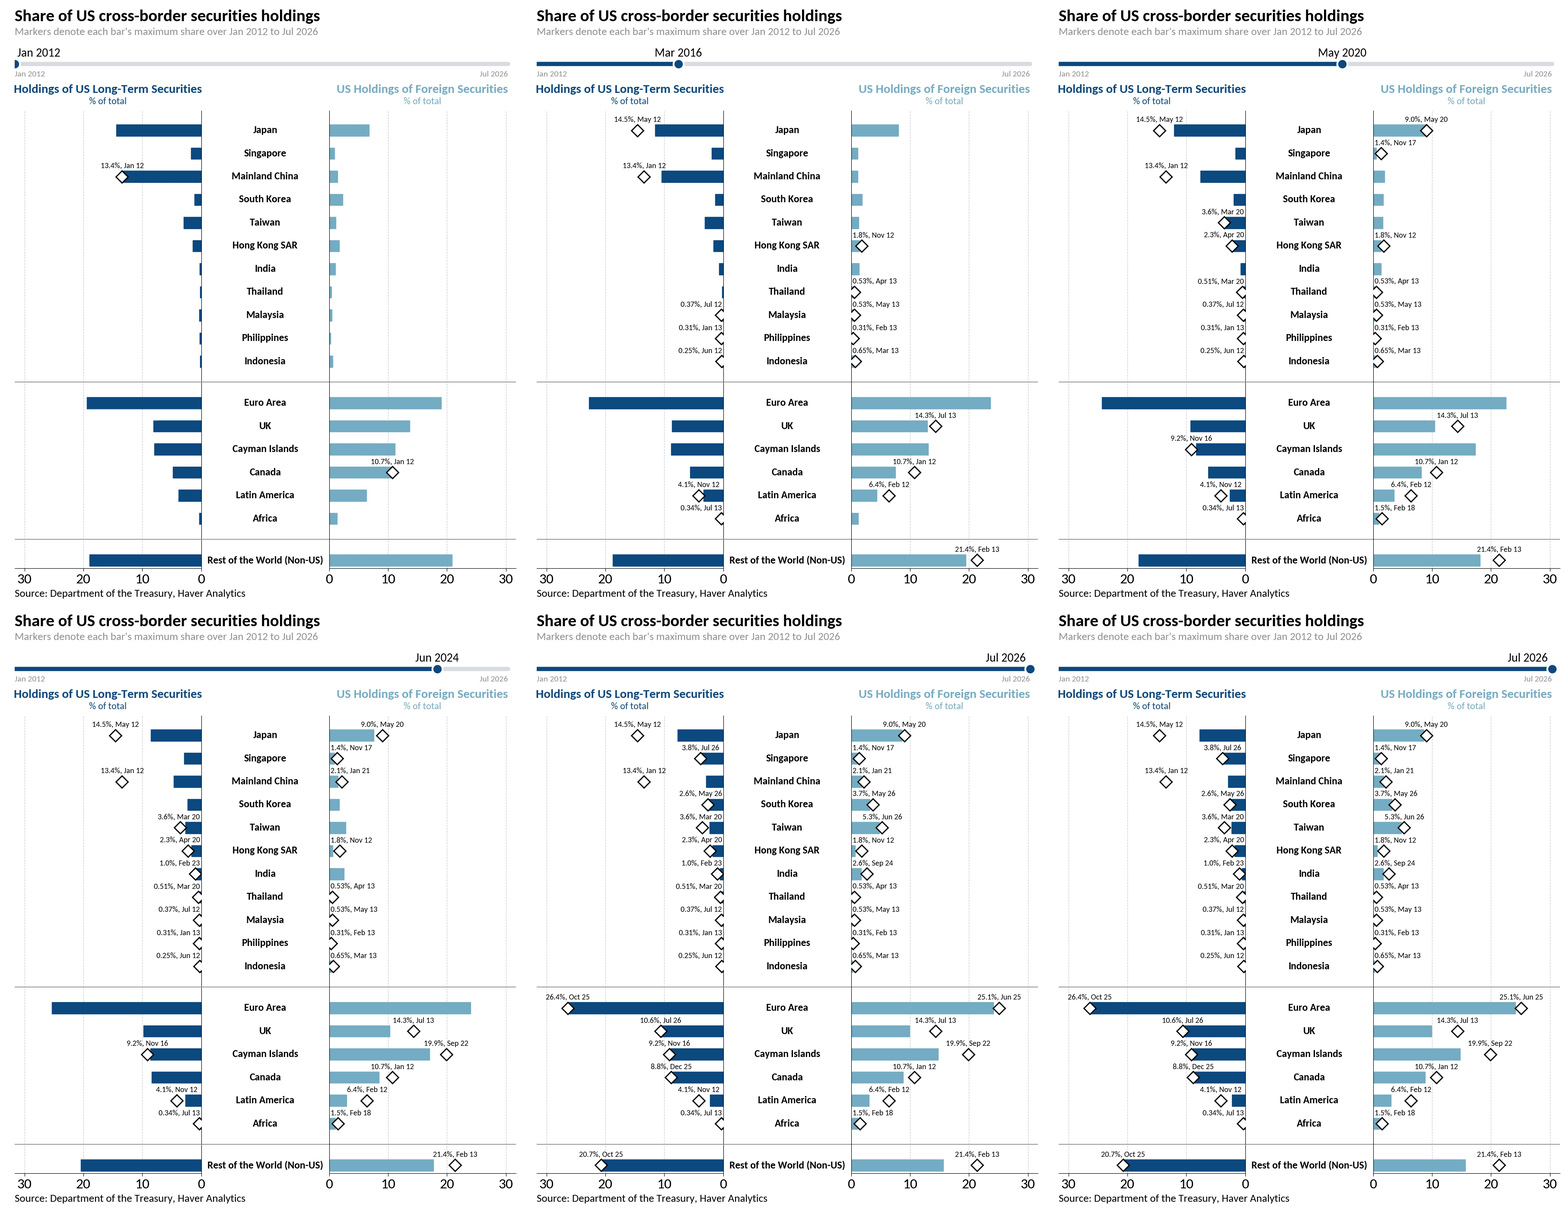
Gold, the US, and the US dollar Asia's footprint in US portfolio markets has thinned considerably since the early 2010s (chart 1). Japan's share of overall foreign holdings of US long-term securities has roughly halved, from a peak near 14.5% in 2012 to about 8% in July 2026. Mainland China's slide is starker, from 13.4% at the start of 2012 to roughly 3%. The euro area has absorbed most of that ground, rising from about 19% to around 26%, while the UK sits at a record 10.6%. Japan nonetheless remains the largest foreign holder of Treasuries at USD 1.1tn, while China's holdings have slipped to USD 618bn, the lowest since September 2008. A reshuffling among creditors is not always the same as an exit from dollar assets. Japan also remains Asia's largest holder on both sides of the ledger, accounting for about 8.6% of US holdings of foreign securities.
Chart 1: Share of US cross-border securities holdings
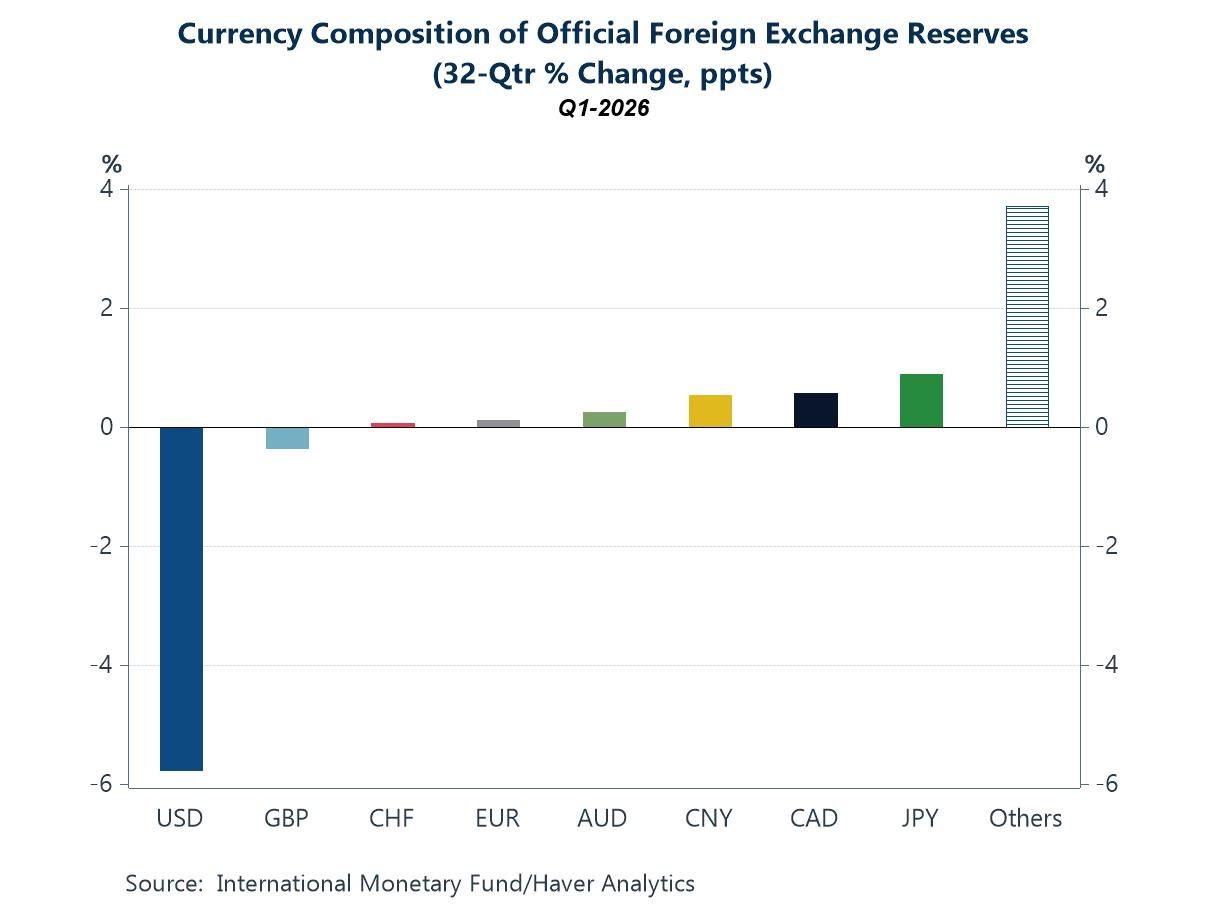
The de-dollarisation debate has a second front in the currency composition of official reserves (chart 2). The dollar's share has fallen by close to 6 percentage points over the past eight years, to 57.1% in the first quarter of 2026. The more revealing question is where that share went. No single currency has picked up all of it. The yen gained less than 1 percentage point, the Canadian dollar and the renminbi around half a point each, while the euro barely moved. The largest beneficiary was the residual group of other currencies, up some 3.7 points. That looks like diversification rather than a search for one alternative, and the renminbi's 2.0% share underlines the point.
Chart 2: Currency composition of official foreign exchange reserves
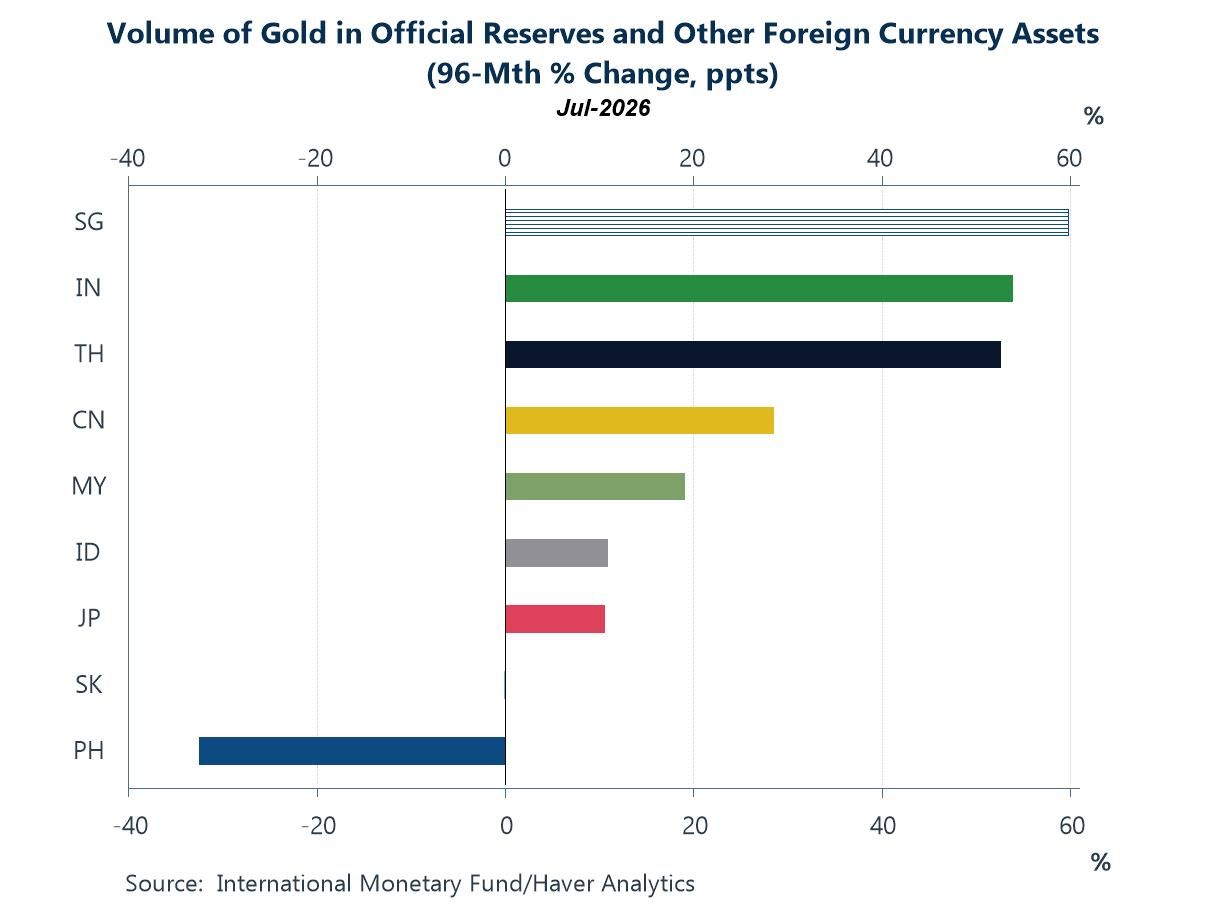
The same message shows up in gold, where volumes rather than values are the cleaner measure (chart 3). In volume terms, Singapore has added more than 60% to its holdings over the past eight years. India and Thailand are up by more than half, and China by close to 30%. Japan, Indonesia and Malaysia have made smaller additions, while the Philippines has cut its stock by about a third over two major bouts. Exceptions aside, and given the seemingly concerted accumulation of gold among Asian central banks, diversification is one reading. A simpler explanation, which may hold at the same time, is that reserves have grown overall, and gold holdings have had to rise in proportion.
Chart 3: Volume of gold in official reserves and other foreign currency assets
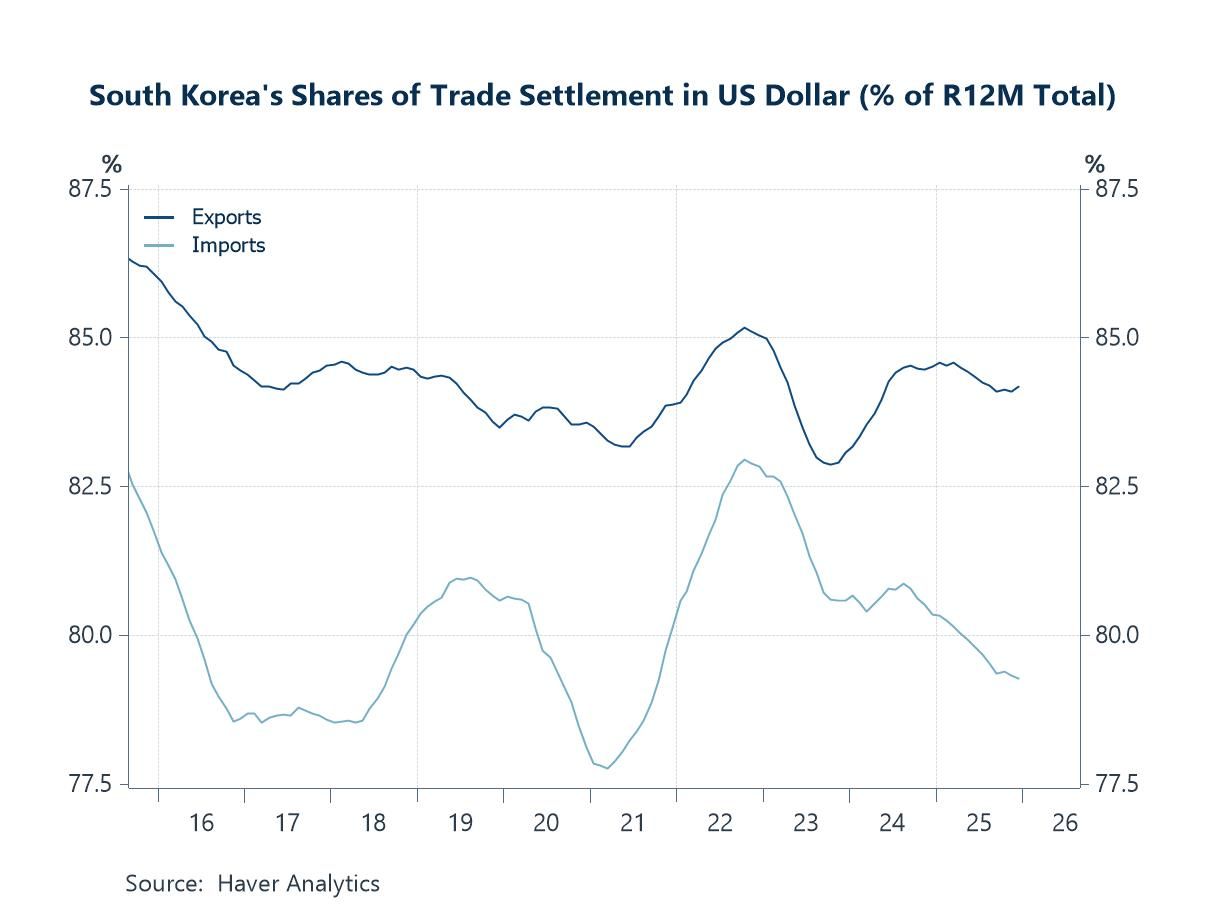
South Korea and trade settlement Holdings are only part of the picture. Trade settlement, dollar funding and hedging practice matter just as much, and they shift far more slowly. South Korea, one of Asia's most important trade nodes, still settles about 84% of its exports and 79% of its imports in dollars (chart 4). The export share has barely budged in a decade. The import share has drifted down from a 2022 peak near 83%, but the decline is muted and remains within its ten-year range. South Korea is only one case, though broader work, including recent IMF studies, points the same way. The dollar's continued dominance in trade settlement does not chime with the de-dollarisation narrative.
Chart 4: South Korea shares of trade settlement in US dollar
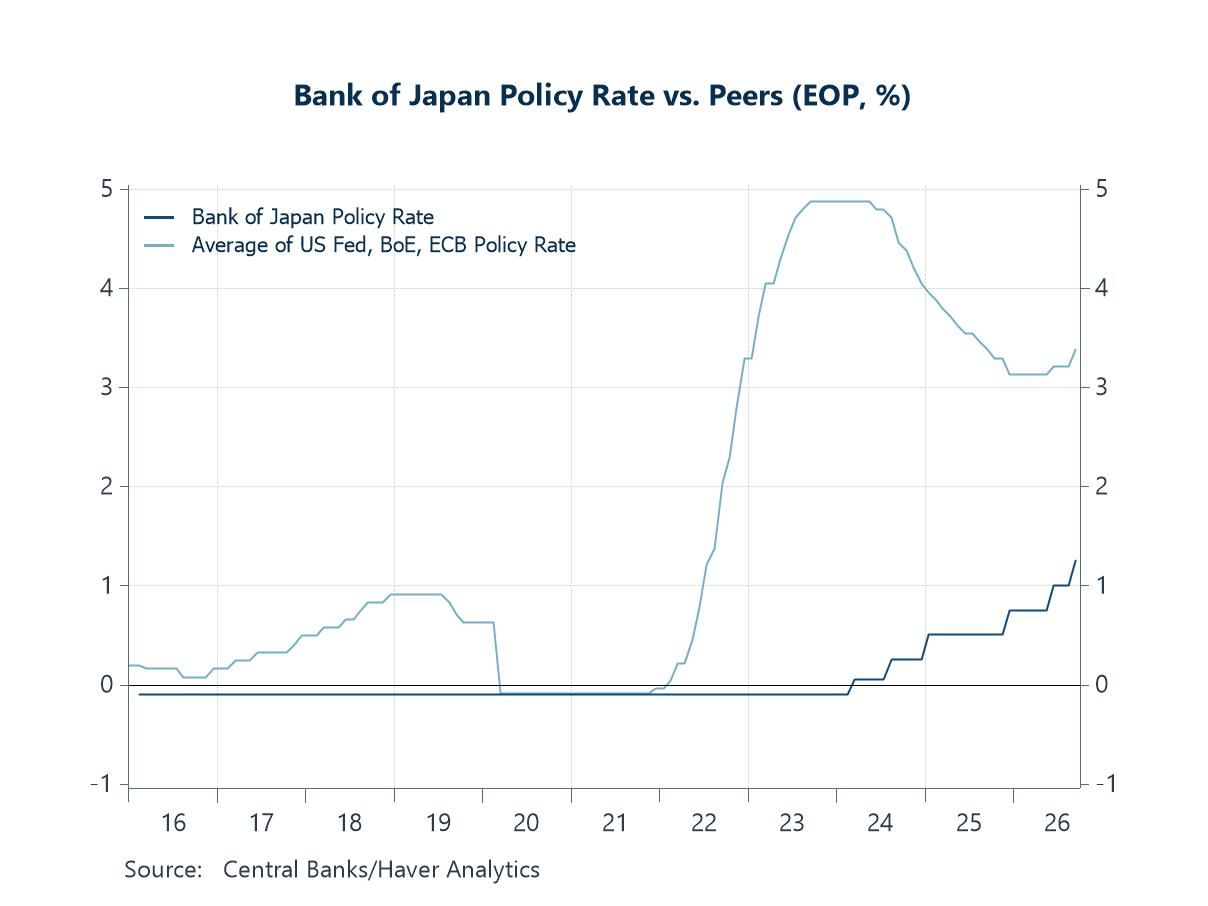
Japan Turning to Japan, the central bank (BoJ) lifted its policy rate by 25 basis points to 1.25% last week (chart 5). Two details stand out. The vote was split 7 to 2, with Asada and Sato, both appointed this year, preferring to hold at 1%. Governor Ueda also struck a hawkish note. He said the BoJ should act pre-emptively rather than be forced into rapid hikes later. He added that the price trend is close to the bank's 2% target, and that authorities must ensure inflation does not overshoot. Even so, Japan remains the outlier among major central banks, though less of one than before. The gap to the average policy rate of the Fed, the ECB and the Bank of England is about 2 percentage points. That gap stood near 5 points in early 2024. The average is rising again, with the Fed and the ECB both tightening this month.
Chart 5: Japan’s policy rate vs. peers
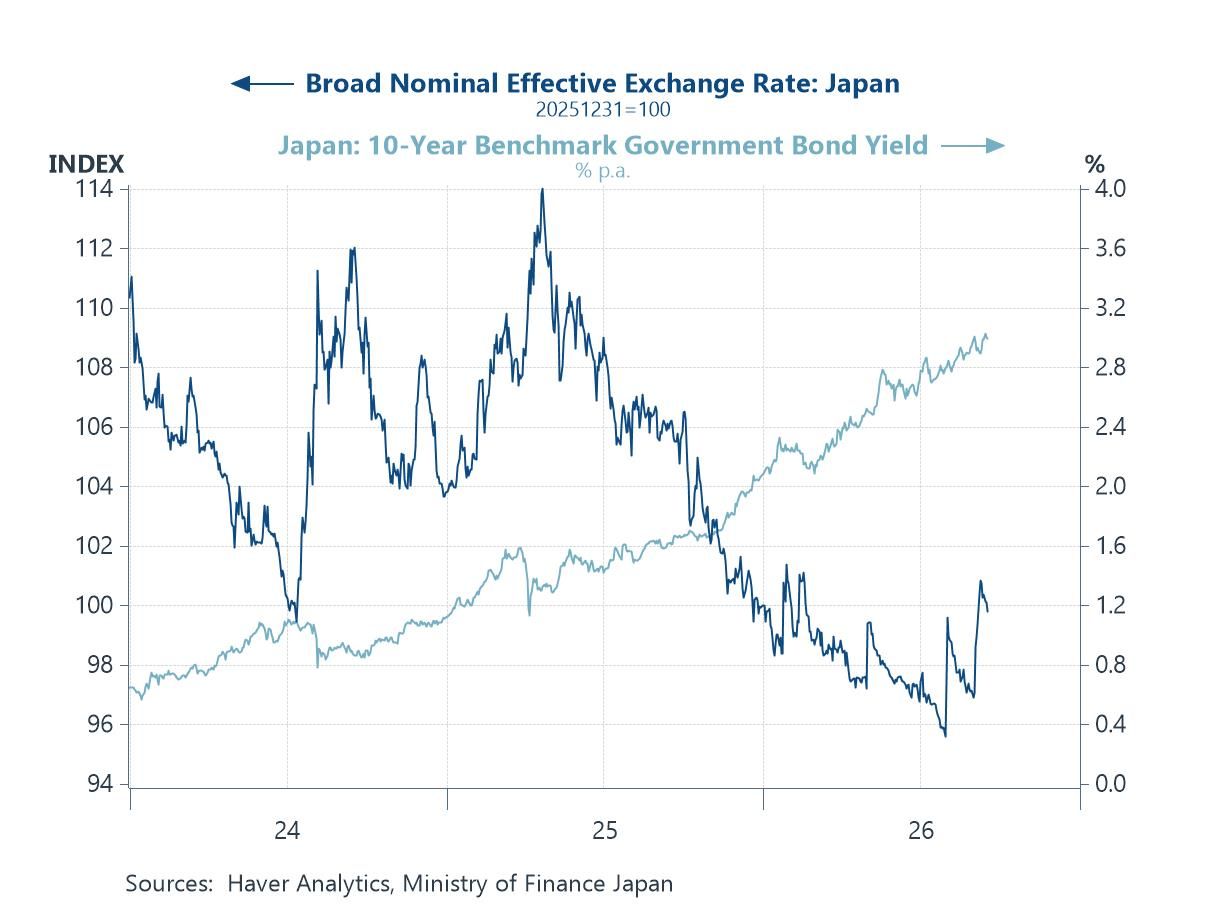
Turning to the yen, the currency's recent rebound has been abrupt (chart 6). On a trade-weighted basis, it weakened at the end of July to a record low, based Haver’s proprietary calculations. It has since regained about 4% to 5% and now sits closer to its end-2025 level. The trigger was rare coordinated intervention by Tokyo and Washington, with Treasury Secretary Scott Bessent backing the effort to correct what he termed a substantial undervaluation. Japanese authorities reportedly spent a record JPY 15.4tn across July and August. Yields have carried part of the load. The 10-year JGB yield touched 3% at the start of September, a level last seen in 1996, having begun the year near 2.1%. The climb is part of a global repricing driven by energy-led inflation and fiscal supply, with Takaichi's spending plans adding a domestic premium. The yen slipped again after the BoJ decision, a reminder that intervention buys time rather than a trend.
Chart 6: The Japanese yen and yields

Tian Yong Woon
AuthorMore in Author Profile »Tian Yong joined Haver Analytics as an Economist in 2023. Previously, Tian Yong worked as an Economist with Deutsche Bank, covering Emerging Asian economies while also writing on thematic issues within the broader Asia region. Prior to his work with Deutsche Bank, he worked as an Economic Analyst with the International Monetary Fund, where he contributed to Article IV consultations with Singapore and Malaysia, and to the regular surveillance of financial stability issues in the Asia Pacific region.
Tian Yong holds a Master of Science in Quantitative Finance from the Singapore Management University, a Master of Science in Analytics from the Georgia Institute of Technology, a Bachelor of Science in Mathematics from the Singapore University of Social Sciences, and a Bachelor of Science in Banking and Finance from the University of London.
More Economy in Brief