US Current Account in Q2: Additional Slippage
Summary
- A widening in the trade deficit deepened the current account shortfall.
- Both primary and secondary income improved slightly (i.e. became less negative).
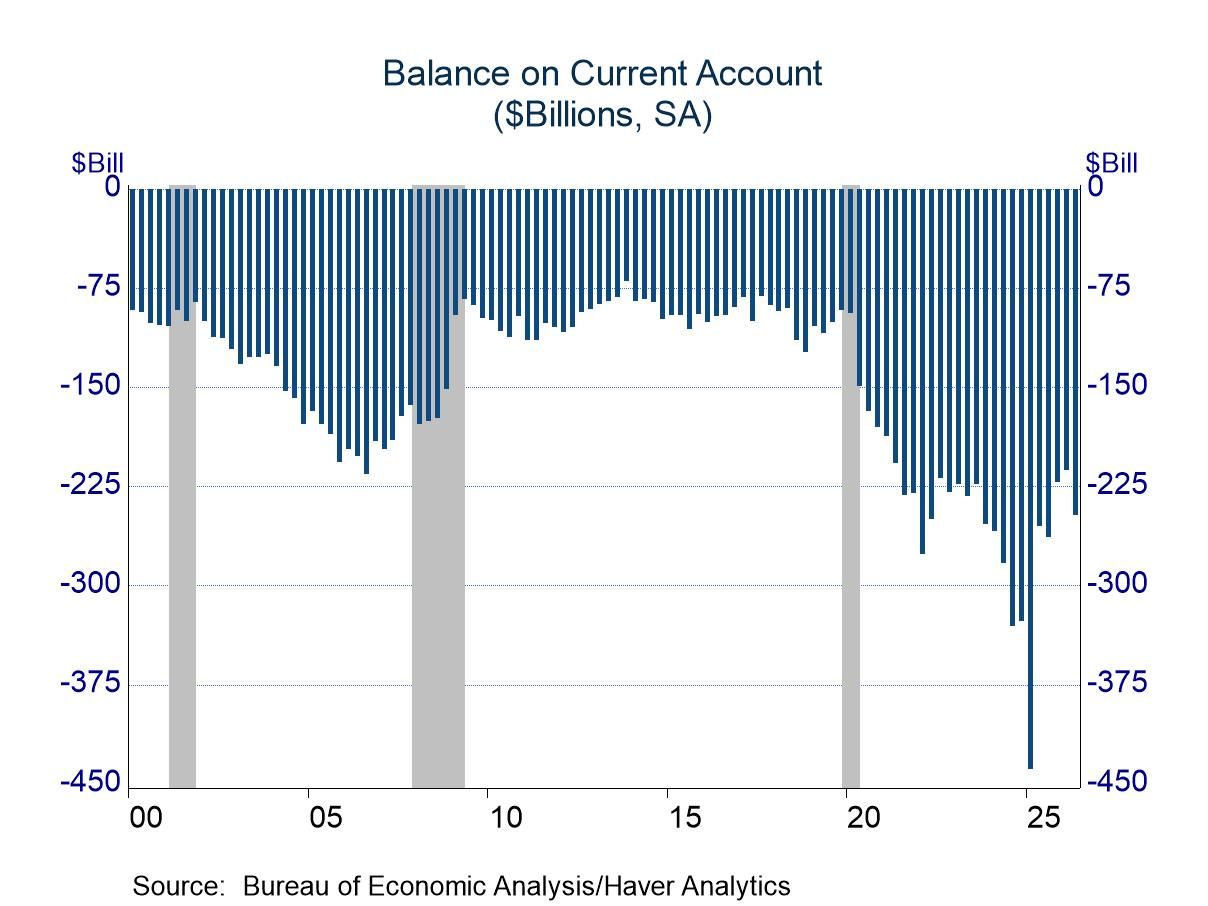
The US current account, a broad measure of trade and income flows between the US and the rest of the world, deteriorated in the second quarter, with the deficit widening by $33.4 billion to $246.0 billion. The shortfall was among the widest of the past several years, excluding observations in late 2024 and early 2025 when businesses rushed to import goods before the likely imposition of tariffs. The latest shortfall also is larger than the norm seen during the years before the pandemic (chart, upper left).
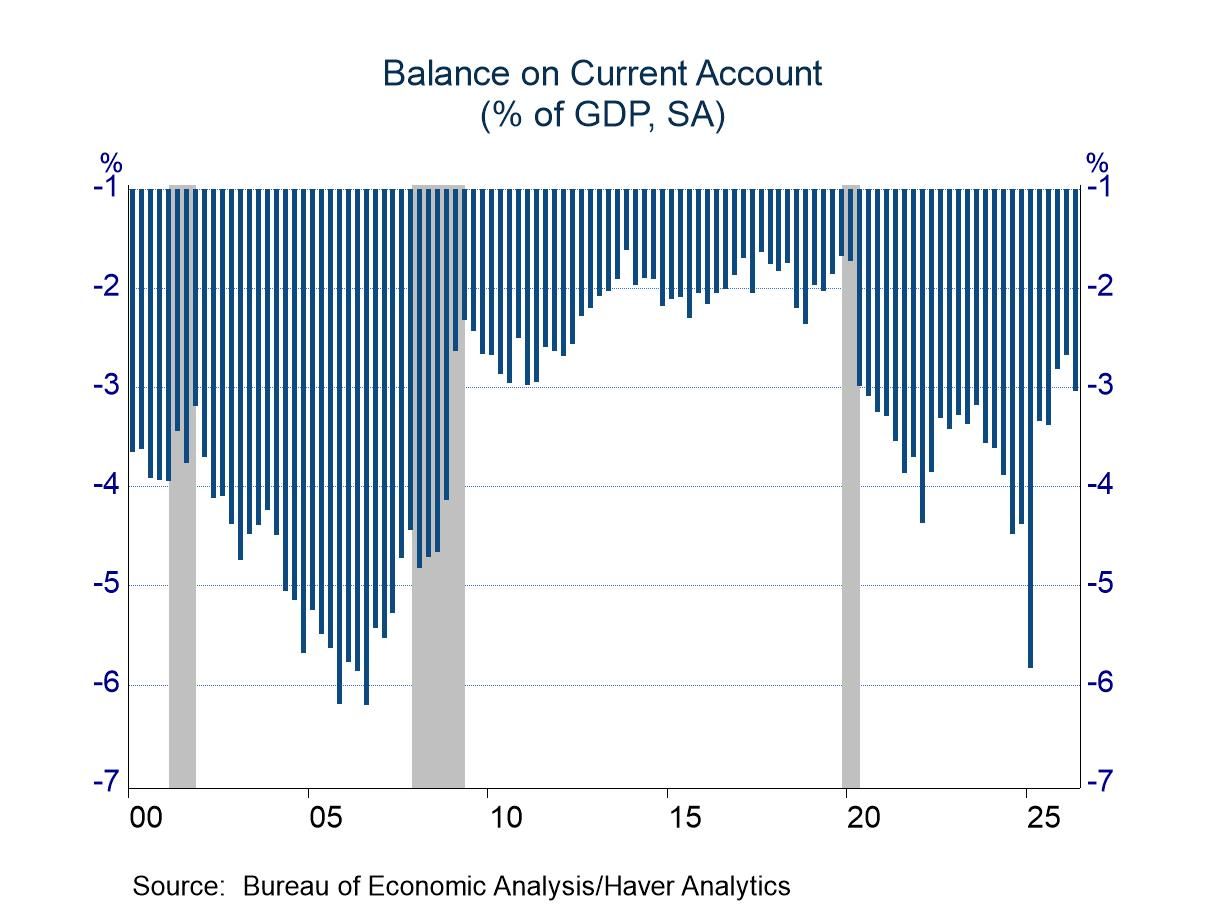
Measured as a share of GDP, the picture is a bit brighter. The latest shortfall is still in the upper portion of the recent range, but it is not as far out of line with pre-pandemic norms. In fact, it is about equal to observations in 2010 and early 2011. The deficit as a share of GDP was strikingly deep in the mid-2000s, when a general broadening in international trade and strength in the US economy led to sharper growth in imports than exports (chart, upper right).
The trade balance is the largest component of the current account, and in most quarters it is responsible for the lion’s share of the change in the current account. That was the case in Q2, as the trade deficit widened by $41.0 billion to $199.8 billion. The deepening in the trade deficit was sizeable—the second-largest in the history of the series, exceeded only by the tariff-related surge in 2025-Q1. However, the change was not surprising, as monthly figures on trade suggested noticeable deterioration.
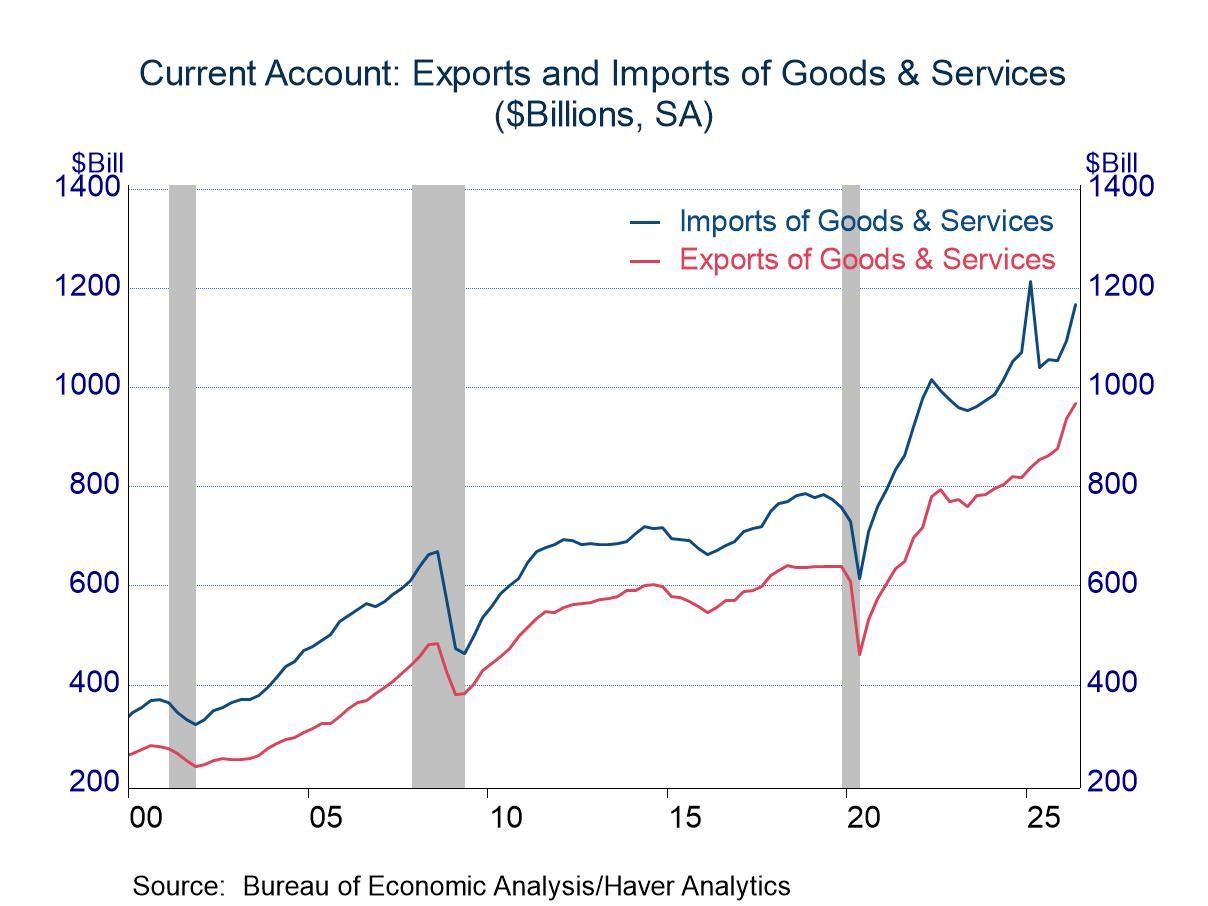
Exports performed well during the second quarter, increasing at an annual rate of 14.0%, which followed a jump of 30.1% in Q1. However, imports also were strong, surging 29.1% in Q2 after a jump of 16.8% in Q1 (annual rates). These solid performances provided a lift to already-respectable upward trends (chart, lower left).
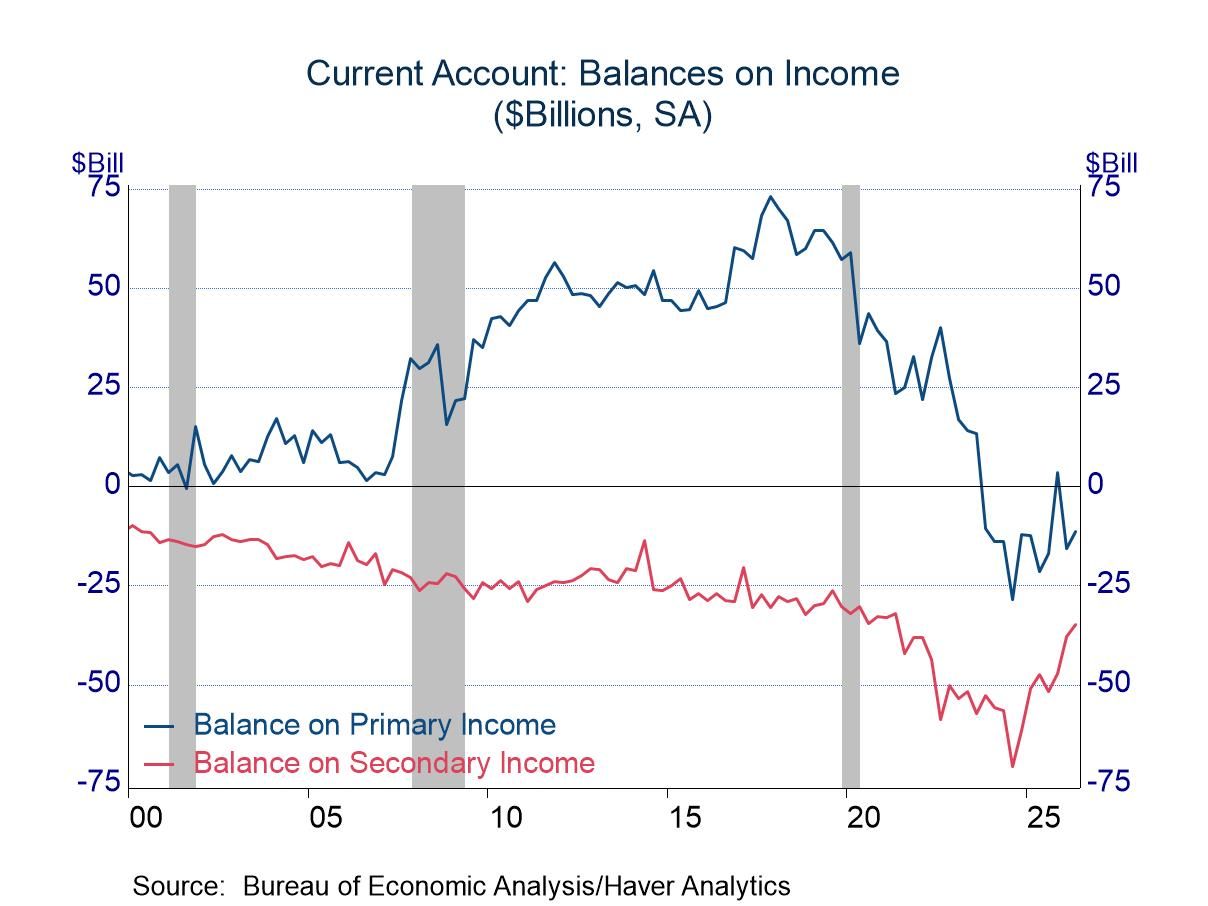
The income component of the current account consists of primary income and secondary income. Primary income consists of net investment income (receipts from abroad less payments abroad) and net employee compensation (remuneration received by US residents from foreign businesses while working temporarily in foreign countries, less remuneration received by foreign residents from US businesses while working temporarily in the United States). The compensation component of primary income is small; movements in total primary income are dominated by the investment component.
Historically, net investment income for the United States was strong, as US investors and businesses favored equity-related instruments and generally earned attractive returns. Foreign investors in the US, in contrast, leaned more toward fixed-income instruments, which typically yield less than equity. The US advantage in investment income began to fade in 2018, and net investment income shifted into negative territory in 2023-Q4. The deterioration was primarily the result of expanding volumes of foreign investment in the US (required to balance the trade deficit), which overwhelmed the rate-of-return disadvantage seen in years past. In addition, the strong US stock market in recent years most likely improved the returns earned by foreigners in the US.
Secondary income consists of net transfer payments between US residents and nonresidents. (Transfer payments are monetary flows that are not matched by a good or service or asset in return. Examples include pensions, personal insurance settlements, personal remittances, charitable donations, fines and penalties.) Secondary income for the US is nearly always negative (only one positive quarter in the history of the series). The softness deepened in late 2023, but it has recovered in the past year or so. The reasons for recent shifts are not clear, but a logical explanation would involve personal remittances. The strong performance of the US economy in 2023-24 may have led to strong personal remittances (foreign workers sending money home). The immigration policies of President Trump could be leading to a drop in remittances and an improvement recently in secondary income.
Balance of Payments data are in Haver’s USINT database, with summaries available in USECON. The expectations figure is in the AS1REPNA database.

Michael J. Moran
AuthorMore in Author Profile »Before joining Haver Analytics in 2025, Michael J. Moran was the chief economist of Daiwa Capital Markets America Inc. He was responsible for preparing the firm’s economic forecast and interest rate outlook. He traveled frequently to visit the clients of Daiwa Capital Markets and wrote weekly economic commentary. Mr. Moran also was involved in the flux of financial markets, as he spent a portion of each day on Daiwa’s trading floor interpreting economic statistics and Federal Reserve activity for traders and salespeople. Mr. Moran is quoted frequently in the financial press, and he appears regularly on cable news shows. He also has published articles in several journals and periodicals. Before joining Daiwa Capital Markets America, Mr. Moran worked as an economist at the Federal Reserve Board in Washington, D.C. where he analyzed a broad range of issues dealing with the financial sector of the economy and regularly briefed the Board of Governors. He was on the faculty of Pennsylvania State University from 1979 to 1980 and taught on a part-time basis at George Washington University from 1980 to 1987.
Mr. Moran received his Ph.D. in economics from Pennsylvania State University in 1980 and a B.S. in business administration from the University of Bridgeport in 1975. He was a CFA charter holder from 2002 until 2016.
 Global