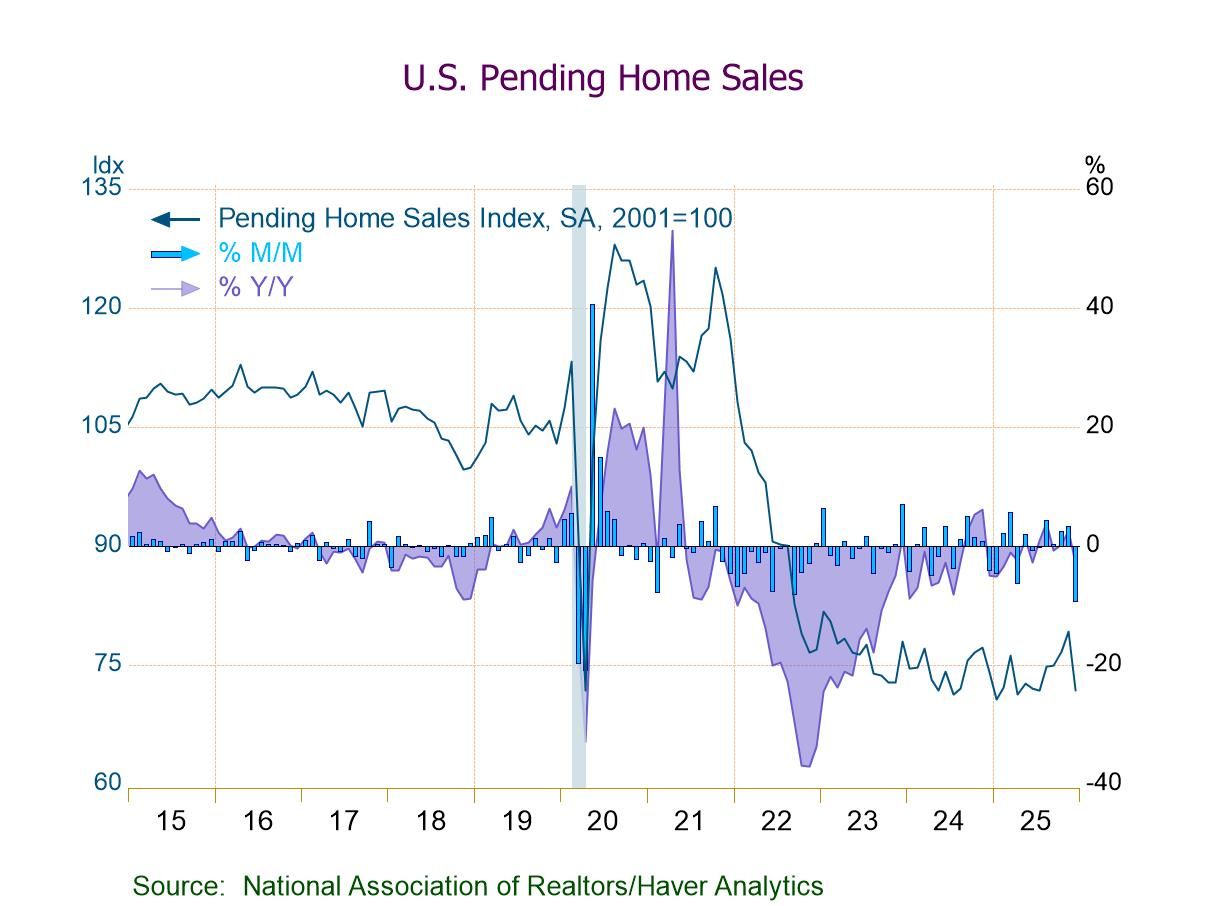
- PHSI -9.3% m/m (-3.0% y/y) to 71.8 in Dec., lowest index level since July.
- Home sales m/m down in all four major regions, w/ the Midwest seeing the steepest drop (-14.9%).
- Home sales y/y down in the Northeast, Midwest, and West, but up in the South (+2.0%).
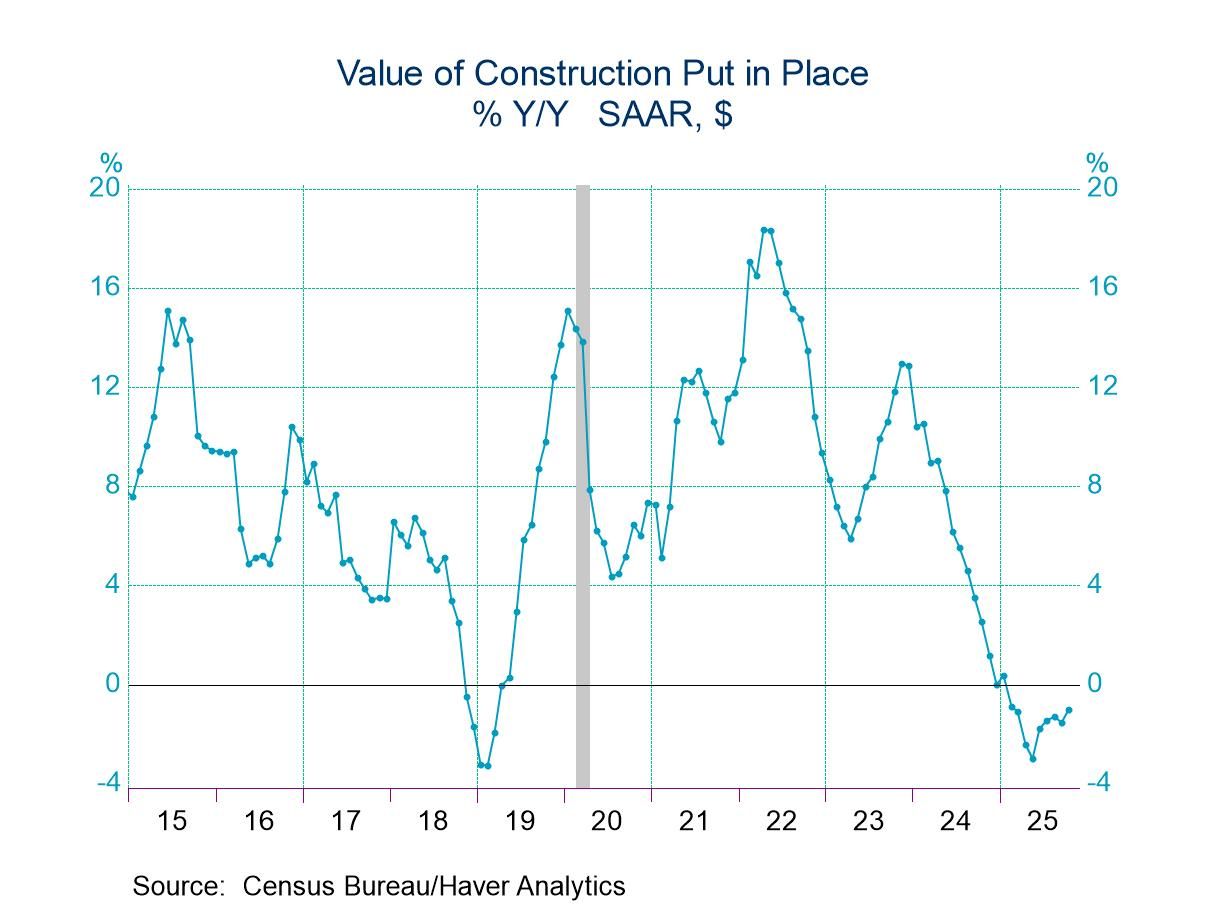
- Total construction spending fell 0.6% m/m in September but rebounded 0.5% m/m in October.
- Private construction spending slumped 0.9% m/m in September but rose 0.6% m/m in October.
- Private nonresidential construction fell for the fourth consecutive month while private residential construction posted a 1.3% m/m gain.
by:Sandy Batten
|in:Economy in Brief
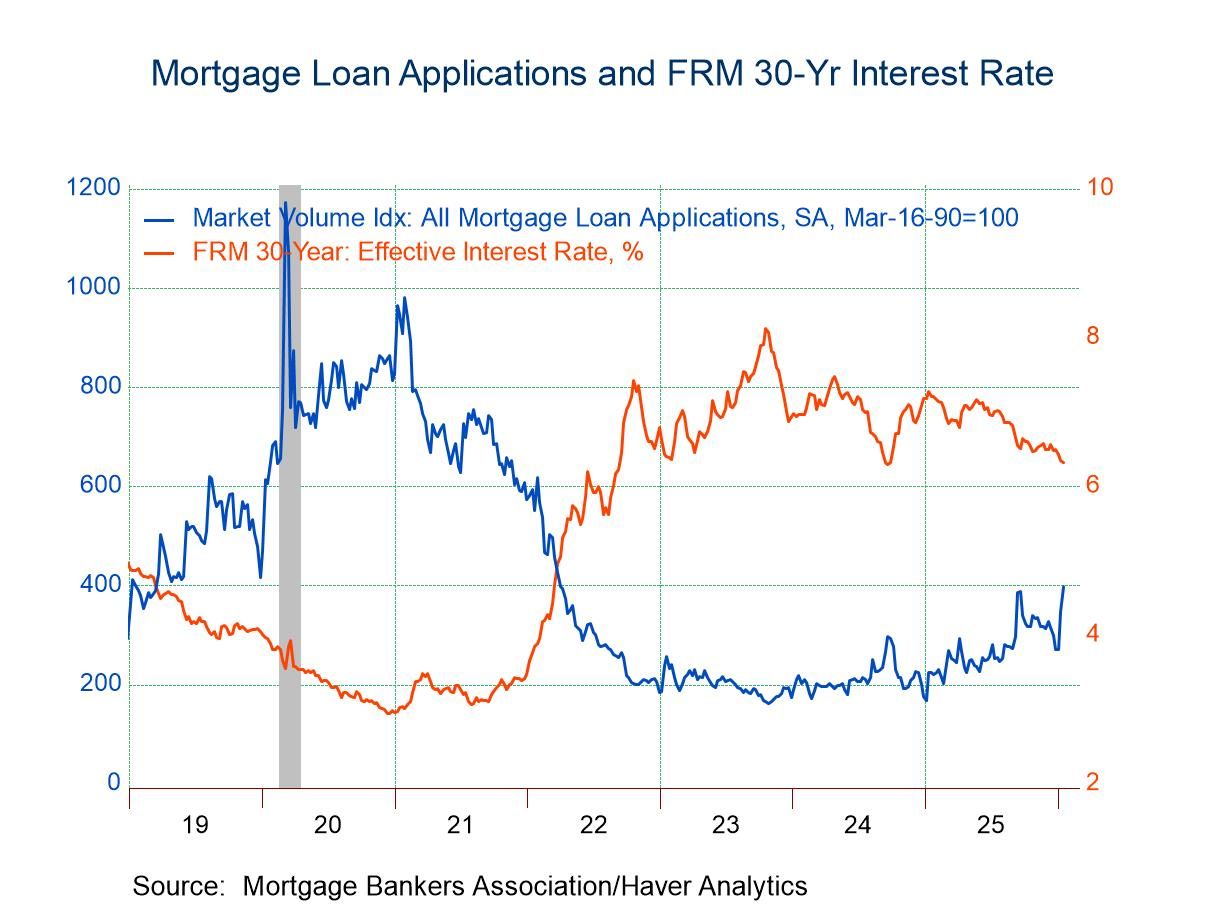
- Purchase and refinancing loan applications posted healthy rises in the latest week.
- Effective interest rate on 30-year fixed loans fell to 6.32%.
- Average loan size rose.
 United Kingdom| Jan 21 2026
U.K. CBI Industrial Survey Flags Trouble Ahead
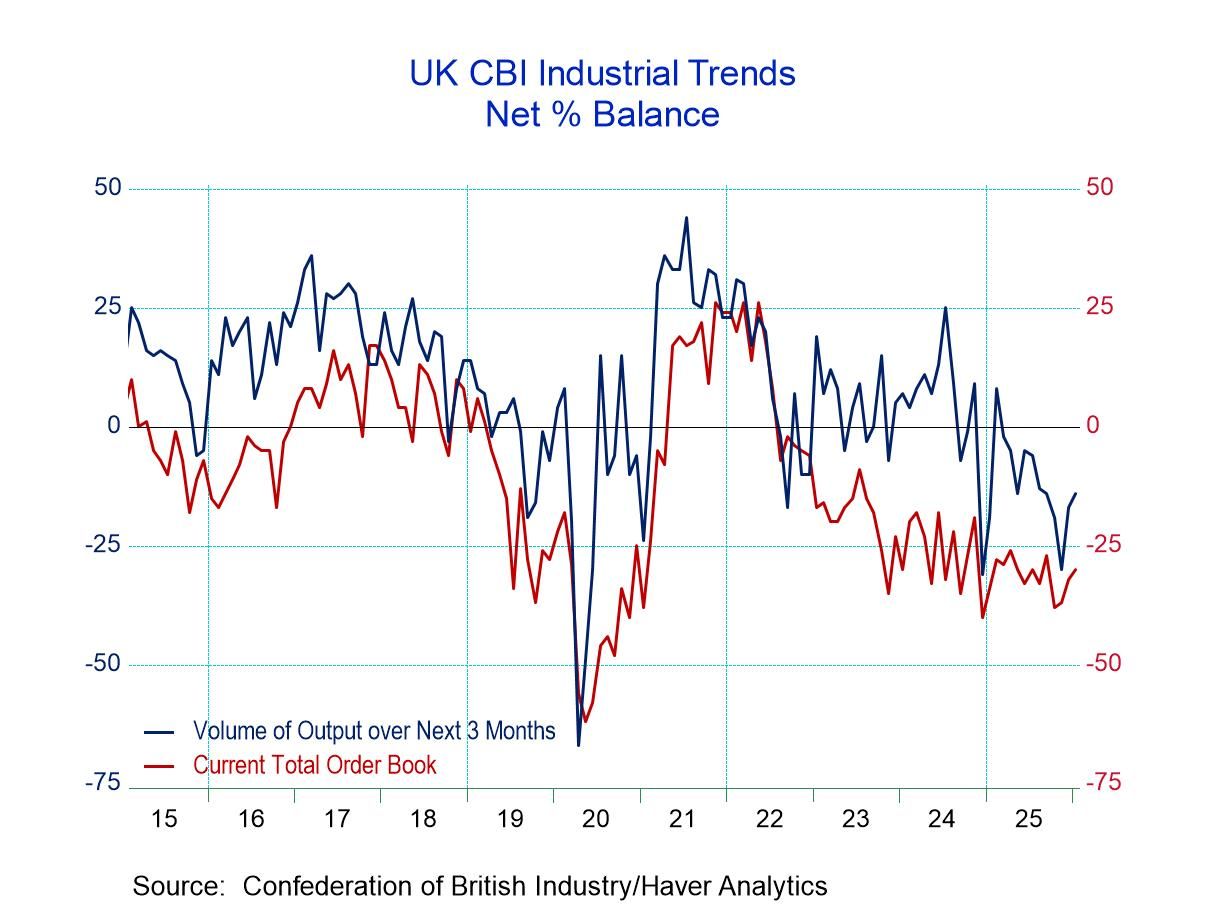
The CBI (Confederation of British Industry) Industrial Trends Survey showed slight improvement in orders in January 2026 as the survey reading rose to -30 on a net basis from -32 in December and -37 in November. However, the 12-month average of the order series is -31 and so the improvement compared to conditions that prevailed over the last 12 months is not significant.
Export orders, on the other hand, deteriorated to -30 in January from -27 in December although that reading was slightly better than the -31 print in November. Once again, the -30 reading for January is only slightly better than the 12-month average of -32.
Stock-building slowed in January at +3 compared to +8 in December and +16 in November. That, actually, could be good news suggesting that industries are getting control of their inventories at a time when sales have been weak.
Looking ahead for output volume over the next three months improved to -14 in January from -17 in December and -30 in November, a substantial pick up over this period. But the reading for January at -14 is still slightly more negative than the 12-month average of -11.
The unequivocally stronger reading in the table, unfortunately, is for prices with average prices over the next three months at a +29 net reading, up from +19 in December and up from +7 in November. The reading of +29 in January compares to a 12-month average of +18 indicating a significant pickup compared to conditions that prevailed over the last 12 months.
Evaluating these readings by ranking the queue standings of the net values and data back to 1992 shows total orders have a 20th percentile standing, export orders have a 28.4 percentile standing, while the stocks of finished goods have a 9.8 percentile standing, and expected output - despite its recent improvement - is quite weak with an 8.3 percentile standing. Average prices, on the other hand, are quite strong with a 91.7 percentile standing, indicating that the forces of inflation looking ahead are quite strong despite relatively weak demand and output conditions that are expected.
CBI data compared to annual growth rates in manufacturing and to the manufacturing PMI show rankings actually much better than the CBI survey. The manufacturing PMI has a 53.7 percentile standing that's only on data back over the last four years. The manufacturing production data have a 48.3 percentile standing, which is still very close to its 50-percentile standing, which would be its historic median. So, we have another case here of the accounting data being stronger than the survey data from the CBI. The strength in manufacturing industrial output does not compare favorably with the weakness portrayed in the CBI survey even though the manufacturing data are only up-to-date through November. The CBI data are up-to-date through January. And since CBI data generally show some stability or improvement from November to January, that data time mismatch with industrial production doesn't seem to be the reason for these readings being so vastly different. We’re going to have to keep an eye on other metrics for manufacturing to see which one of these surveys is giving us the best information.
For now, we don't know which of these series is the best and what we're looking at is a CBI series that is touting a great deal of economic weakness and portraying significant increases in prices over the next three months.
 Global| Jan 20 2026
ZEW Survey Shows Advancement All Around
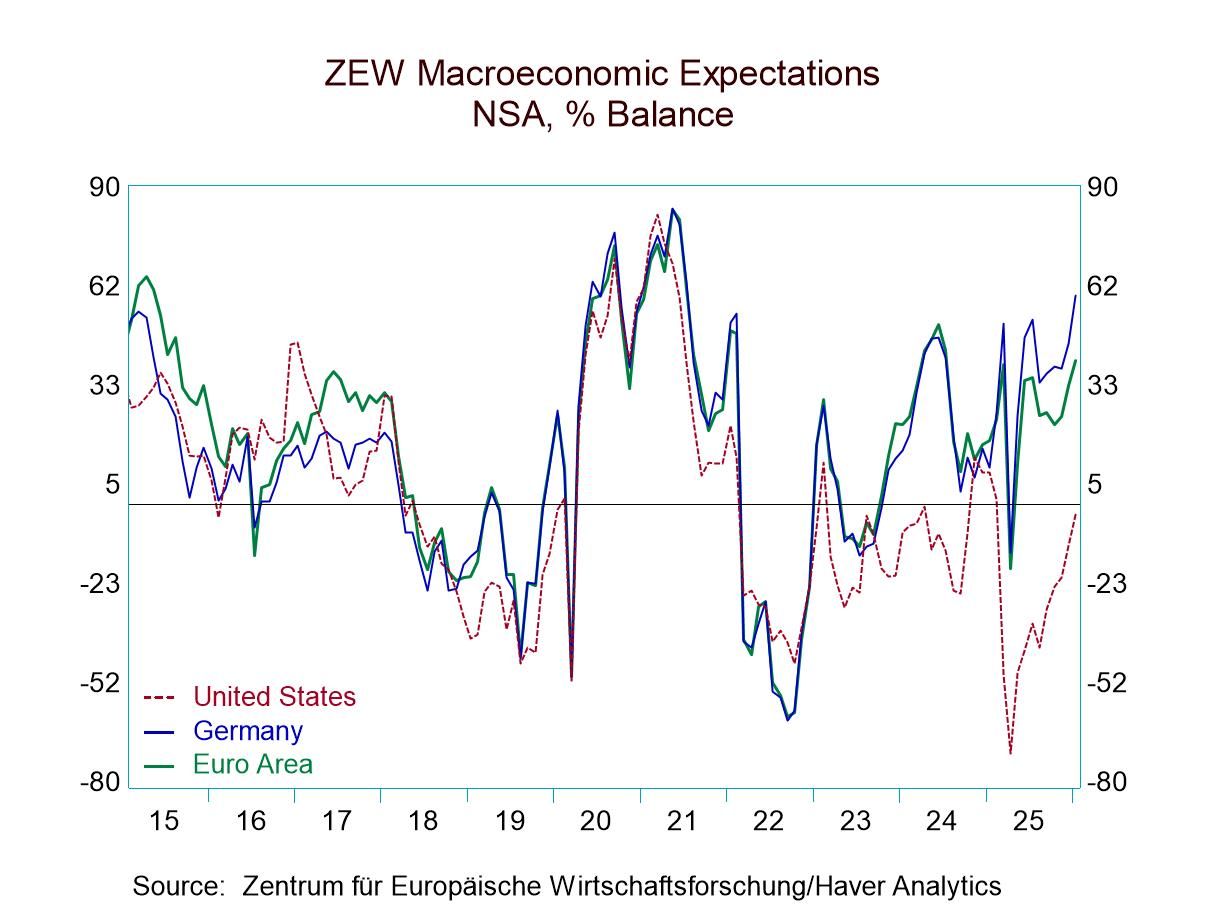
The ZEW survey for January showed improvement all around with both economic expectations and macroeconomic conditions showing improvements in the United States, Germany, and the euro area.
The economic situation in January in the euro area improved to a reading of -18.1 from -28.5 in December. In Germany, the reading improved to -72.7 from -81 in December, while in the United States the reading improved to +17.7 from -0.6 in December. The message here clearly is the month-to-month improvement. Still, the January readings leave the assessments of conditions in these three areas as quite different. The percentile-queue standings place each one of these topical readings in their queue of data back to December 1992, expressing the standing in percentile terms. Viewed in this way, the euro area has a 57.2 percentile standing, the U.S. has nearly a 45-percentile standing, while Germany has a 22.6 percentile standing, leaving each of these areas in their own distinctive positions relative to their historic norms. The euro area has a firm and above-median ranking since the reading is above the 50th percentile (where the median is located). The U.S. is slightly weaker than that, with a reading that's marginally below its median. Germany has a reading between the lower quartile and the one-fifth mark of its historic data, branding it as weak.
Macroeconomic expectations find that Germany in January moved up to a positive reading of 59.6 from 45.8 in December. The U.S. also improved, moving up to -3 from -12 in December. The macro-expectations find Germany and the U.S. in very different places with German expectations in an 80.4 percentile of their queue, placing them in the top 20% while the U.S. has a 45-percentile standing, below its historic median and essentially the same relative position as its current situation ranking. In contrast, Germany has a weak current economic assessment versus a stronger expectations assessment.
Inflation expectations weaken across the board in January, with the euro area falling to -7.6 from -4.6 in December, Germany falling to -6.0 from -1.7 and the U.S. falling to 44.2 from 54.9. The ZEW experts see a disinflationary environment, and they see that despite the pickup in current conditions and improved macroeconomic expectations. Expectations in the U.S. have a 61.1 percentile standing; the German and the euro area readings are much weaker and closer together, with the German standing at its 31.2 percentile and the euro area at its 25.8 percentile.
On the back of these expectations, short-term interest rates in the euro area are less weak, with the January reading at -7.7, up from -10.8 in December. The U.S. has a -65.6 reading, stronger than Decembers -73.9. On a ranking basis, the euro area’s short-term rates have a 37.4 percentile standing The U.S. has a 9.3 percentile standing. The interest rate assessment is that short-term rates are going to be modest to lower over the outlook.
Long-term interest rates in Germany and the U.S. weaken slightly in January from December to 44.5 in January for Germany, compared to 49.2 in December, and in the U.S., there is a very modest ‘decimal point’ change to 44.1 in January from 44.9 in December. German long-term rates have a 58.8 percentile standing while the U.S. has rates at about a 50-percentile standing, placing them just about on top of their historic median. Neither one of these expectations has long-term expectations different from historic norms.
Stock market expectations from December to January, however, are little changed and mostly weaker, with the euro area gauge falling to 35.2 from 41.3 in December. The German gauge slips to 35.9 from 36.3 in December. The January gauge for the U.S. is ticking slightly higher to 31.5 January from 30.2 in December. The rankings for the January gauges show the U.S. above its median at a 59.3 percentile mark, the euro area slightly below its median with a 44.9 percentile reading; the German stock market still scores as the weakest at a 39.7 percentile standing.
 Asia| Jan 19 2026
Economic Letter from Asia: Shifting Gears
This week, we dive into several key developments across Asia. China’s Q4 GDP marked a further extension of its recent growth slowdown, yet full-year growth still came in exactly at the government’s 5% target for 2025 (chart 1). That said, the road ahead remains challenging, as December’s data delivered a mixed set of outcomes. Encouragingly, new external inroads, starting with Canada’s opening up of EV trade with China, could pave the way for additional opportunities (chart 2). In semiconductors, the latest US tariff measures proved far more limited in scope than initially feared, helping to explain the muted market reaction to the announcement (chart 3). Relatedly, commitments by major Taiwanese chipmakers to expand investment in the US have brought Washington and its largest chip supplier closer together, culminating in a US–Taiwan trade deal (chart 4).
In Japan, attention has turned to the possibility of a snap Lower House election in February. The interim political uncertainty, alongside expectations around future policy, has weighed on the yen and pushed Japanese yields higher (chart 5), with some observers increasingly concerned about the narrowing window to pass the FY2026 budget by April, given the likely dissolution of the Lower House. In South Korea, President Lee’s recent visits to China and Japan point to improving bilateral ties, although he continues to navigate a delicate balancing act amid still-elevated China–Japan tensions. Domestically, elevated house prices and high household debt continue to limit the scope for further monetary policy easing (chart 6).
China Alongside its regular slate of monthly economic releases, China unveiled its Q4 GDP figures earlier today, with the economy expanding by 4.5% y/y during the quarter. While Q4 growth continues the recent trend of deceleration seen over the past few quarters, the outcome brings China’s full-year growth for 2025 right in line with the government’s 5% target (chart 1). This defied expectations among some investors that the economy would fall short. This outcome aligns with earlier discussions that China remained within reach of its growth target despite slowing momentum. That said, the outlook ahead remains challenging. December’s monthly data painted a mixed picture, with declines in fixed asset investment accelerating and retail sales growth cooling further, even as industrial production growth remained relatively resilient.
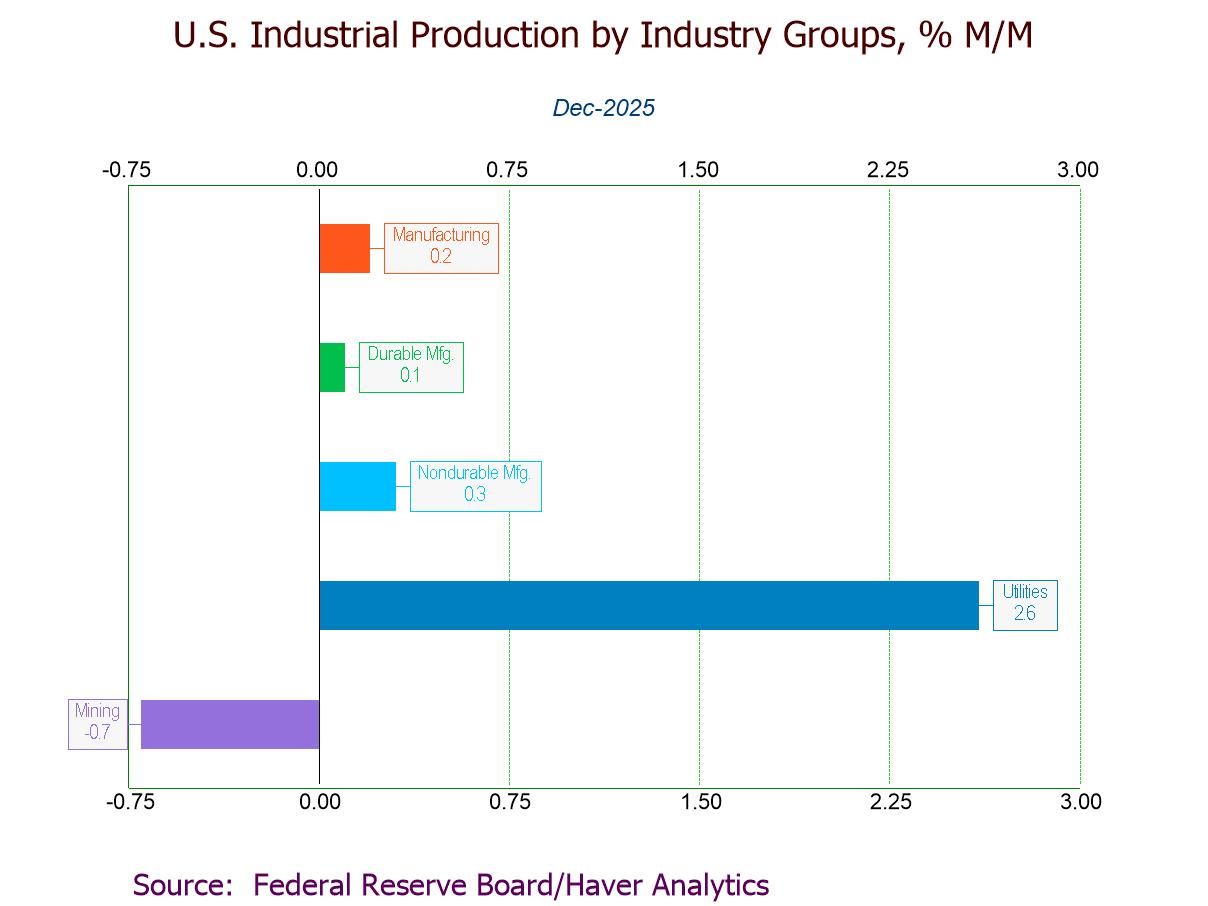
- December IP +0.4% (+2.0% y/y), third m/m rise in four months, led by a 2.6% gain in utilities.
- Manufacturing +0.2% (+2.0% y/y), w/ durables +0.1% and nondurables +0.3%.
- Selected high-tech +0.7%, third consecutive m/m rise; motor vehicles -1.1%, fourth straight m/m fall.
- Mining -0.7%, third m/m decline in four months.
- Key categories in market groups mostly increase.
- Capacity utilization at a five-month-high 76.3%; mfg. capacity utilization steady at 75.6%.
 Europe| Jan 16 2026
Big Four Inflation in EMU 2025-Final
The European Monetary Union has concluded a year of weak-to-moderate growth with inflation largely toeing the line. As always, the inflation picture is more complicated than a simple statement. When we look at inflation, we look at the headline, we look at the core, to make sure that the volatile food & energy elements aren't dominating the index, and then we look across some of the main participants to see if the trend for inflation is shared broadly across the largest countries in the Monetary Union. When we apply those kinds of standards, the grading for the year is reduced. However, based on the headline alone, it was an excellent year for the ECB.
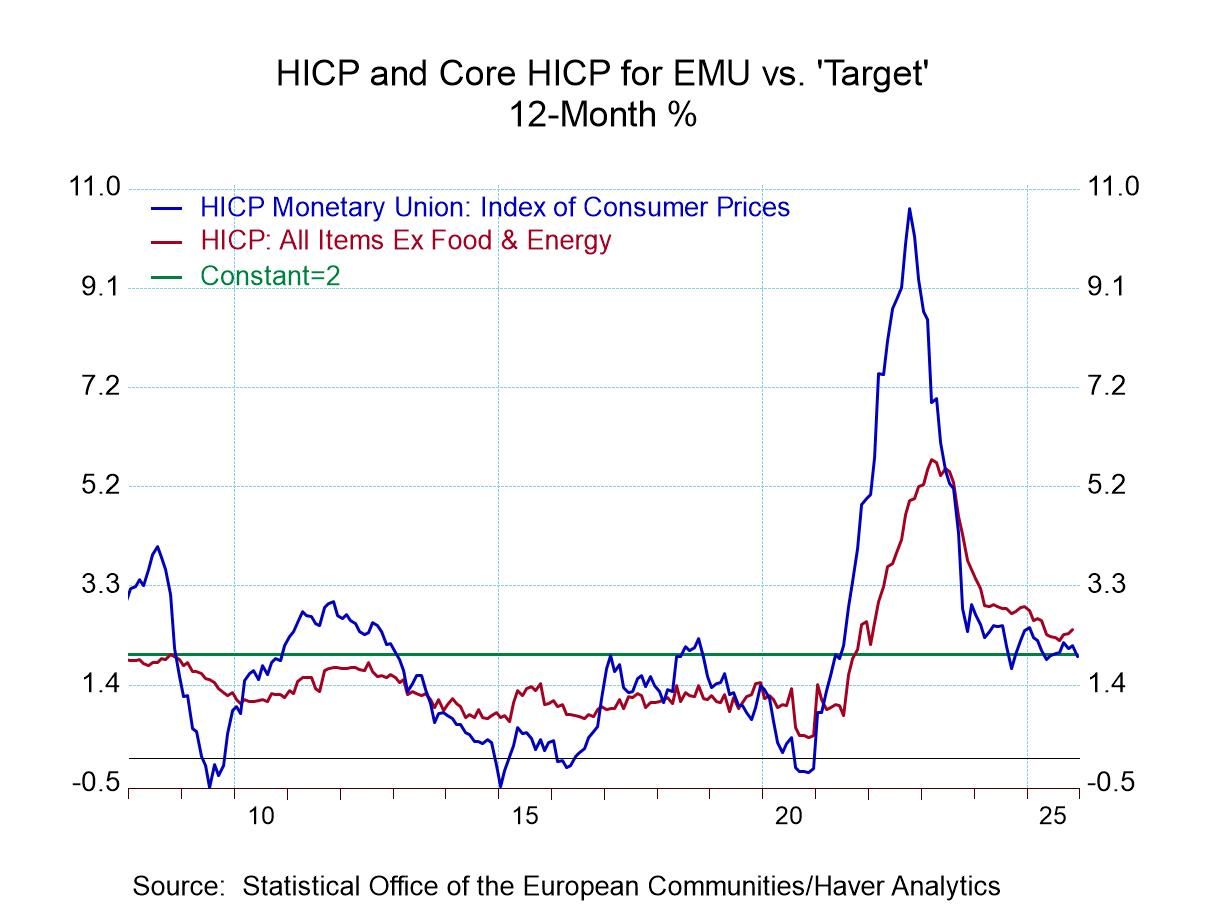
Headline Inflation in 2025 Headline inflation in 2025 rose by 2%, exactly on the target of the European Central Bank. It rose over six months at a 2% annual rate and then concluded the year over the last three months, rising at a 1.6% annual rate with some margin below the target set by the central bank itself.
Country Headline Inflation Trends On a country basis, the performance is not nearly as good. While year-on-year results look pretty good, with Germany at 2%, France at 0.7% and Italy at 1.3%, Spain comes in at 3.1%. So the three largest monetary union economies come in at or below 2% with Spain as a rogue observation. When we look further at the sequence of inflation within the year, we see Germany at 2% over 12 months, rising to 3.1% over 6 months, rising further to 4% over 3 months. Inflation is accelerating at the end of the year even as Germany hits the target! This is something to keep an eye on. For France, the inflation rate also accelerates slightly but stays below the bar of 2% over three months, six months, and 12 months. For Italy, inflation is decelerating from 1.3% over 12 months to -0.3% over six months, and then inflation in Italy is contracting at a 1.9% annual rate over three months. Spanish inflation shows clear trouble with a 3.1% 12-month pace, rising to 4.6% at an annual rate over six months, and rising further to 5.9% at an annual rate over three months.
Core Inflation For core inflation, the Monetary Union’s consolidated numbers are not yet compiled. However, for the four largest economies, we do have core or ex-energy inflation. For Germany, it's inflation excluding energy. On that basis, German inflation is 2.2% over 12 months, it rises to 2.7% over six months, then falls back to a 2% annual pace over three months All-in-all not a bad performance. For France, core inflation is below 2% over 12 months, six months, and three months. In Italy, once again, we see inflation decelerating: Italian inflation is 2% over 12 months - right on the ECB target. It falls to a 1.3% annual rate over six months and then falls further to a 0.3% annual rate over three months. For Spain, the core has another very difficult story for the Monetary Union. Inflation is 2.7% over 12 months, it rises to 3.1% over six months and stays at an annual rate of about 3% over three months. This is too high and it looks stubborn, particularly because it is the core.
- of2725Go to 37 page