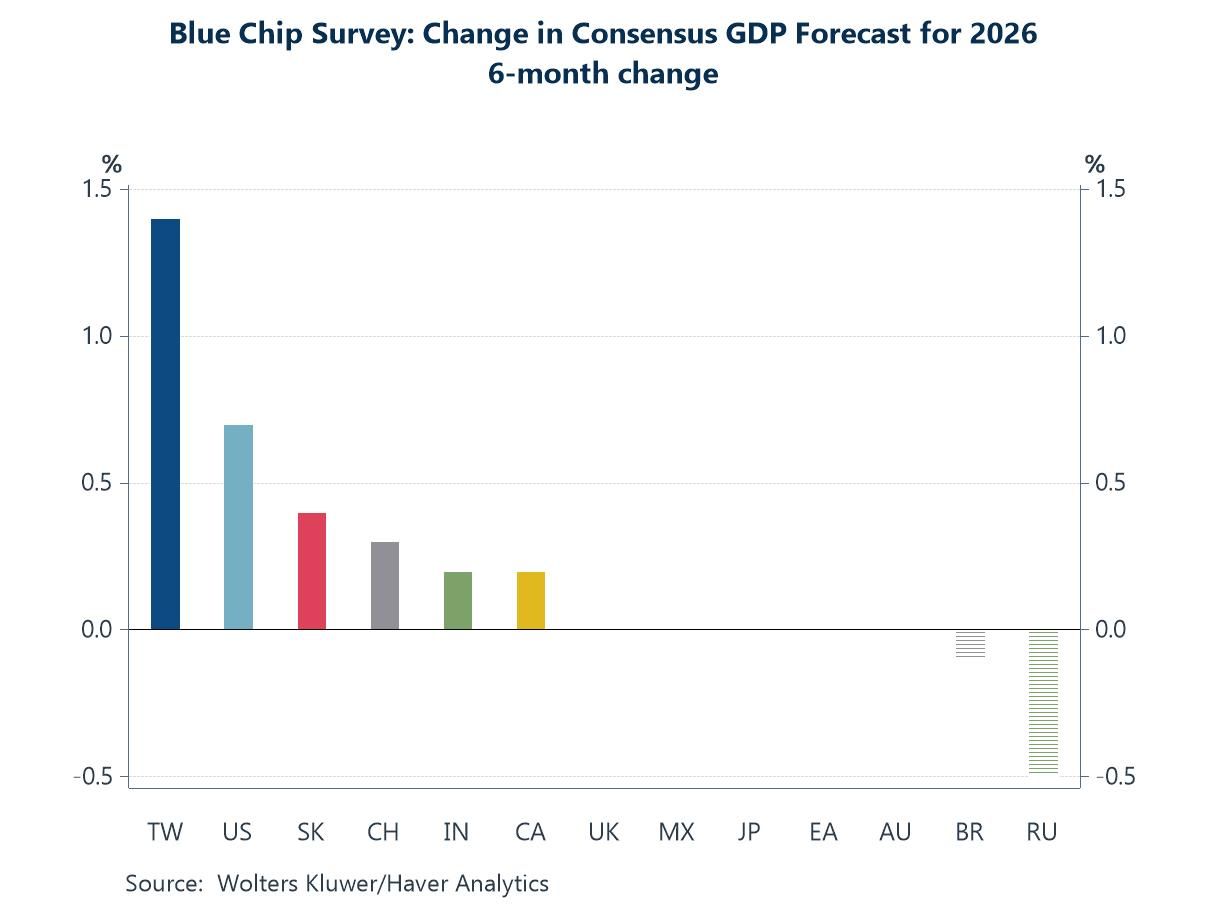
The global backdrop remains unsettled, reflected in rising gold prices amid geopolitical tensions—most recently around Venezuela—and renewed political noise, including questions over Federal Reserve independence. At the same time, however, many major equity indices remain at or close to all-time highs, buoyed by optimism around AI and reinforced by a run of relatively benign US inflation readings. Against this mixed backdrop, the charts this week point to a global outlook that is becoming more differentiated rather than uniformly weaker. Blue Chip forecasts for 2026 growth have edged higher over the past six months, with upgrades concentrated in economies most exposed to the AI investment cycle, notably the US and parts of Asia (chart 1). Central bank expectations remain fluid: while panelists broadly anticipate easing by the Fed and Bank of England, conviction around timing is limited, and the Bank of Japan remains an outlier with further tightening still expected (chart 2). In the UK, that uncertainty sits alongside a deteriorating data flow, with negative economic surprises increasingly tilting market expectations toward an earlier BoE rate cut (chart 3). Turning to the US, special questions highlight a divide over whether AI is already having a noticeable macro impact or whether its effects will emerge more gradually, a tension that mirrors concerns about over-optimism in financial markets (chart4). That debate is echoed in the recent pick-up in US productivity growth and the step-change in business formation—developments that may reflect AI-related dynamics but which also warrant caution given the historically cyclical nature of productivity (chart 5). Finally, China’s trade data point to a continued re-orientation of export growth away from the US and toward Europe and ASEAN, consistent with evolving US trade policy and broader supply-chain realignment (chart 6).
 Global| Jan 15 2026
Charts of the Week: Between Optimism and Uncertainty
by:Andrew Cates
|in:Economy in Brief
 USA| Jan 15 2026
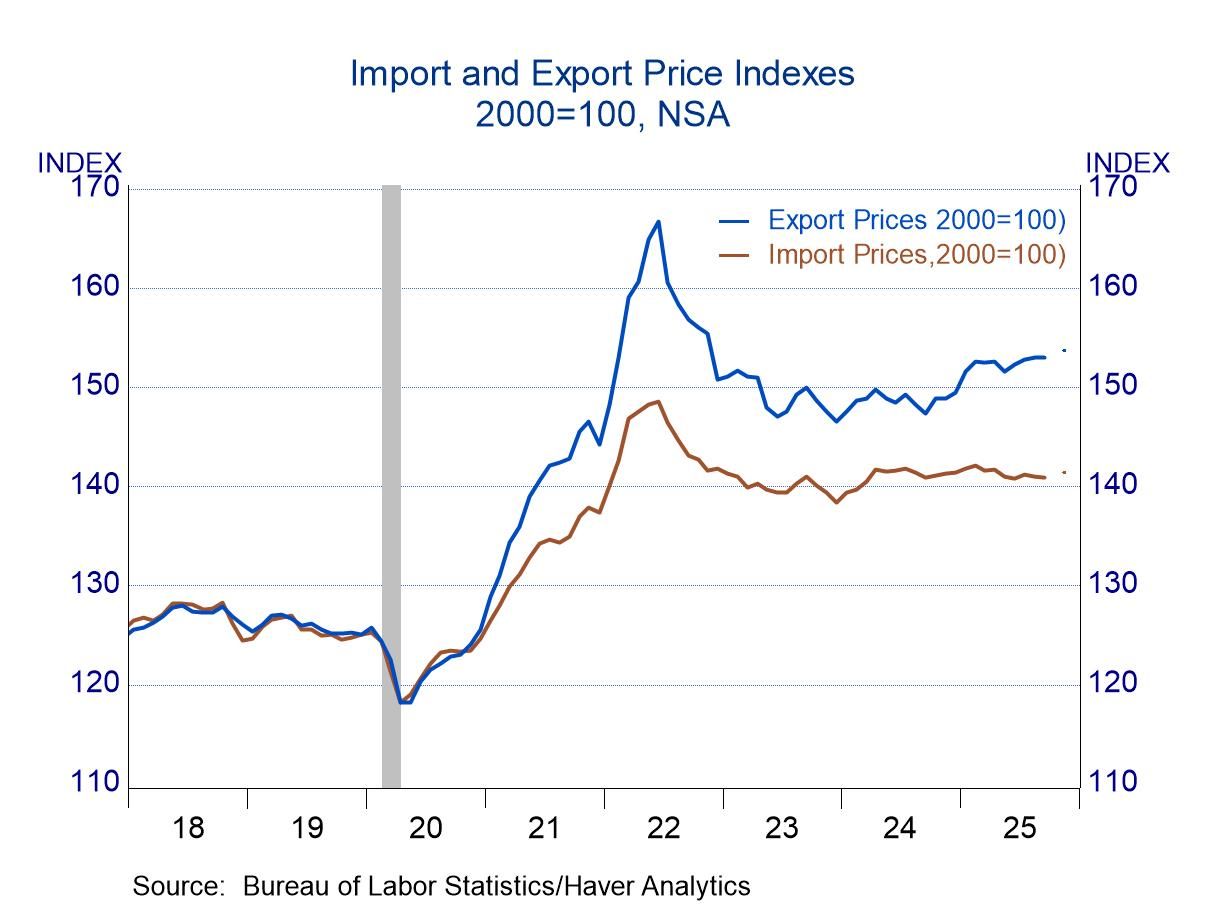
Import & Export Prices: Generally Modest Changes
- Import prices have changed little in the past three years.
- Export prices were stable in 2023-24, but moved higher in 2025.
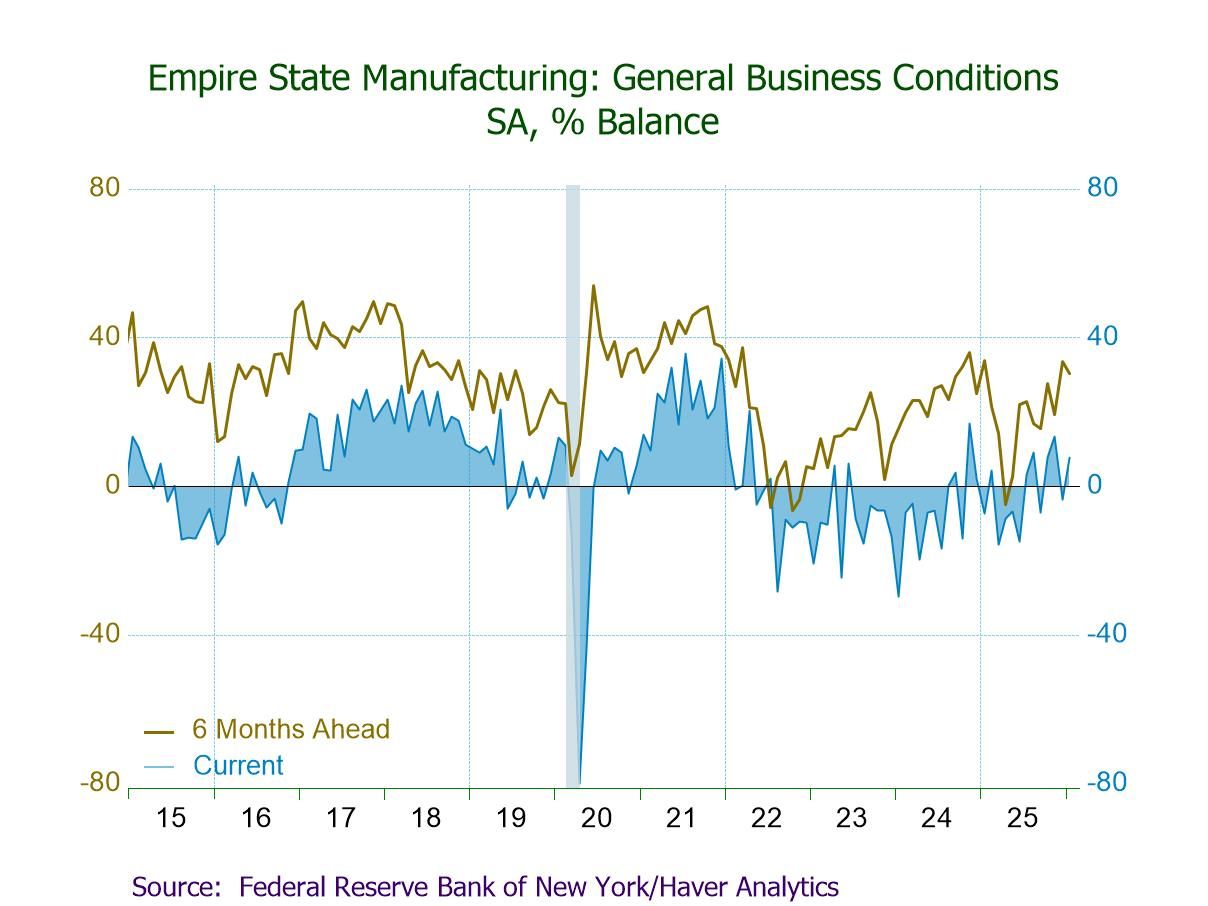
- General Business Conditions Index up 11.4 pts. to 7.7 in January.
- Positive: Shipments (16.3, highest since Nov. ’24) and new orders (6.6).
- Negative: Employment (-9.0, lowest since Jan. ’24), unfilled orders (-8.2), and inventories (-2.1, a four-month low).
- Prices paid at a 10-month-low 42.8 and prices received at a one-year-low 14.4.
- Firms fairly optimistic: Future Business Conditions Index down to a still-positive 30.3; future prices paid at a one-year-low 52.6.
 USA| Jan 15 2026
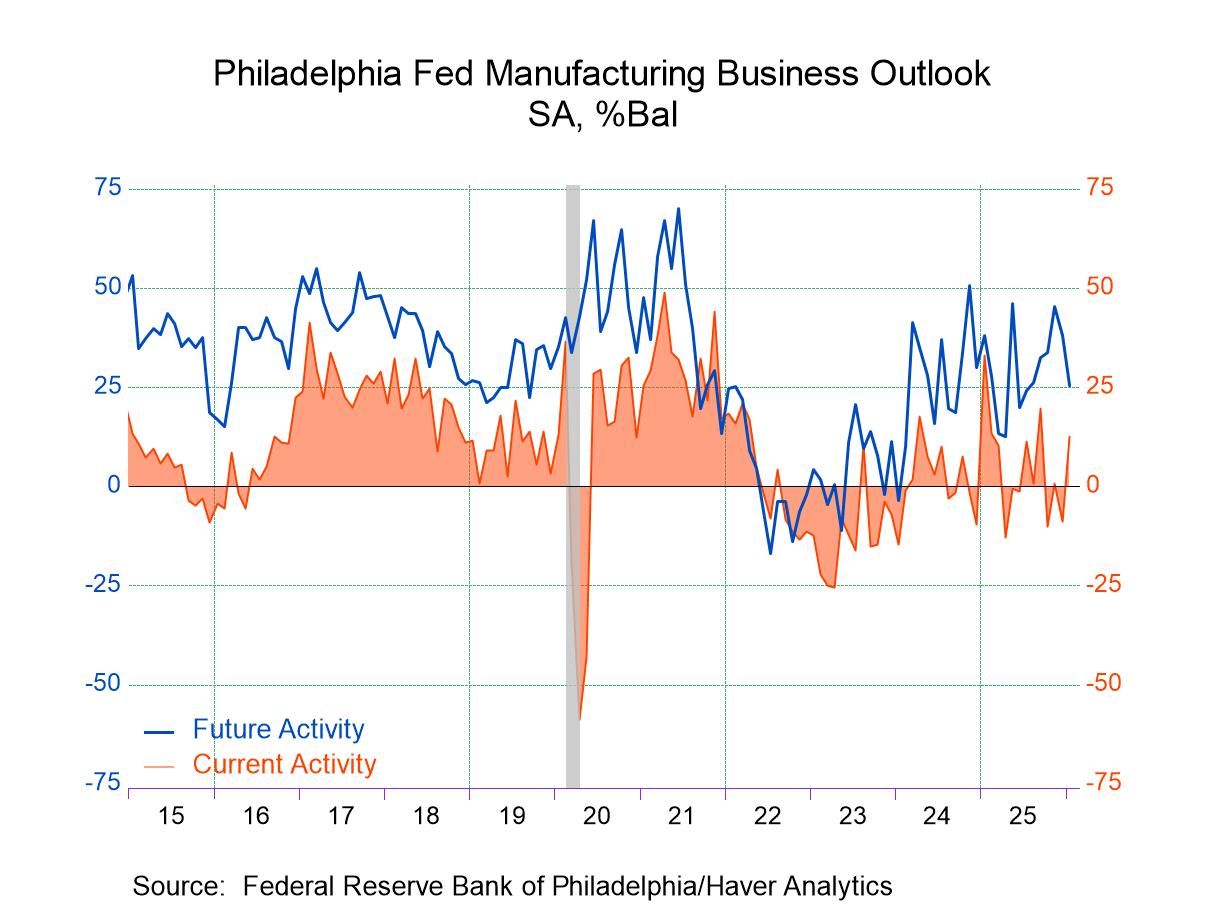
Philly Fed Manufacturing Activity Rebounds in January
- The headline index increased to 12.6 in January, the highest reading since September, from -8.8 in December.
- Both new orders and shipments increased in January.
- Delivery times lengthened while the pace of input price increases slowed.
- Employment decreased but remained in positive territory, indicating further gains in employment though at a slower pace.
by:Sandy Batten
|in:Economy in Brief
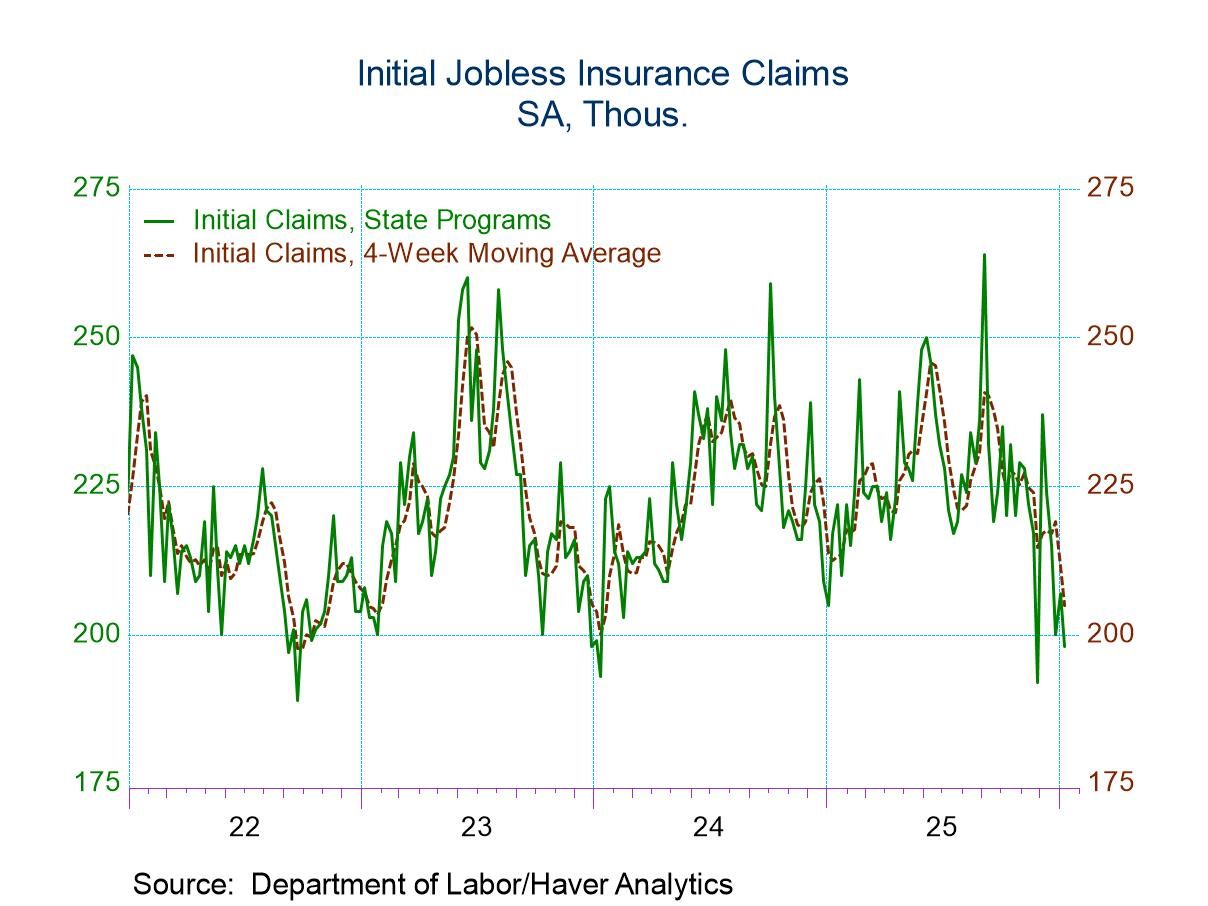
- Initial claims declined from the prior week.
- Continuing claims declined from the prior week.
- The insured unemployment rate was unchanged.
 Europe| Jan 15 2026
EMU IP – Has the Worm Turned?
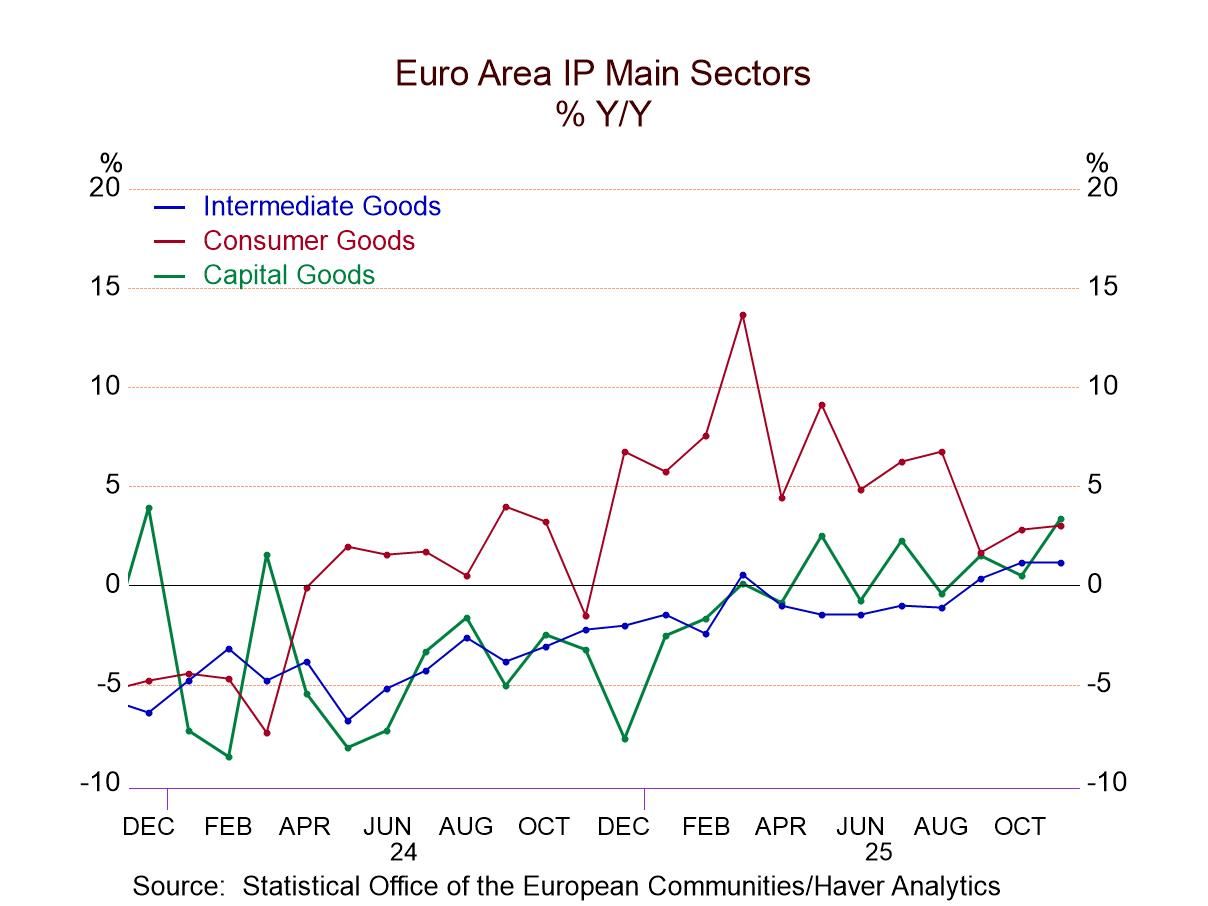
Industrial output in the European monetary union rose by 0.7% in November for the second month in a row. Manufacturing output jumped to an increase of 0.9% after rising by 0.3% in October. By sector, output in consumer goods fell by 0.8%, as consumer durables output fell by 1.3%, and consumer nondurables output fell by 0.6%. However, intermediate goods output rose by 0.3% and capital goods output rose by 2.8%.
Sequential trends Sequentially output in the euro area is looking much stronger with the 2.6% gain over 12 months, a 1.2% annual rate gain over six months and at a smashing 7.1% annual rate gain over three months. For manufacturing, the 12-month pace is 12.5%, the rate of change over six months is 0.4% at an annual rate, while over three months, manufacturing output is rising at a 4.1% annual rate.
Component growth Component growth is mixed with consumer goods output overall showing negative growth rates over three months and six months, consumer durables transition from declining growth to positive growth over three months while consumer nondurables show positive growth over 12 months, transitioning to progressively weaker six-month and three-month rates of growth. Intermediate goods, however, show acceleration in train with three-month growth at 6%, up from 1.1% over 12 months, and with capital goods output progressively rising from 3.3% over 12 months, to a 14.5% annual rate over three months.
Quarter-to-date results Today's report is through November; quarter-to-date industrial production is up at a 4.4% annual rate, with manufacturing up at 1.4% annual rate. The total industrial production growth rate has the historic ranking in its 65.5 percentile and manufacturing growth only ranks at its 55th percentile. Only two sectors, consumer durables, and (barely for) intermediate goods are the growth rates below their historic medians which means their rankings are below their respective 50th percentiles.
Country level trends Across countries we still see a great deal of weakness with the median EMU reporter showing an output decline of 0.1%. However, Germany has progressed to show a 2.1% increase in November and has logged three straight months of output increases of over 1%. For Germany the 12-month, to six-month, to three-month growth rates have progressed from an annual rate of 1.2%, to 3.9% over six months, to a 22.1% annual rate over three months.
Mixed results monthly To be sure, there are more outsized declines across countries than there are increases. Spain posts an 8.5% output decline on the month. Luxembourg posts a 6.9% decline, with Greece and Portugal each logging declines of 3%; however, in all these cases, these negative growth rates in November are reversing or blunting positive growth rates in October. Countries logging strong growth rates in November are Germany at 2.1%, Italy at 1.1%, and Ireland at 1.4%. Outside of the monetary union, Sweden has a gain of 6% and Norway a month-to-month gain of 3.2%. Germany, Italy, Greece, and Sweden exhibit accelerating growth from 12-months to six-months, to three-months. Luxembourg and Ireland exhibit steadily decelerating growth.
Stronger results on balance sequentially Output growth rates over 12 months, six months, and three months, across monetary union members show over half of them accelerating over the sequential span within the last year. Monthly data from the monetary union and other European reporters remain somewhat inconsistent; however, it's also true we're coming off a very strong October and so the weak monthly November numbers may not be very meaningful. However, this is still leaving us with what are essentially very strong sequential growth rates, from 12-months to six-months to three-months across this group of countries. On a quarter-to-date basis among the 14 countries in the table, only three are reporting quarter-to-date declines in output in progress. Year-over-year growth rates for these countries show standings below their 50th percentile for only four of them, and for Finland the reading is only technically below 50% at 49.6%.
There's a reasonable case being made for the notion that the European Monetary Union is embarking on a revival especially because it seems to be underpinned by Germany which is showing a very strong last three months, very strong sequential growth rates and has logged in addition to this a firm GDP growth rate, after wallowing in recession.
 USA| Jan 14 2026
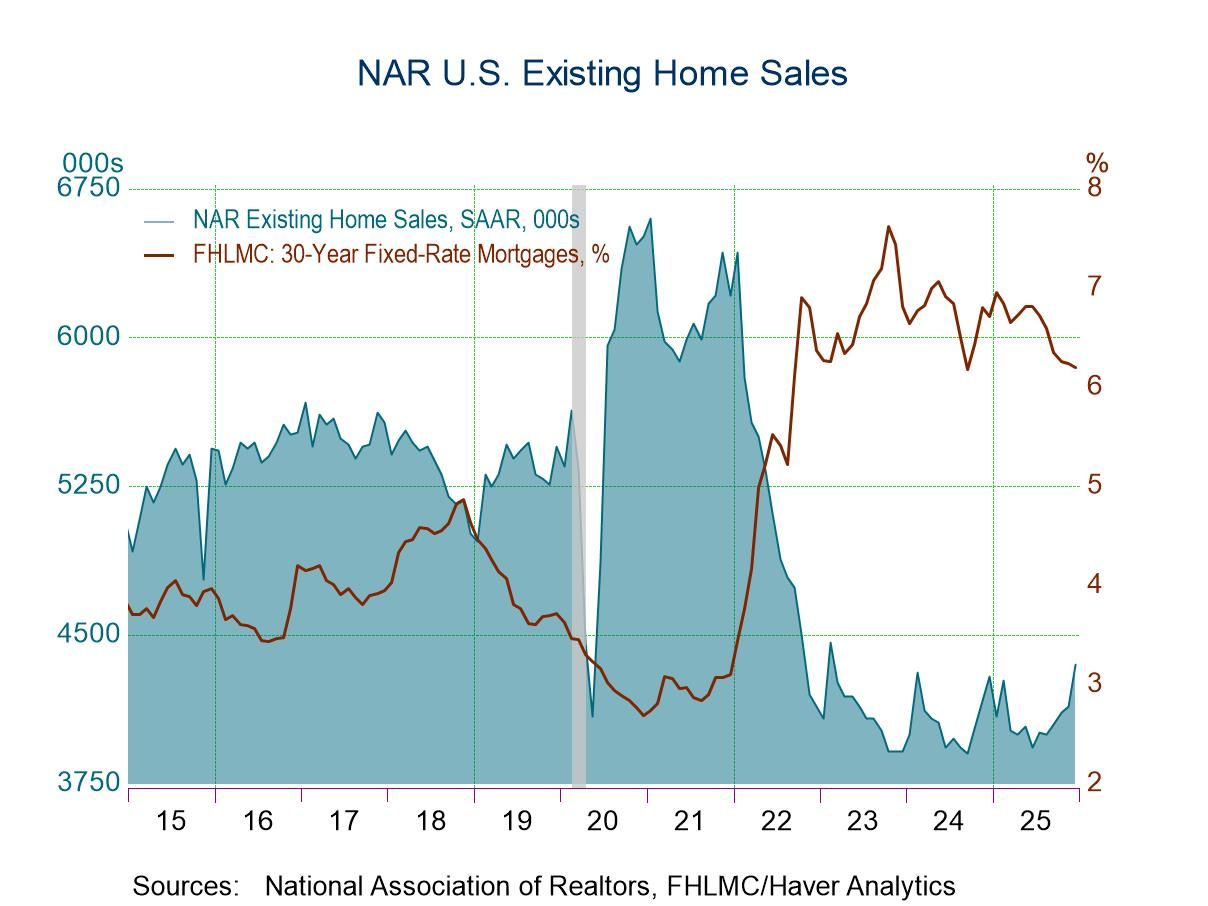
U.S. Existing Home Sales Jumped 5.1% in December
- Existing home sales jumped a much larger-than-expected 5.1% m/m in December, the fourth consecutive monthly gain.
- Month-over-month sales increased in each of the four major areas.
- But year-over-year sales rose only in the South.
- For all of 2025, sales totaled 4.084 million, up slightly from 4.067 million in 2024.
by:Sandy Batten
|in:Economy in Brief
 USA| Jan 14 2026
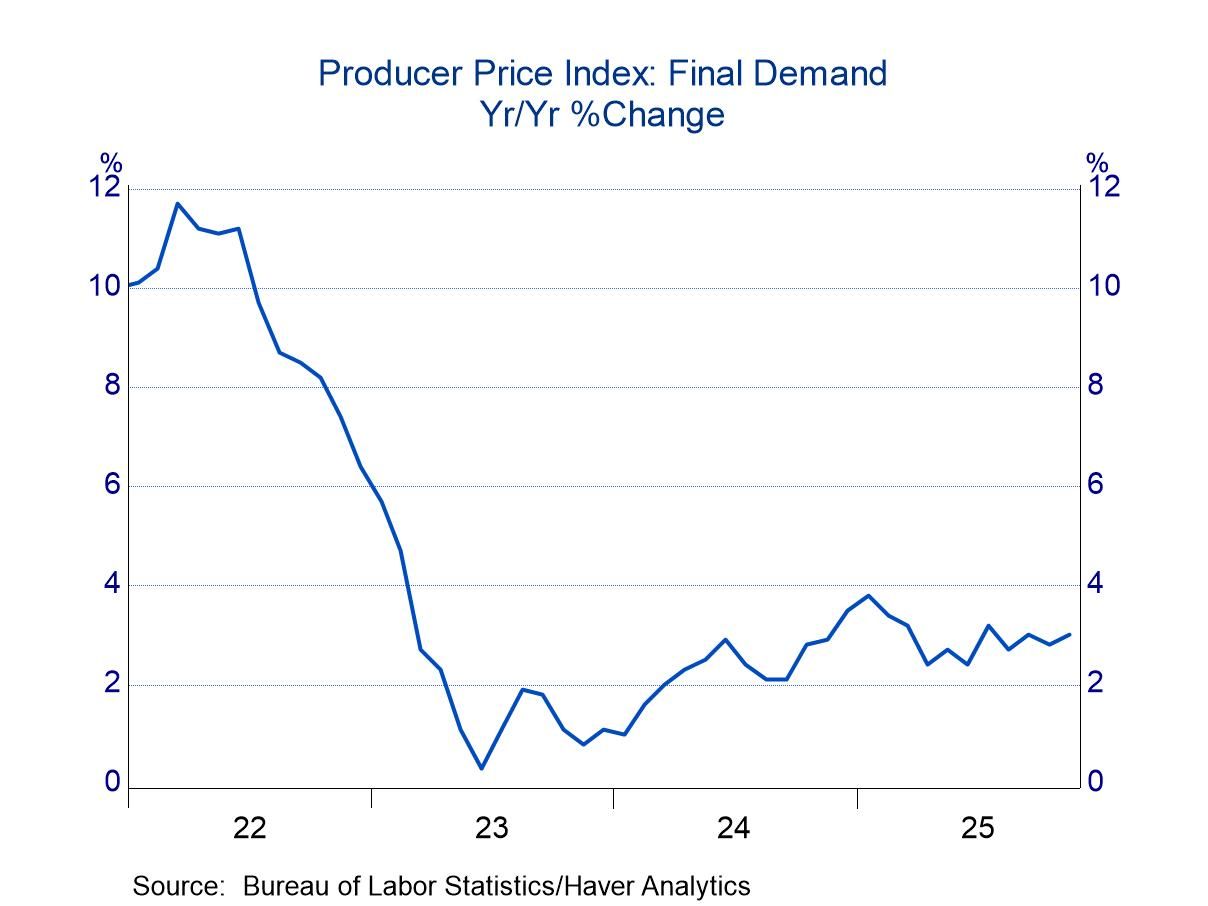
Producer Prices: Range Bound Since Mid-2024
- Offsetting drifts in final demand for goods and services leave inflation steady at 3%.
- Inflation quickens for producers of intermediate goods and services.
- of2725Go to 38 page