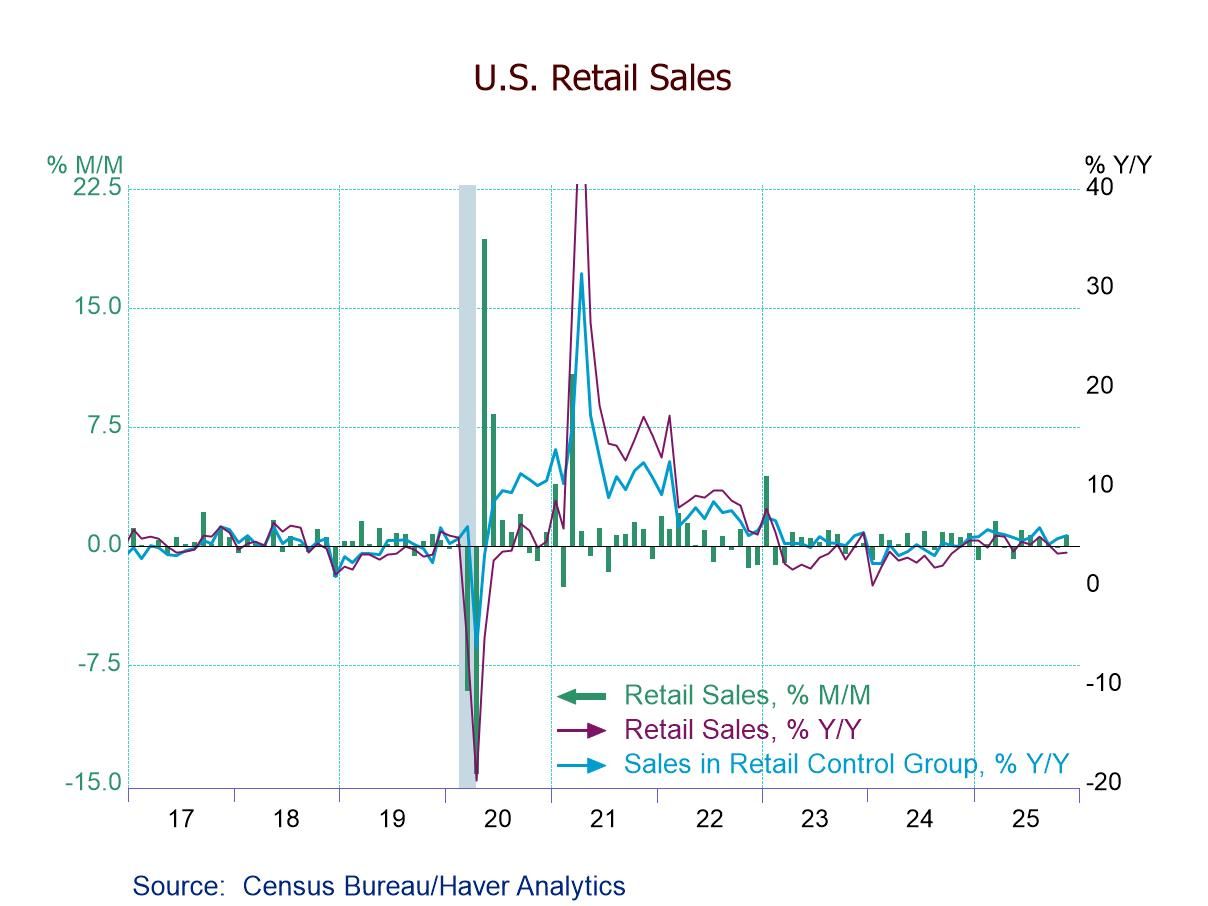
- November total retail sales +0.6% (+3.3% y/y); fifth m/m gain in six months.
- Ex-auto sales +0.5% (+4.3% y/y); auto sales +1.0% (-0.7% y/y).
- Gains m/m: sporting goods (+1.9%), misc. stores (+1.7%), gasoline stations (+1.4%), and bldg. materials (+1.3%).
- Declines m/m: department stores (-2.9%) and furniture stores (-0.1%).
 USA| Jan 14 2026
U.S. Retail Sales Rise More Than Expected in November
 USA| Jan 14 2026
U.S. Mortgage Applications Surged in the Week of January 9
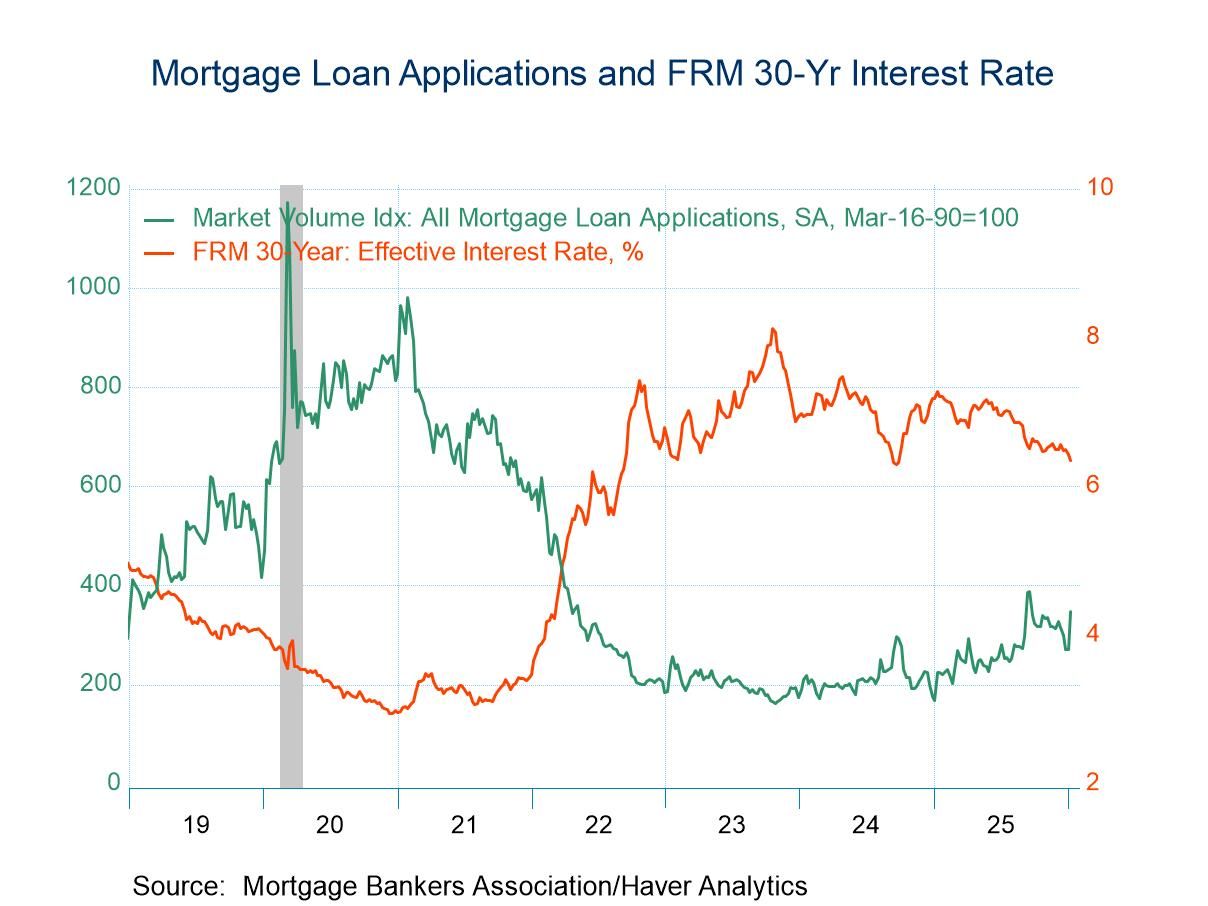
- Purchase and refinancing loan applications jumped in the latest week.
- Effective interest rate on 30-year fixed loans fell to 6.35%.
- Average loan size rose.
 Finland| Jan 14 2026
Inflation in Finland Continues Dive Below 2%
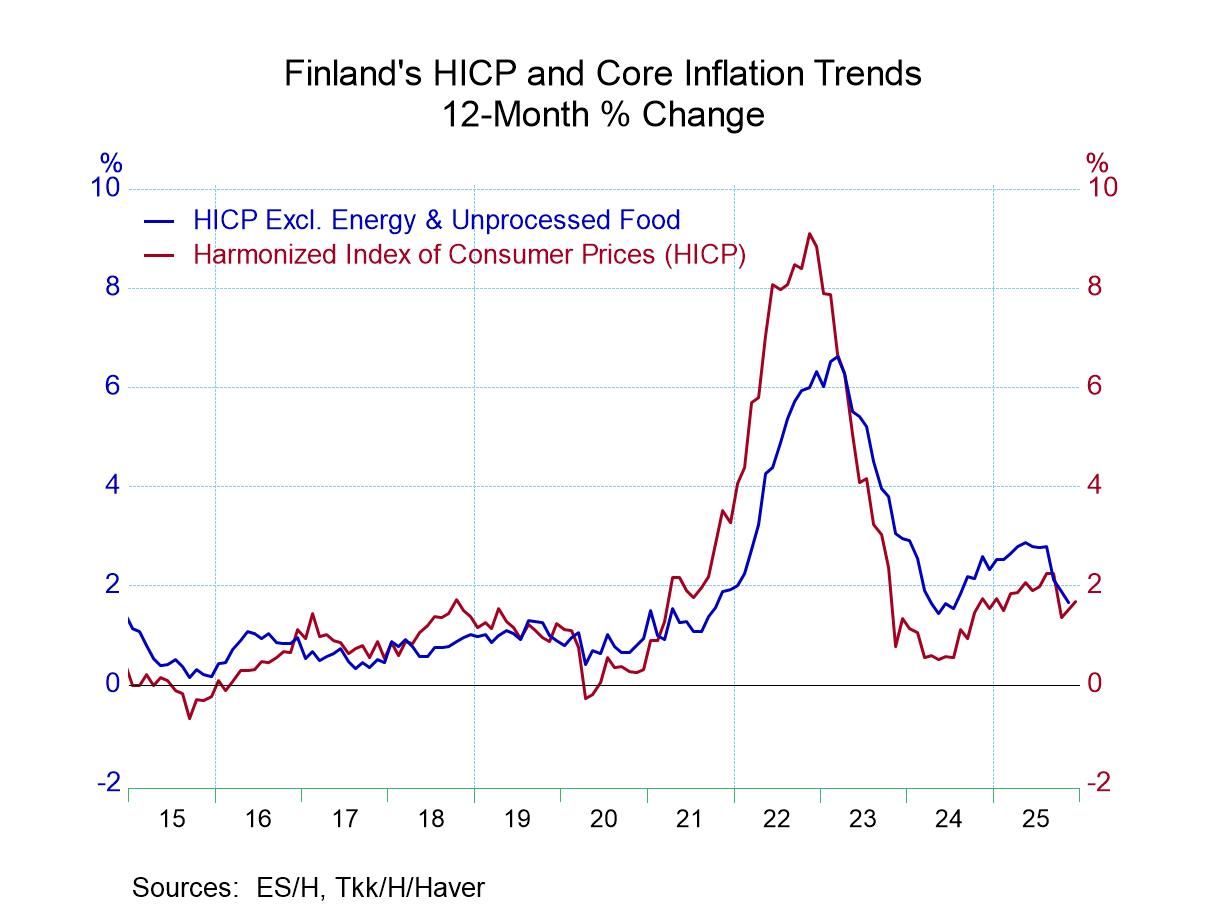
When inflation fell in the post COVID. Finish inflation slipped easily below the 2% mark and then accelerated rather strongly but continued to remain below 2% most of the time until recently. In September of last year, Finish inflation once again made a strong move below 2%. The harmonized inflation rate over 12 months for Finland is 1.3% in October, 1.5% in November, and 1.7% in December. These are all 12-month, year-over-year gains. From October through November, Finland’s core measure of the HICP also has been below 2%.
In December, Finland's HICP measure kicked up its heels to log a 0.3% gain after rising 0.2% month-to-month in November and falling by 0.5% in October. Among the 9 categories that make up the detailed national CPI that's released at the same time as the HICP, four of the components showed gains less than 0.2% with three components showing gains of 0.6% or more on a monthly basis. This followed a November report in which seven of the nine categories and the national index itself showed month-to-month declines and where 55% of the categories decelerated from October. By comparison, in December 85% of the categories accelerated relative to November, but then given the weak nature of the November report, that's not particularly surprising. October had been another month of extremely disciplined prices with the headline HICP falling by 0.5% month-to-month and with six declines in monthly prices, against accelerations in only 35% of the categories. Clearly Finland has been in a period when inflation has been extremely tempered.
Sequential trends showed that the HICP headline measure is up by only 1.7% over 12 months although it's up at a 5.9% annual rate over six months and then up by only a 0.1% annual rate over three months. Inflation accelerates for 40% of the categories over 12 months compared to 12-months ago, it accelerates over 6 months compared to 12-months for 60% of the categories, and it accelerates over 3 months compared to 6-months only 30% of the categories. The year-over-year and three-month performances shows a great deal of inflation discipline in Finland.
The rankings, or queue standings, of the inflation rates show the headline, which is up 1.7% over 12 months at a 56.1 percentile ranking over that period back to 2001. That places the measure on slightly above its median on data back to 2001. The national index, however, is up by only 0.2% over that span. And it has a 14.3 percentile weight extremely weak among the components in the domestic price index: five of them have rankings above the 50-percentile mark overall on 12-month changes back to 2001. The greatest increases are in health & medical care with a 90.4 percentile standing, recreation & culture prices have an 81.7 percentile standing, communication has 83-percentile standing, education has a 55.2 percentile standing, and food & nonalcoholic beverages are close to the median at a 50.4 percentile standing. The weakest prices on the standing basis are housing, fuel & light at an 8.7 percentile standing and as well as other goods & services at a 5.7 percentile standing.
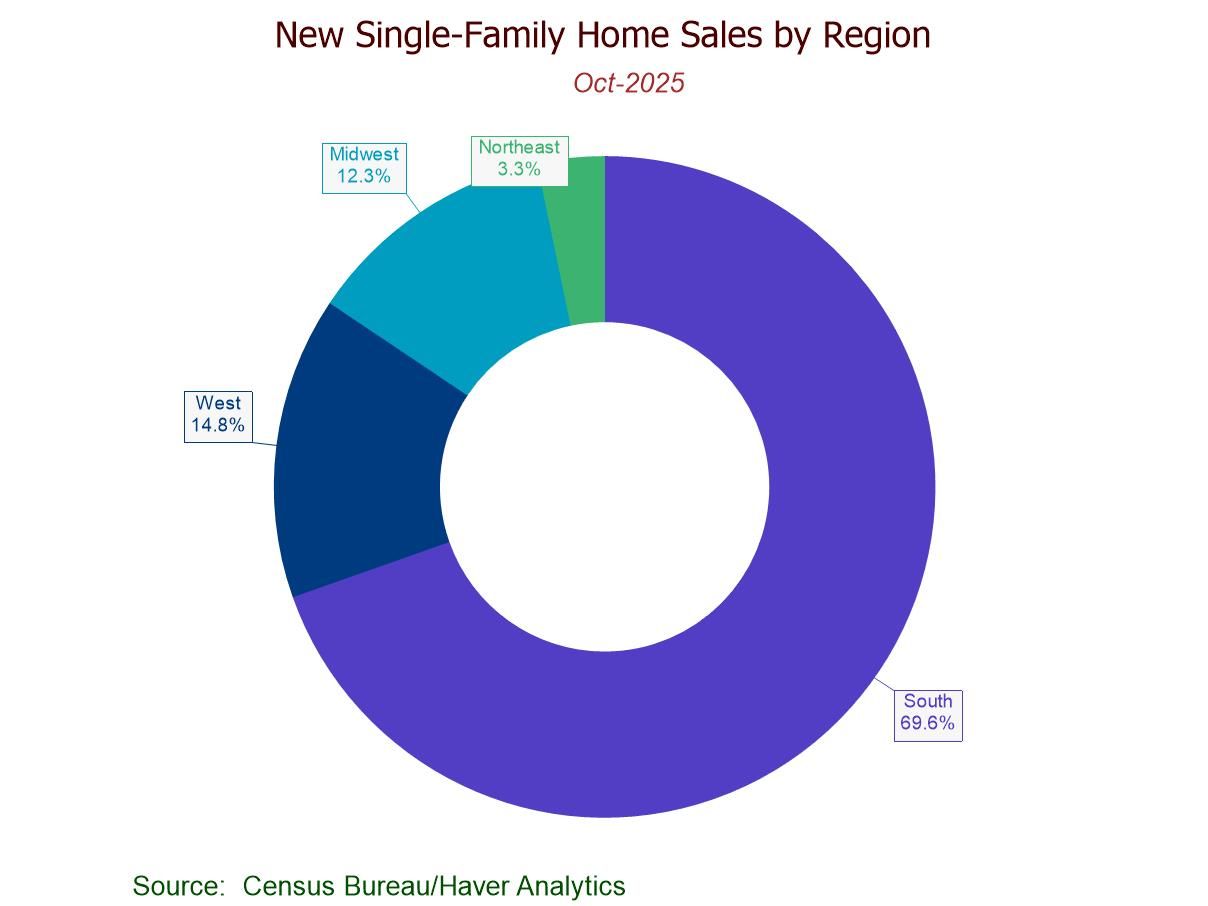
- October sales -0.1% (+18.7% y/y) to 737,000; still 42.0% above the July ’22 low.
- Sales fall m/m in all major regions except the South (+16.9%).
- Median sales price down to $392,300, lowest since July ’21; avg. price up to $498,000.
- Months' supply of new homes for sale holds steady at 7.9 mths., lowest since Sept. '24.
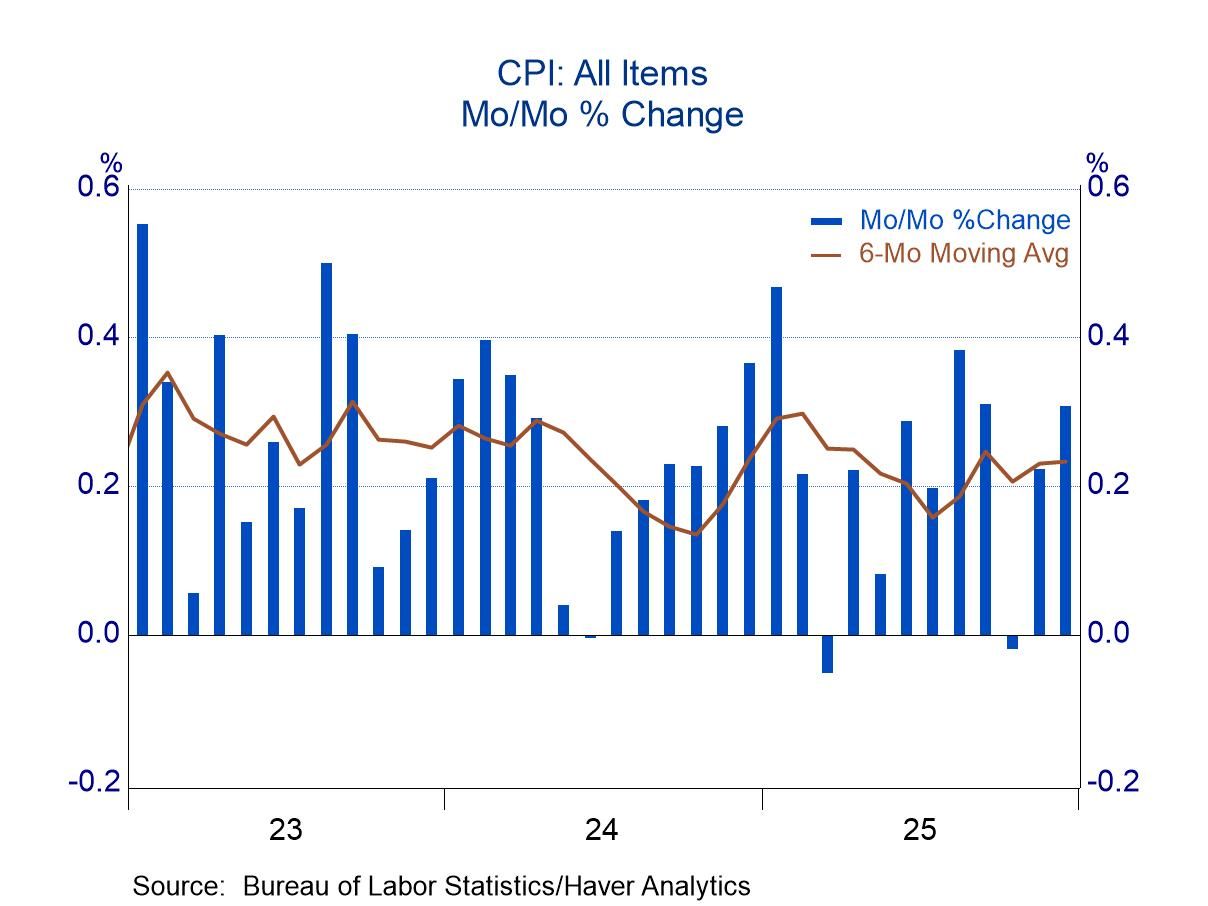 USA| Jan 13 2026
December CPI: Price Increases Quickened After Two Slow Months
- Not by enough to suggest that restraint in October and November reflected distortions from the government shutdown
- But by enough to suggest that October and November reflected normal volatility rather than the beginning of a slower trend.
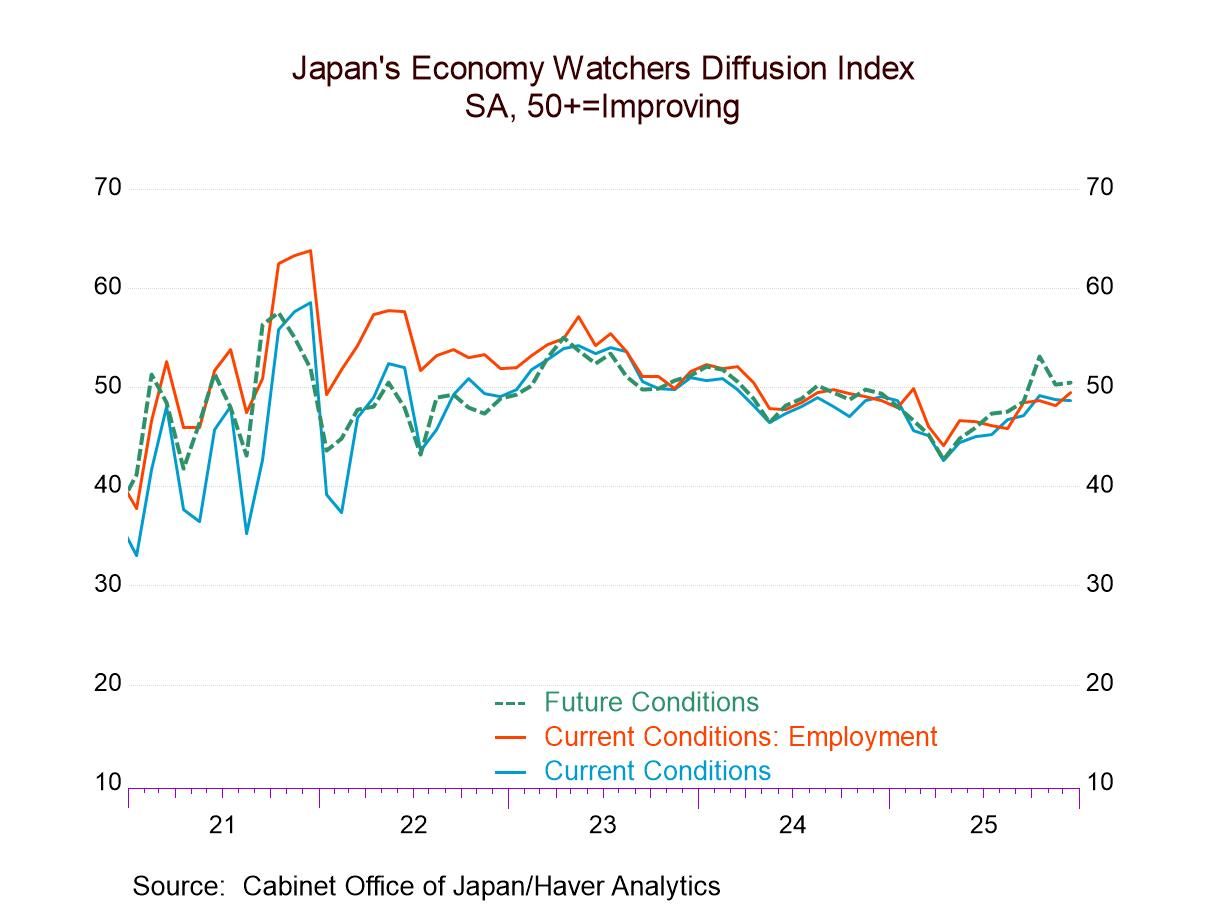 Japan| Jan 13 2026
Japan’s Economy Watchers Survey in December 2025
Japan’s economy watchers index at year-end weakened slightly, but the future index strengthened slightly to counterbalance the drop-off. The December current index is weaker than it was in October as well, as is the headline for the future index. But the queue, or rank, standings of these indexes show the current index at a 60th percentile standing and a queue standing for the future index at its 70th percentile. Despite the end of year give back, the index headline readings are still, for the most part, firm-to-solid.
The Current Index That is an assessment about the rankings of the December data compared to their respective histories back to end 2004- a twenty-year period. However, in terms of the diffusion values of the index per se, the current index has only two readings above the 50 mark indicating actual expansion. Expansion is the rule in current services industries and in nonmanufacturing, a broader sector dominated by services. Employment and readings for corporations overall both show readings close to neutral with diffusion at 49.2 or better, but still short of 50. Current retail at 46.5 is the weakest sector and shows the second weakest diffusion reading.
The current index standings on employment has a reading below 50%- and that is despite having a diffusion reading near 50 -nearly unchanged employment month-to-month. That diffusion reading for December is a low relative to its own history. The strongest two sectors on rankings are services and eating & drinking places with standings in the 70-percentile range. Apart from the weak employment standing, the weakest rankings are in the range of the lower sixty percentiles with only retailing lower, in its 56.5 percentile, manufacturing at its 61.7 percentile.
The Future Index The Future index has a slightly higher queue standing than the current index as noted above, but it is not vastly different. No future components rankings are below their 50%, but again, employment is weakest with a ranking in its 50th-percentile and with housing in its 53rd percentile. Nonmanufacturing and services have the highest queue standings.
In terms of diffusion readings as opposed to standings, the future index headline is above 50 unlike for the current headline. Six of nine observations in December have future readings in their respective 50.6 percentiles. The weakest future reading, housing, with a 46.2 reading, is followed by retailing and eating & drinking places, each at 49.6. But the above-50 readings ae not strong per-se either. The strongest is the services sector at 52.4, then nonmanufacturing at 51.7, followed by employment at 51.4 (and it has the weakest queue standing among future readings). Corporations have a diffusion reading at 50.9, households at 50.3, and manufacturers at 50.2. And that 50.2 reading for manufacturers has a 70.4 percentile standing.
Always remember that diffusion and the rank standings are different things and very different concepts even though they are both measured as percentages; they can be quite different. Various series have different histories and tendencies. Not too surprisingly the current and future diffusion readings are highly correlated (0.96) while the standings are not so well correlated in December between the current and future (0.37). The correlation I speak about above between diffusion and standing is at 0.20 for the current readings in December but is higher at 0.53 for the December future components.
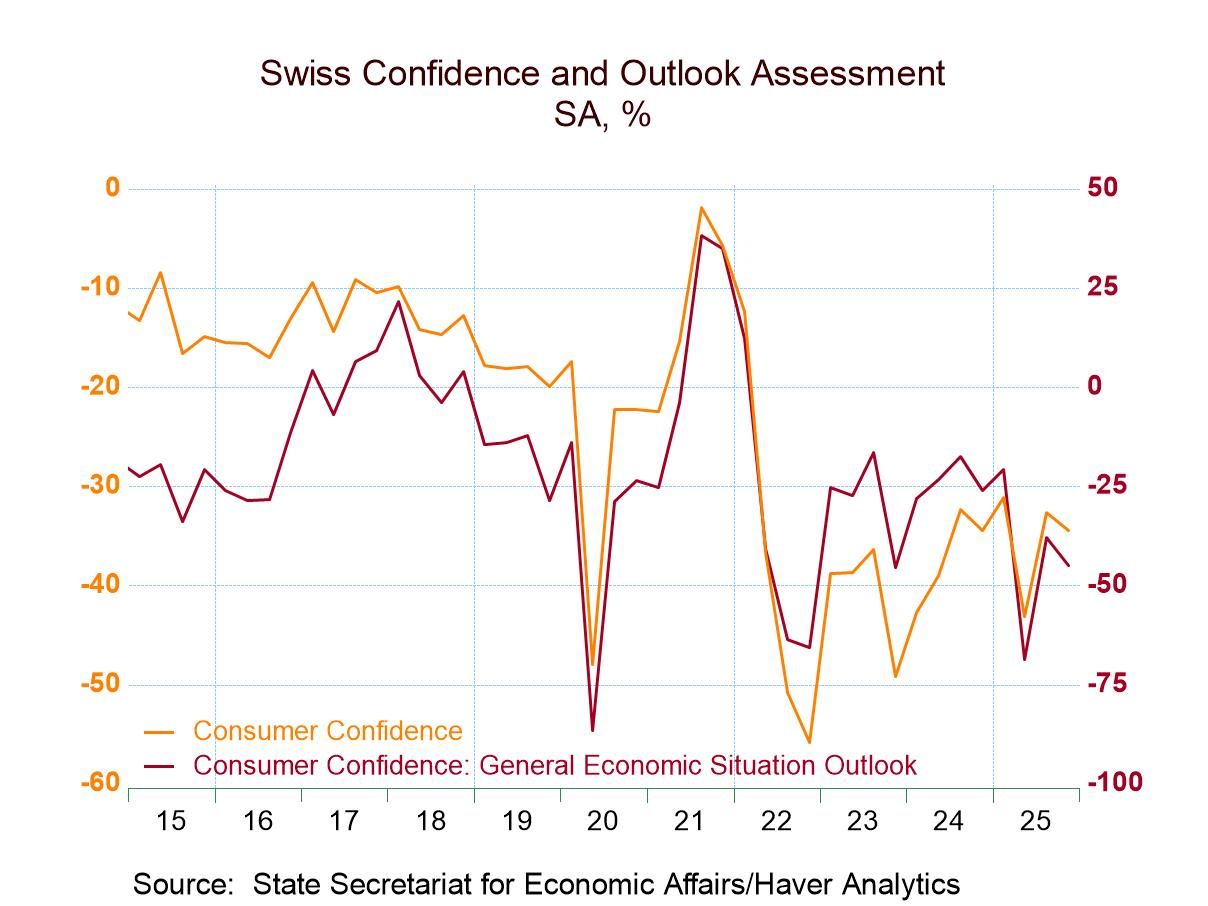 Switzerland| Jan 12 2026
Swiss Confidence Sags at End-2025
Swiss consumer confidence at end-2025 (in Q4) fell to -34.5 from -32.7 in 2025-Q3. The average level for the confidence reading on data back to 1982 is -16.7 and the current queue standing is 13.9%. The Q4 reading is clearly weak- well below its own average and weaker than this month, less than 15% of the time.
Outlook confidence in Q4 fell to -44.9 from -38.0 in Q3, registering a 15.6 percentile standing. The past confidence reading at -61.2 at end-2025 is down from -43.5 at the end of the third quarter. The standing for this reading is in its 19th percentile. All of these are extremely weak readings.
People provide a job security response in Q4 that eases to -50.1, still well above its historic average of -58.2 for a queue ranking at its 57th percentile.
Personal financial readings are moderate to weak across the board. However, current financial conditions rose to 38.4 in Q4 from 35.2 at the end of Q3 and a queue standing above its median at its 56th percentile. But the outlook for financial conditions is much weaker and also weakened quarter-to-quarter to -31.4 in Q4 from a level of -28.6 in Q3 to a queue ranking in its 8.7 percentile. The evaluation of past financial conditions improved by a very small margin, rising to -38.3 in Q4 from -38.7 in Q3, and to a queue standing at the 11.6 percentile.
The spending environment in Switzerland improved slightly but remained weak, rising to -23.3 in Q4 from -25.5 in Q3 to a standing at their 23.1 percentile standing.
The best part of the report is that the perception of job security is above average, and the current financial situation is above its median. After that, all the individual assessment metrics are weak including overall confidence – everything except assessments for inflation.
On the inflation front, the price outlook is high, rising to a reading of 97.7 in Q4 from 95.8 in Q3 but is still below the second quarter reading at 113.1. The price outlook has a moderately high standing at its 70.5 percentile. This standing is slightly below the standing for prices past which is at 76.3%. The past metric was still rising in the fourth quarter but was weaker than its reading in both Q1 and Q2 of 2025.
 Asia| Jan 12 2026
Economic Letter from Asia: A Bumpy Start
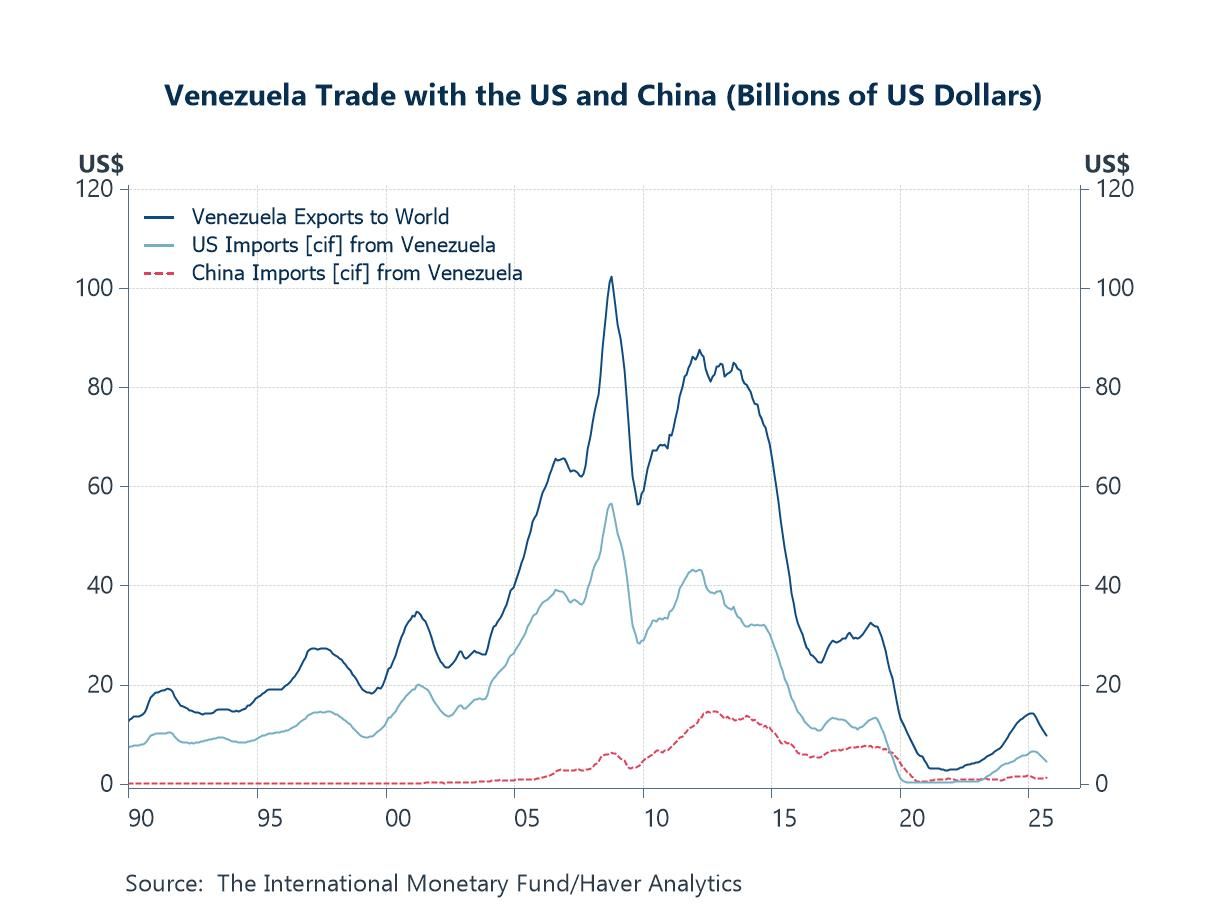
This week, we highlight several pertinent developments that have shaped the start of the year and may carry longer-lasting implications. To begin with, the recent capture of former Venezuelan President Maduro by the US authorities and the subsequent crude oil trade deal could have far-reaching effects—potentially altering China’s imports of Venezuelan crude and broader bilateral trade dynamics (chart 1), as well as global energy supply considerations (chart 2).
In Japan, Prime Minister Takaichi’s reported consideration of early snap elections, if enacted, would likely inject near-term political uncertainty (chart 3). However, should her gambit succeed, it could reduce policy uncertainty and pave the way for more fiscal policy activism. Against this backdrop, it is unsurprising that investors remain divided over the timing of the Bank of Japan’s next policy tightening, although the upcoming Spring wage negotiations (chart 4) ought to provide clearer signals for the monetary policy outlook.
Turning to investor expectations from the latest Blue Chip survey, India is once again seen as the growth leader among major Asian economies, while also poised to record the highest inflation (chart 5). China, by contrast, is expected to deliver sub-5% growth this year alongside muted inflation. Lastly, in Southeast Asia, pockets of geopolitical tension persist—notably between Thailand and Cambodia (chart 6)—as Thailand prepares for snap elections next month.
The US, Venezuela, and China 2026 got off to a turbulent start following a recent US military operation in Venezuela that resulted in the capture of former President Maduro and his transfer to the US to face drug-related charges. In the aftermath, Venezuela’s former vice president (Delcy Rodriguez) was sworn in as interim leader, while US and Venezuelan authorities have reportedly already reached a new crude oil deal. Under the agreement, Venezuela would sell 30–50 million barrels of crude to the US at market prices, with the proceeds controlled by the US. These developments have several potential implications. First, some Venezuelan crude initially destined for China would likely be diverted to the US. China has been the main buyer of Venezuelan oil in recent years, although this is likely underreported in official data (chart 1), which would tighten conditions for the crude-import-dependent country. Second, an eventual increase in Venezuelan crude supply—previously constrained by heavy US sanctions—would likely exert downward pressure on global oil prices, all else equal, although significant challenges remain, as discussed below.
- of2725Go to 39 page