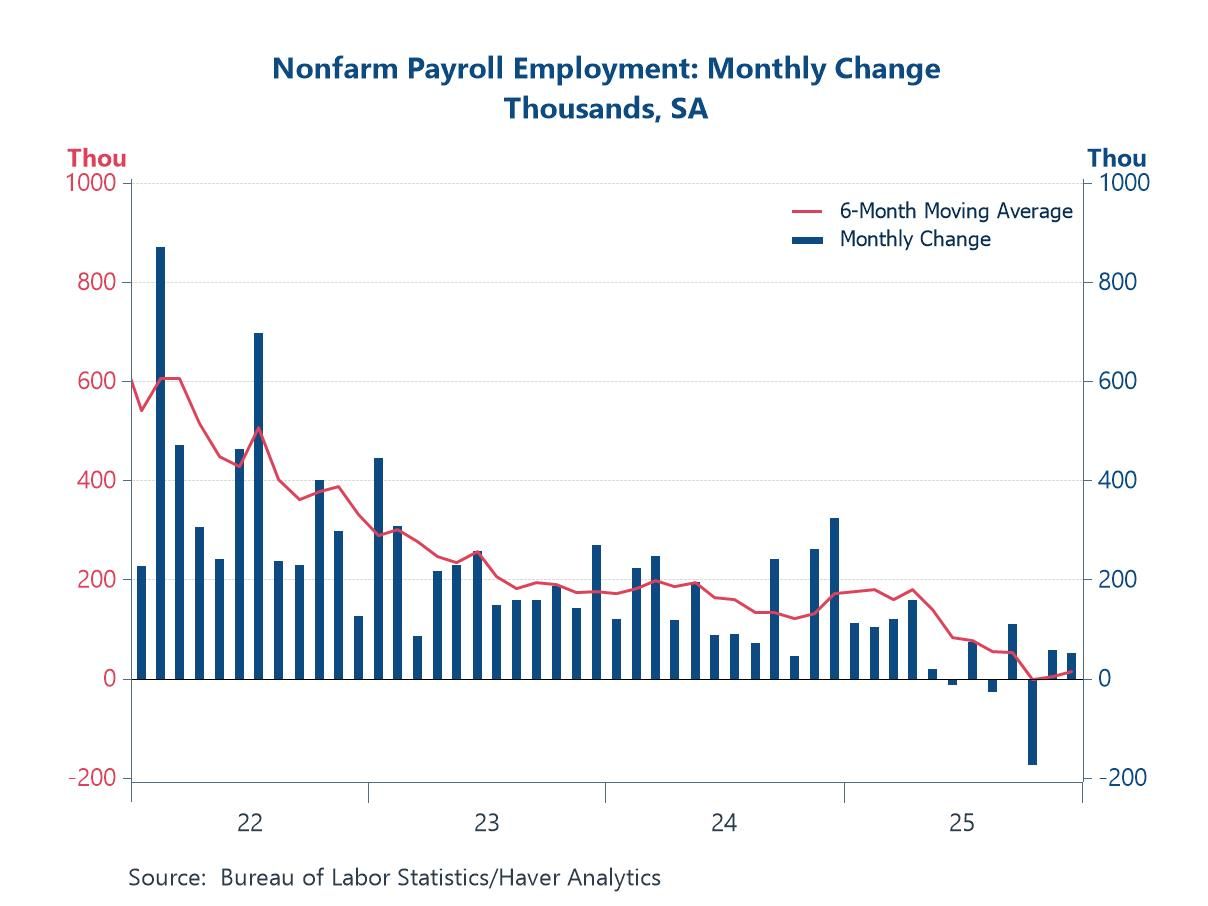
- Modest job growth in December, and downward revisions in October & November.
- The unemployment rate, though, inched lower.
 USA| Jan 09 2026
A Soft Tone in the Labor Market
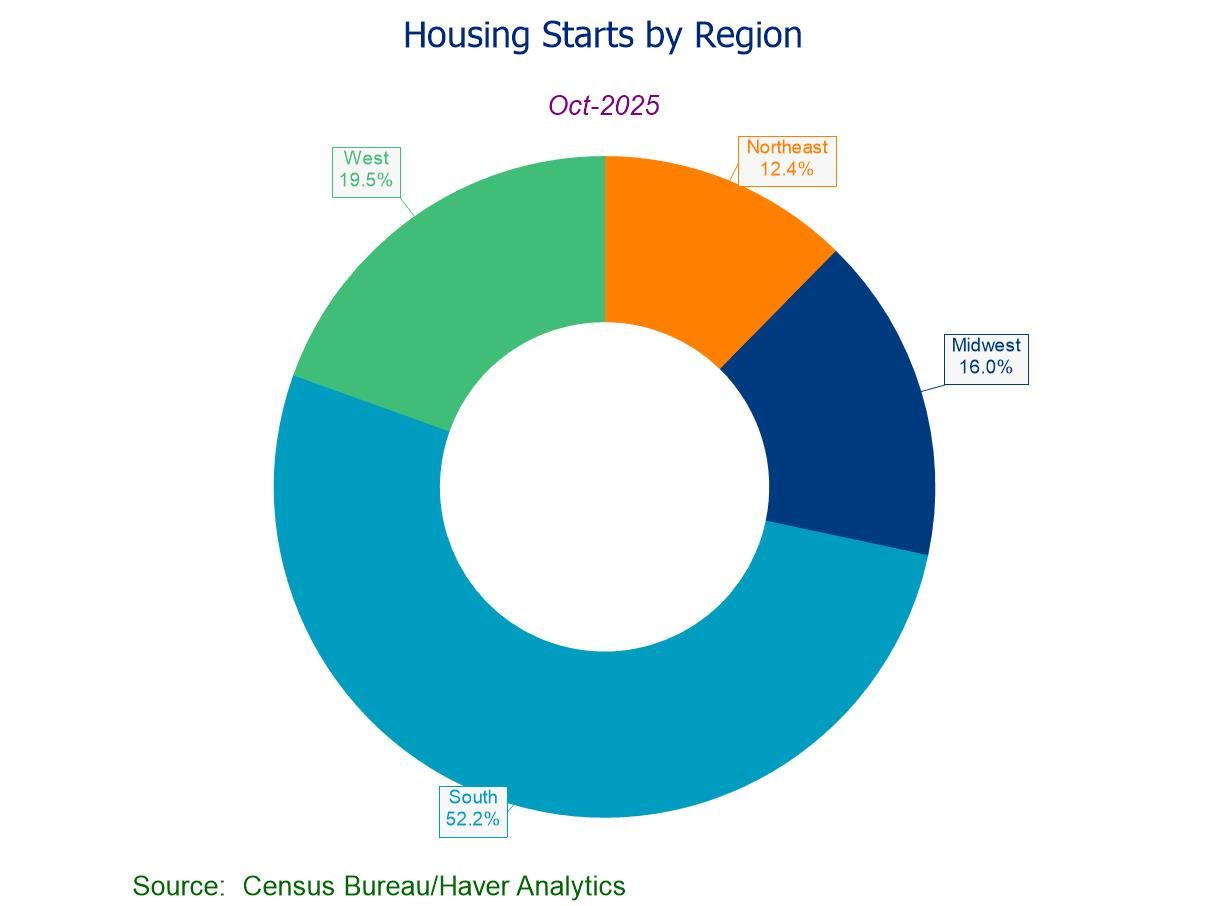
- Housing starts -4.6% (-7.8% y/y) to 1.246 mil. in Oct.; second m/m fall in three months.
- Single-family starts up to a three-month high; multi-family starts down to a five-month low.
- Housing starts m/m down the West and Northeast but up in the South and Midwest.
- Building permits fall for the sixth time in seven months, led by a drop in single-family permits.
 Germany| Jan 09 2026
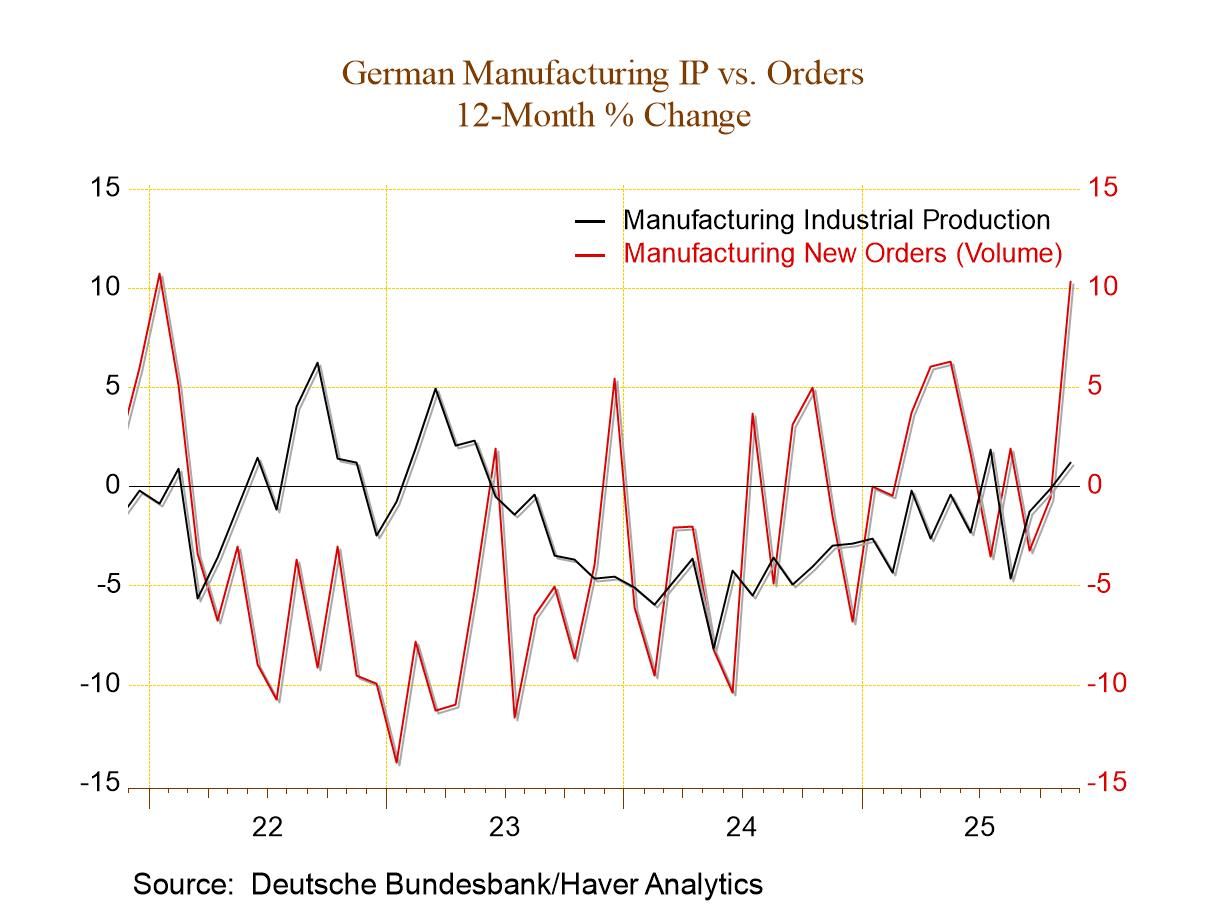
German Industrial Production Perks Up-Surprise!
German industrial production advanced by 0.8% month-to-month in November performing better than had been expected. Consumer goods output fell by 0.3% month-to-month, capital goods output soared with a 4.9% gain, while intermediate goods output fell back by 0.8%.
On the whole, manufacturing output had been expected to be weak. But looking at manufacturing alone, rather than total industrial production, the gain was even stronger at 2.1% month-to-month. Real manufacturing orders in November rose by 5.6%, real sales in manufacturing rose by 2.7%. This is solid performance.
Survey data have been weak and listless However, apart from anecdotal evidence, as monthly data unfold, the kinds of numbers that we have to look at first are various economic surveys that come from diffusion data. The ZEW’s current index was slightly stronger month-to-month at a still very weak -78.7 (net) reading compared to -80 in October although both of those were weaker than the ZEW net September reading of -76.4. IFO manufacturing weakened month-to-month in November at 87.1 compared to 88.1 in October and it was slightly weaker than its September value as well. IFO manufacturing expectations slipped to 94.1 in November from 96.9 in October although expectations were slightly higher than their level in September. The EU Commission index weakened in November to -18.9 from -18.1 in October although there was an improvement from -20.1 in September.
These comparisons show us that the survey data which we had in hand before getting the industrial production reading from Germany had given us a lot of weak readings and a lot of very weak momentum.
Compare survey data to IP data using ranking technique We can compare industrial production data to survey data using two different columns in this table. The first is the queue standing column where we see the industrial production data with rankings mostly in their 50th percentile: intermediate goods have a ranking of 37.7% with construction at 33.4%; they are the weaker exceptions. We rank IP data by sector according to their annual growth rates compared to past growth rates. However, by comparison the survey data (that we rank on levels) range between 12.1% and 29.8%; all of those are very weak readings. No wonder a focus on survey data leads to a weak upcoming assessment of production data. We can also look at a slightly more up-to-date, but shorter ranking, from January 2021. There we see that the industrial production data average rankings from the mid-60th percentile up to the 81.4 percentile for total industrial production. Surveys generally have rankings in the 20th and 30th percentile with the exception of IFO manufacturing expectations which reaches 67.8%, which is a solid reading.
 Global| Jan 08 2026
Charts of the Week: Cooling Inflation, Diverging Growth
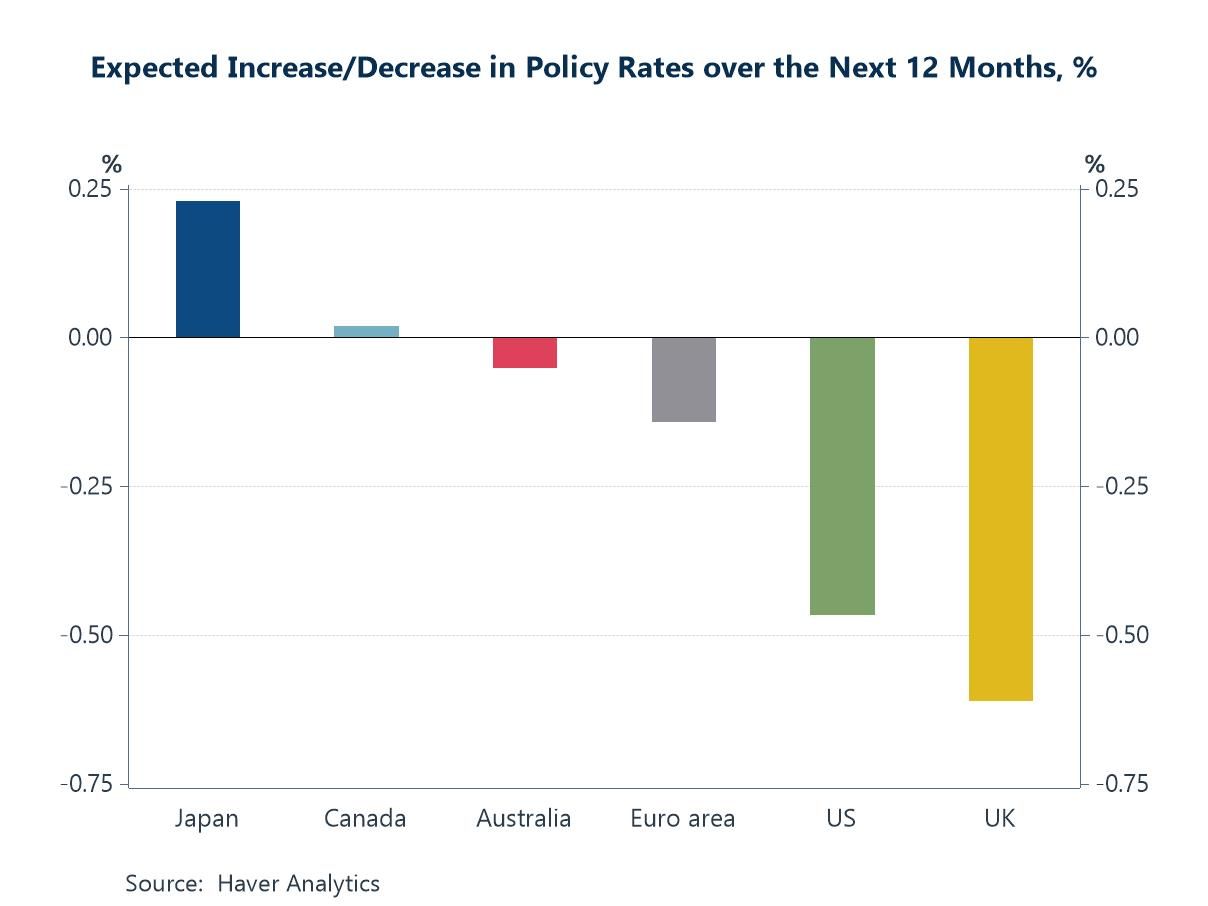
Over the past few weeks, global financial markets have taken comfort from cooling inflation, resilient earnings and continued upside surprises in the dataflow, with equity markets extending gains as confidence in a soft-landing outcome has firmed. While AI-related optimism was questioned toward the end of last year, amid valuation concerns and uncertainty over near-term payoffs, sentiment has improved again in recent days. Latest business surveys suggest little immediate cause for alarm on the global growth front (chart 1), despite clear signs of divergence across regions. At the same time, there are few near-term inflation concerns evident in the data, with global supply-chain pressures remaining subdued (chart 2). Taken together, these developments leave little immediate challenge to the prevailing outlook for monetary policy, with expectations for further gradual easing across several major economies remaining broadly intact (chart 3). At the same time, geopolitical shocks — most notably the upheaval in Venezuela — have reignited focus on energy market risks and sovereign debt uncertainties, adding complexity to oil price expectations and fiscal trajectories (chart 4). Shifting focus, China’s role also continues to remain pivotal: surplus industrial capacity and competitive export pricing continue to shape global trade and exert disinflationary influence (chart 5). Against this backdrop, public debt levels that are both elevated and still rising in many large economies underscore the structural imbalances that could limit policy flexibility and amplify market sensitivities in the immediate months ahead (chart 6).
by:Andrew Cates
|in:Economy in Brief
 USA| Jan 08 2026
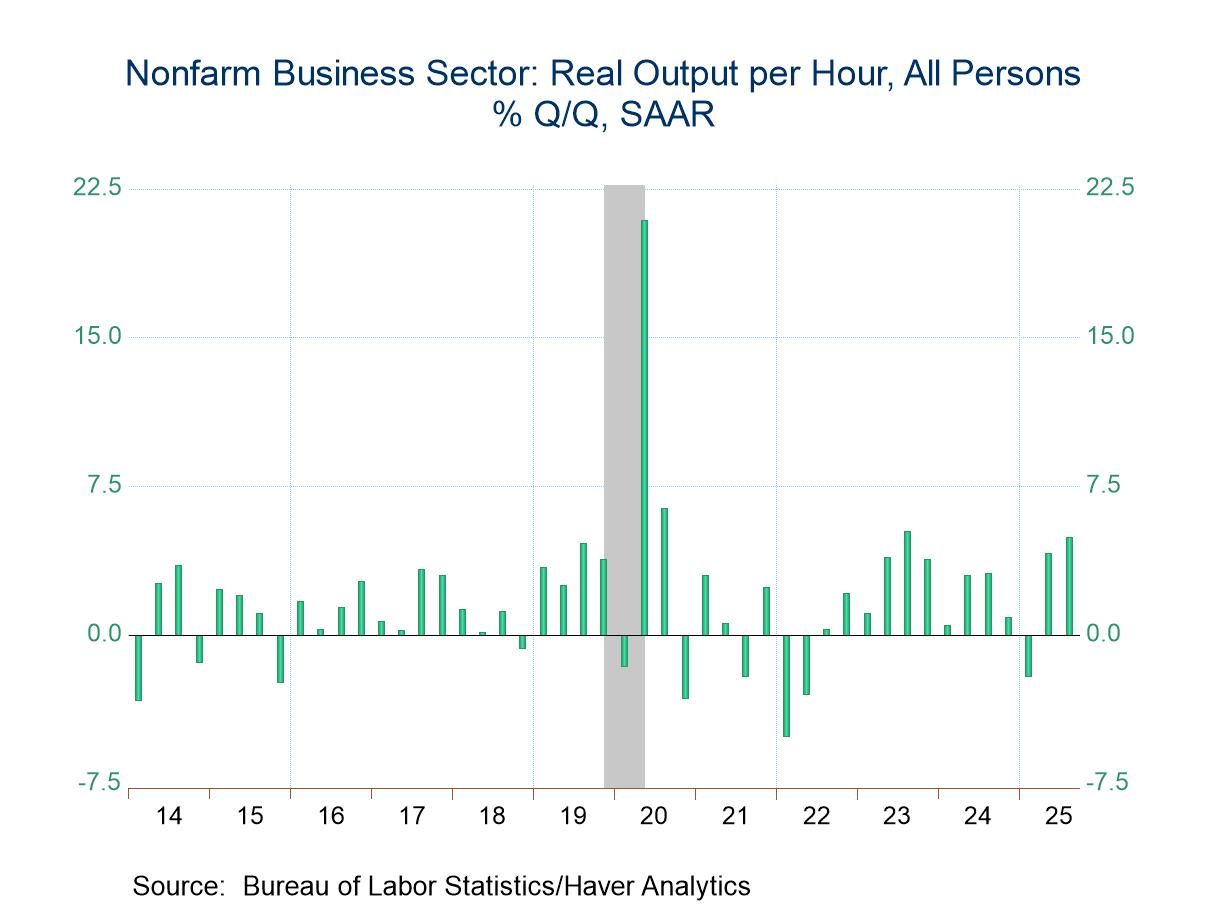
U.S. Productivity Jumped in Q3; Unit Labor Costs Fell
- Nonfarm business output per hour rose 4.9% q/q SAAR in Q3 on top of an upward revision to Q2.
- Compensation increased 2.9% in Q3 resulting in a 1.9% quarterly decline in unit labor costs.
by:Sandy Batten
|in:Economy in Brief
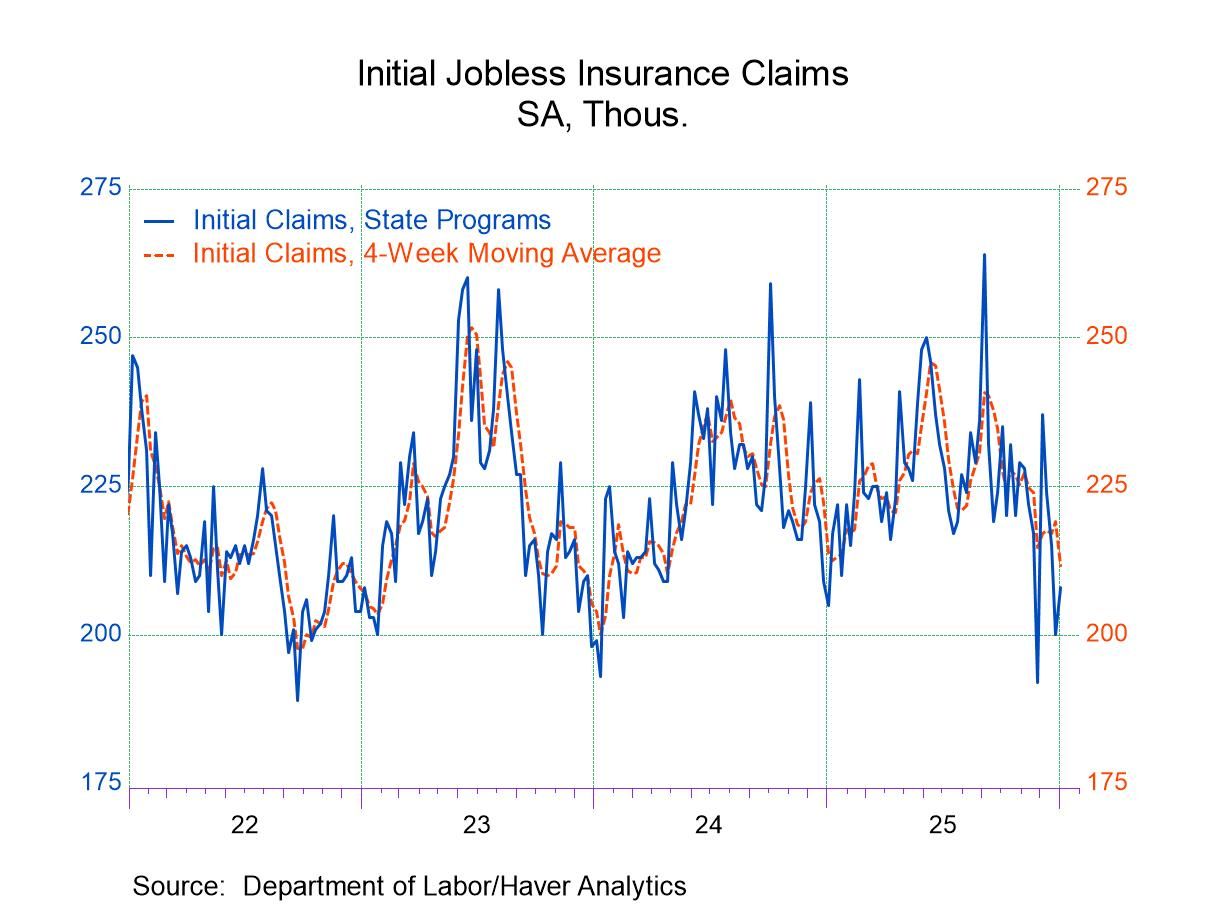
- Initial claims rose moderately from the prior week.
- Continuing claims increased from the prior week.
- The insured unemployment rate was unchanged.
 Europe| Jan 08 2026
EU Indexes for EMU Weaken at Year-End
The EU indexes for December 2025 showed slight slippage as the overall index fell to 96.7 from 97.1 in November for the whole of the European Monetary Union. Sectors showed slippage in consumer confidence and retailing; confidence slipped to -13.1 in December from -12.8 in November as the retail rating slipped to -7 in December from -6 in November. The services sector and the industrial sector were each unchanged on the month, with the industrial reading at a net standing of -9 and the services reading at +6. Improving month-to-month was construction where the index rose to a -1 in December from -2 in November.
Queue standings of sectors The queue (or rank) standings for the overall reading as well as the sector readings largely cluster around the lower one-third of the range of values on data back to 1985, where applicable. Retailing and construction are exceptions, with retailing at an above-median standing at a 51.3 percentile and construction at a solid and strong 81.6 percentile standing in December. The weakest reading is for consumer confidence at the 23.1 percentile standing followed by the industrial sector at a 30.5 percentile standing; services check in at a 37.9 percentile standing. The rank standing for the overall monetary union is at 34.4%, just slightly above the bottom one-third mark for all ranked observations over the period.
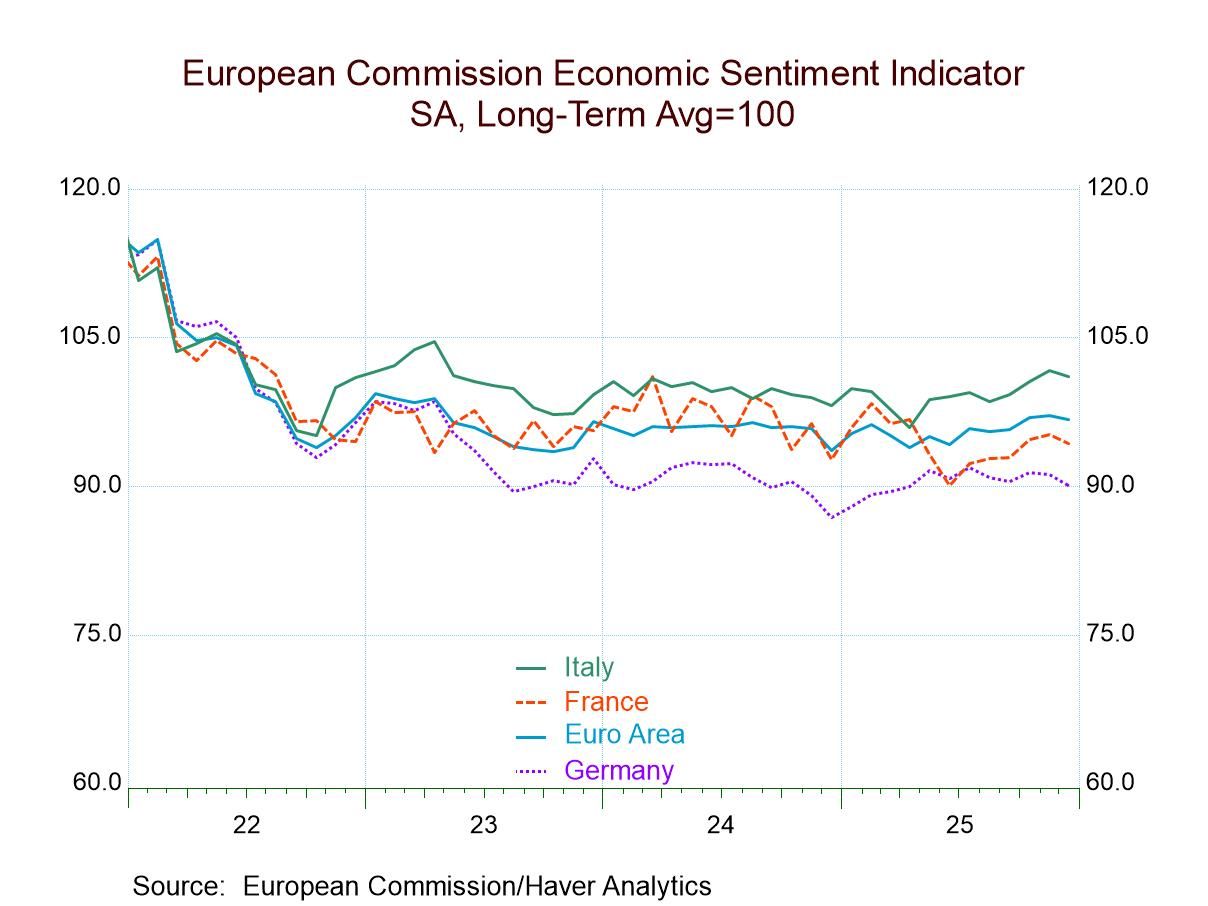
Country results 18 countries report detail in this survey. Seven of the 18 showed declines in December; this is up substantially from November when five showed declines and compares to October when eight countries showed declines. An unfortunate feature of December is that the headline reading for the monetary union weakens as well as readings for each of the four largest monetary union economies Germany, France, Italy, and Spain.
The two largest monetary union economies, Germany and France, have the weakest rank standings among the BIG4 with Germany at a 15.7 percentile standing and France at a 29.5 percentile standing. Italy and Spain each have standings above the 50% mark placing them above their medians for Italy with a reading of 54.2 percentile, while for Spain it's a 61.2 percentile standing.
Standings across smaller economics Across the remaining monetary union countries, six of the 14 readings are above their 50th percentile, while eight of the 14 are below their 50th percentile. Well, the large countries are experiencing a significant split; the rest of the monetary union appears to be in much the same condition, with approximately half of them performing at above-median conditions and half performing at below-median conditions.
Country stories The chart of the monetary union indexes by sector shows us that there has been little change and little trend in these observations. Across countries Germany has definitely been the weakest country among the BIG4, while Italy has been the strongest. Inflation data have showed inflation beginning to heat up in Spain, and Spain does have the strongest queue standing among the four largest monetary union economies - so that might be something to keep an eye on going forward. Conditions in Germany and France are still quite weak and seem unlikely to force an increase in inflation.
Smaller economies- some specifics And so, the rest of the monetary union economies show tiny Malta, which is hardly a price-maker, has a strong 99.6 percentile standing, followed by 70th percentile standings in Greece and then Lithuania. Portugal and Cyprus have readings in their 60th percentiles. For the most part, these are modest readings but above their medians, of course. Among the weak economies in the rest of the union, the weakest is Belgium with a 16.9 percentile standing, followed by Estonia at a 28.4 percentile standing, Luxembourg at a 32.8 percentile standing, and Austria at a 33-percentile standing. After that, Finland’s standing goes to 37.7 percentile with the Netherlands, Slovakia, and Latvia all with readings in their 40th percentiles indicating moderate undershooting relative to their respective medians.
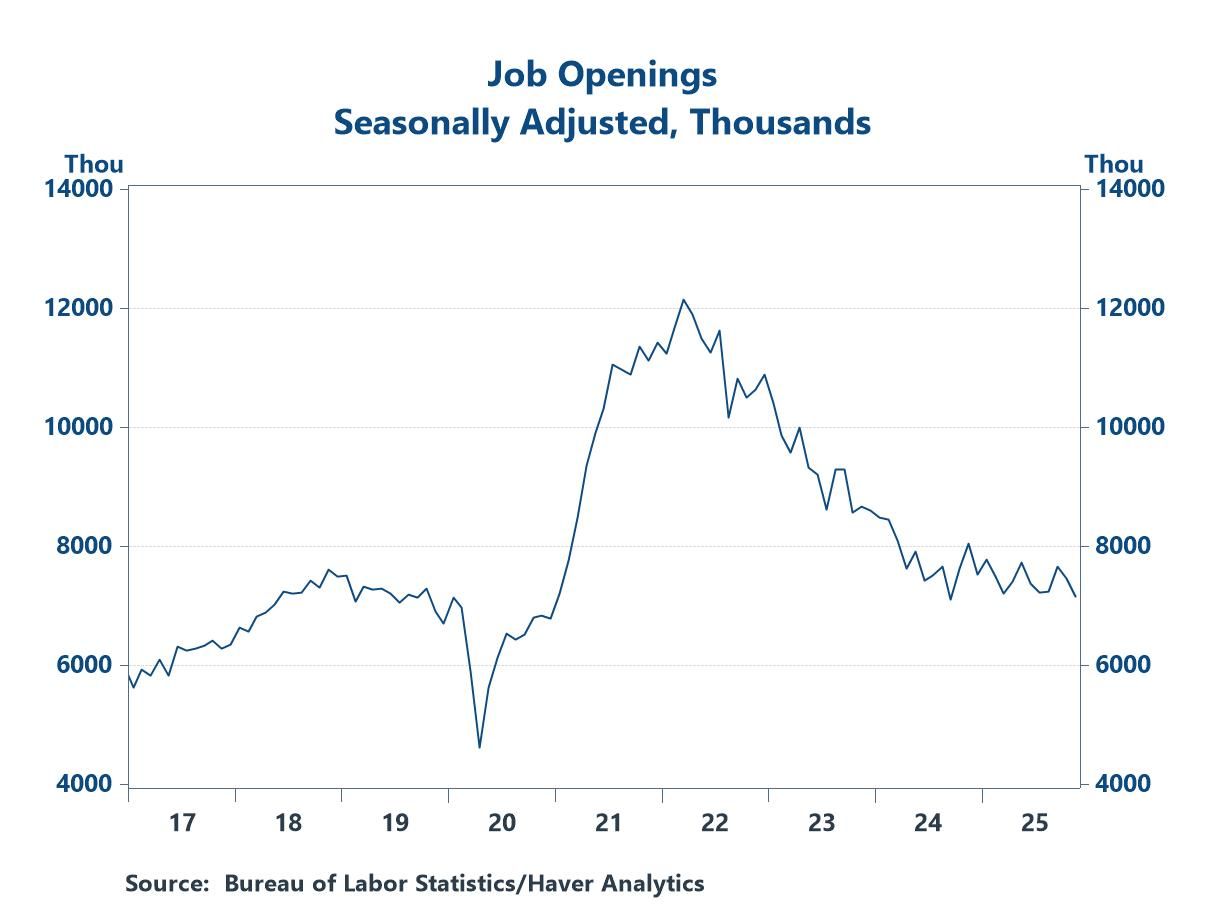
- Job openings have eased considerably from the elevated levels seen during the post-pandemic recovery, but they are in line with pre-pandemic norms.
- Businesses are not rushing to fill posted positions.
- of2725Go to 40 page