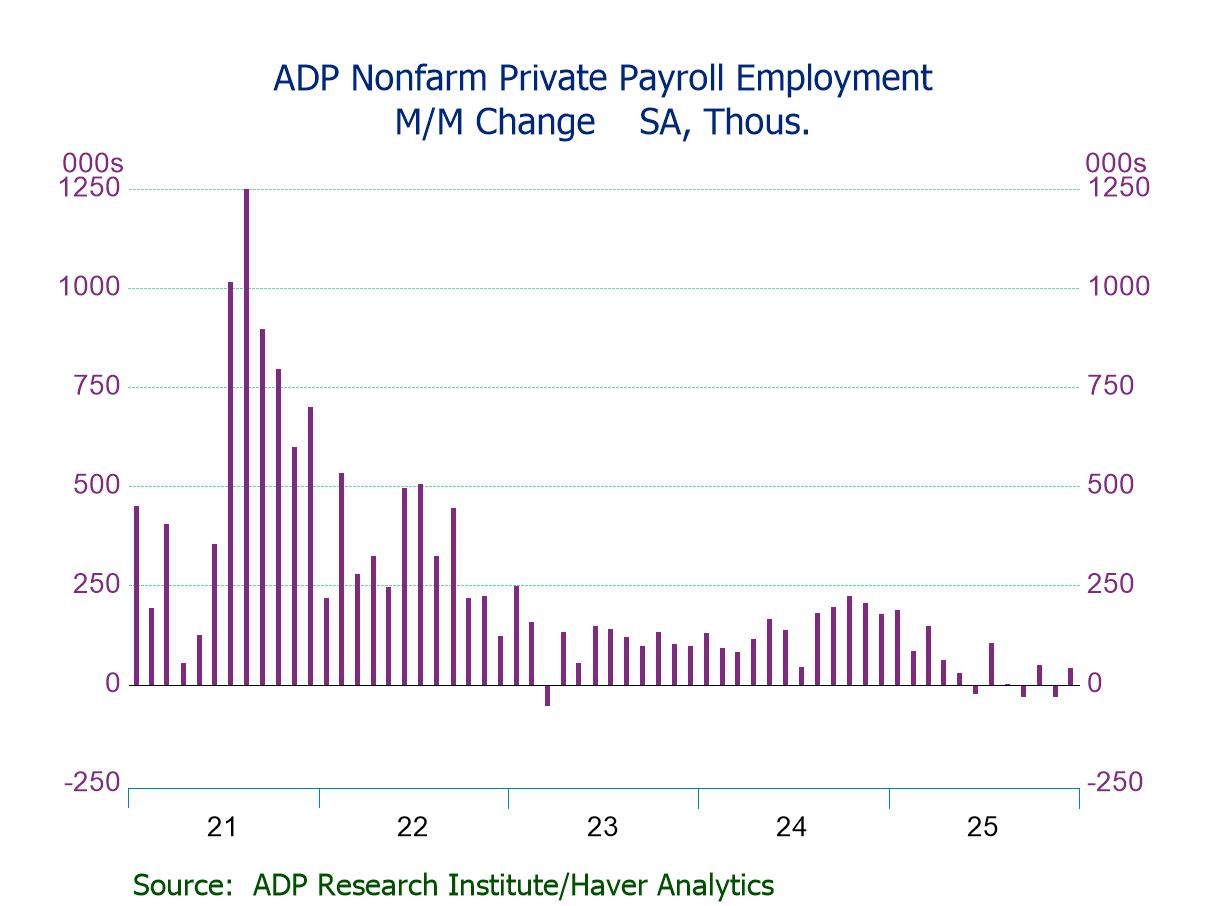
- Private payrolls +41K; second m/m increase in three months.
- Hiring increase is driven by medium-sized businesses (+34K).
- Service-sector jobs up (+44K), led by education & health svs. (+39K) and leisure & hosp. (+24K); goods-producing jobs dip (-3K).
- Wage growth accelerates y/y for job changers (6.6%) but steady for job stayers (4.4%).
 USA| Jan 07 2026
U.S. ADP Private Employment Rebounds in December
 USA| Jan 07 2026
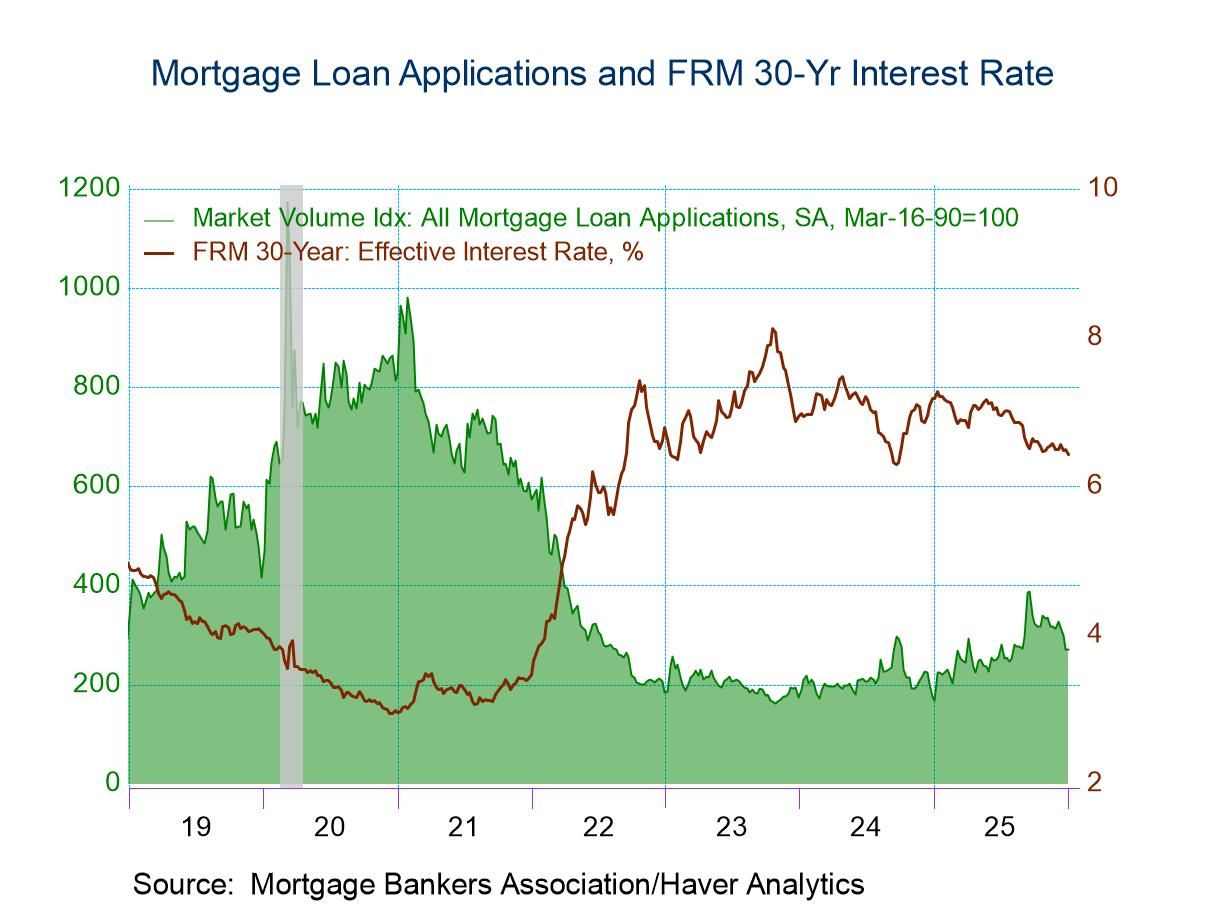
U.S. Mortgage Applications Edged Up in the Week of January 2
- Purchase applications dropped while refinancing loan applications rose in the latest week.
- Effective interest rate on 30-year fixed loans fell to 6.42%.
- Average loan size declined.
 Global| Jan 07 2026
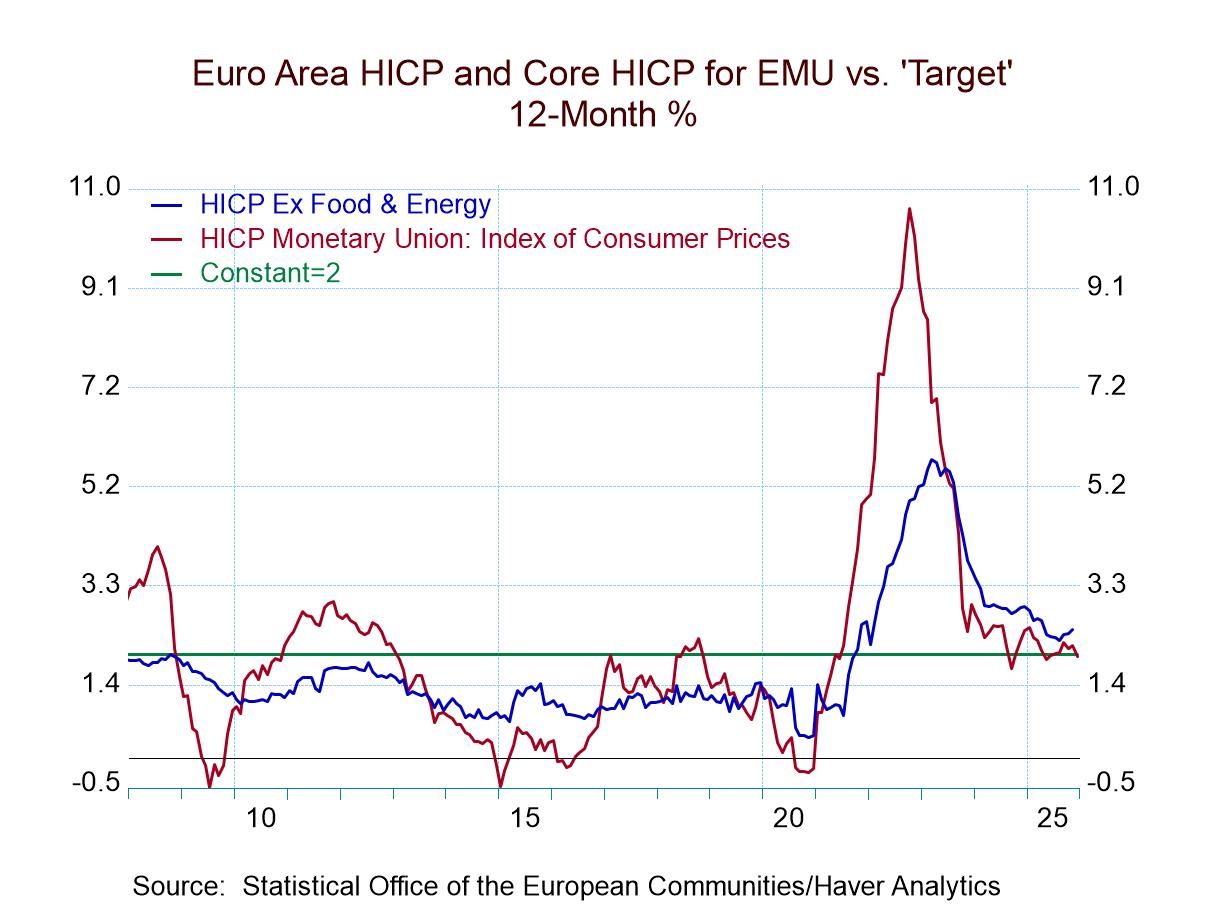
Inflation in the Euro Area Is Warm but Well-Behaved at Year-End
Inflation in the euro area as 2025 draws to a close has pretty much behaved. The HICP gauge for the European Monetary Union, that's targeted at a pace of 2% is closing the year with a 12-month pace of 2% which is exactly what the ECB is looking for. Success is at hand! Congrats to the ECB!
It’s like the super bowl playoffs: a victory, but more games lie ahead However…oh yes there is almost over an ‘however’ or ‘none-the-less’ or some other insidious phrase inevitably is inserted to introduce a caveat… and that is this: over six months the headline pace is at 2.4% at an annual rate, and over three months the pace is at 2.2% at an annual rate. Still, the year-over-year inflation rate is how central banks normally are judged and it has come in right on target, and the ECB can claim a large measure of victory for that even as it faces the challenge for 2026.
Visiting 2% or setting down roots? At the same time, inflation is only closing in on the 2% target over other horizons. It has not generally proven itself to be stable at 2%, having spent most of its time at a pace above 2% for the past year as the chart shows.
So far so good... The monthly numbers have been encouraging with the December gain in the HICP at 0.2%. Germany logged a gain of 0.1%, month-to-month, France and Italy had gains of 0.2%, while Spain is at 0.4%. Spain, where inflation had been pretty-well contained, has now moved over to the rogue side of the ledger. Spain posted inflation at 3% year-over-year, at a 4.5% annual rate over six months, and at a 5.7% annual rate over three months. Other monetary union countries showed more disciplined patterns. For example, France has a 0.7% gain year-over-year with a 1.2% annual rate gain over six months, and a 1.1% annual rate gain over three months. All of them, of course, are gains well within the ECB's desired result for the union as a whole. Italy shows a tendency toward deflation at a 1.3% HICP gain over 12 months that shifts to a decline of 0.3% at an annual rate over six months, and to a decline of 1.9% at an annual rate over three months. The other troublesome country among the Big-Four economies in EMU is Germany where the 2% headline achievement over 12 months is right on top of the target the ECB seeks; however, it gets there with a 3.1% annual rate increase over six months and a 4% annual rate of increase over three months. Both of those gains, of course, are over the line and indicate accelerating inflation even as German inflation ends the year at 2% and is ‘seemingly’ compliant.
Core inflation is a slightly different animal Germany gives us an early look at inflation excluding energy. Italy and Spain give us core measures to look at early in the year. The December results show ex-energy inflation in Germany at 0.1% month-to-month, Italian core inflation at 0.3%, and Spanish core inflation at 0.2%. This followed a batch of similarly well-behaved numbers in November for these three countries (see Table). The core sequential inflation rates are generally better behaved for these three countries than for their headline rates. Germany's metric excluding energy comes in at 2.2% for the year but it accelerates at a 2.7% pace over six months and then it's back down to 2% over three months. Italy shows a compliant 2% pace over 12 months, then it slides to a 1.5% annualized over six months and slips further to a 0.7% pace over three months, echoing the deflation trend that we see in Italy's headline pace. For Spain, the core also exhibits accelerating inflation trends to join what it reports for the headline as the year-over-year core pace is at 2.6%, the six-month rate steps up to 3.1% annualized, and stays in that neighborhood at a 2.9% annualized rate over three months.
 Global| Jan 06 2026
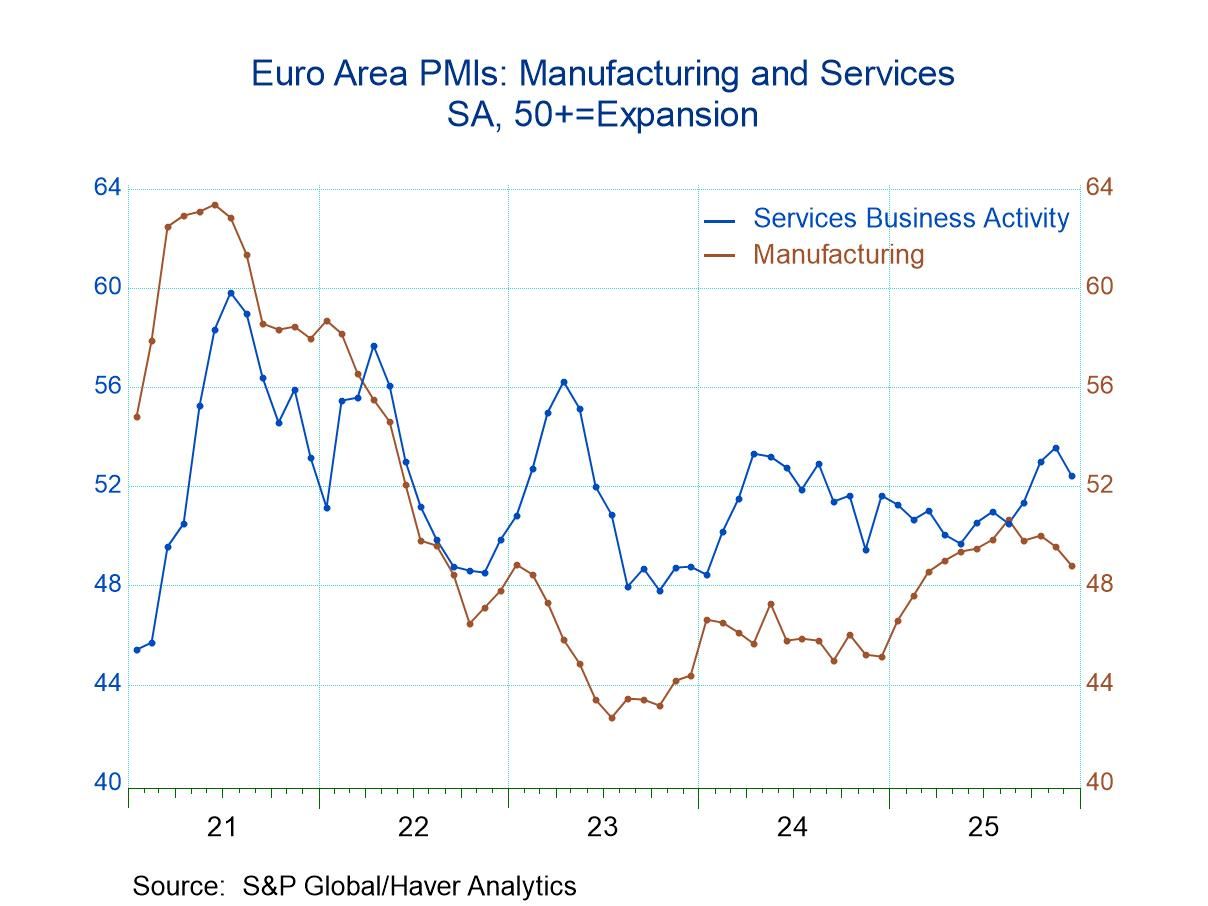
S&P Total PMIs A Mixed Bag As 2025 Ends
The S&P total or composite PMIs demonstrated a tendency to weakness in December as 64% of the 25 reporting countries reported weaker readings in December than in November. However, even with that bit of bad news on the table, the number of jurisdictions that reported PMI readings below 50 indicating economic contraction had gone to zero, indicating that there were no contracting jurisdictions in December. That's an improvement from two contracting in November and three in October. In those previous months, for example, in October, only 36% of the reporting entities were weaker month-to-month; in November, only 40% were weaker month-to-month so the step up to 64% weaker month-to-month in December was a big step-up in weakness; however, it comes after a period when conditions had generally been improving and now that has stopped.
Sequential trends: 12-months to 6-months to 3-months Sequential data that look at performance over three months, six months and 12 months compared to earlier periods show that, over three months only 34.8% of the jurisdictions were weaker compared to six-months. Over six months only 26.1% were weaker compared to 12-months. However, 12-months was a period of treading water because over 12 months compared to 12-months ago, about 48% of the reporters were weaker indicating that conditions over the past year had been largely unchanged. But over shorter periods of time conditions had been improving.
Contraction is less common At the same time, sequential data showed that there has been an improvement in terms of the number of jurisdictions that are showing contraction because there were five of them over 12 months, four of them over six months and only two of them over here months.
Standings/rankings The queue percentile standings show eight jurisdictions below 50% which means that on data from January 2021, only eight of the twenty five reporters are below their median result for that period. Egypt, Kenya, Sweden, and the United States have percentile standings in their 90th percentile marking them as very strong composite standings compared to where they have been over the last five years. There were also strong rankings in a relative sense in Western Europe with the European Monetary Union in its 81st percentile, Germany in its 81st percentile, France in its 81st percentile, and Hong Kong in its 83rd percentile, indicating strength spread across various areas but concentrated in Europe. On the weak side, there are extremely weak readings that are offered by Qatar that has an 11.9 percentile standing, in India that has a 19-percentile standing, the UAE with a 31-percentile standing, and China with the 38th percentile standing. These are relative standings that is they are not a ranking of the PMI values compared to other countries, but rather comparing to each individual country over the whole time series of values since January 2021 with its own performance. China, for example, has a 51.3 composite reading for December 2025, and while that's roughly a lower 1/3 reading compared to where it's been historically, it isn't a particularly weak reading compared to what other countries are reporting in December 2025. China, for example, ranks 17th out of 25 countries (approx. bottom one-third position) reporting data in December 2025. In the case of China, its timeseries and cross-section standing are very similar in ranking terms.
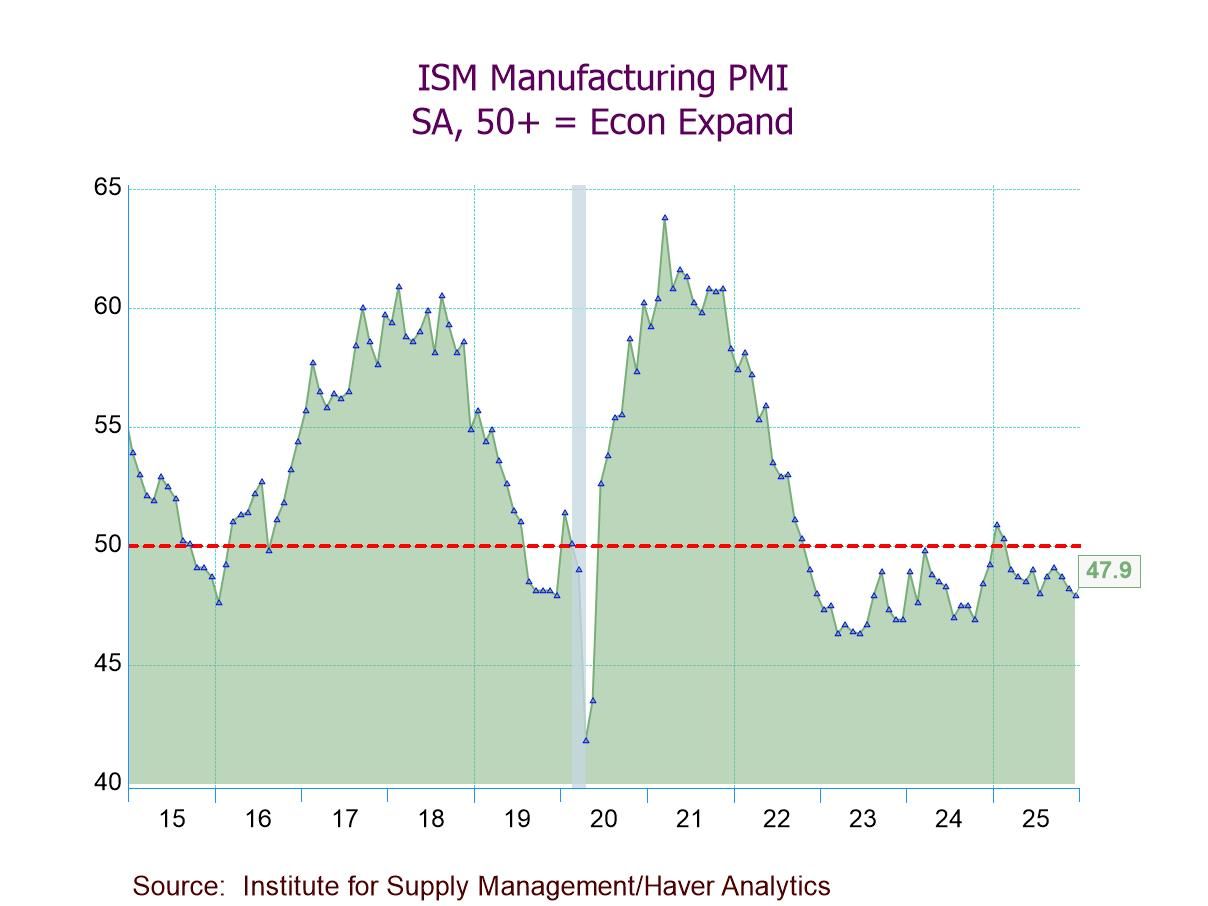
- ISM Mfg. PMI down to 47.9 in Dec., below forecasts; 10th straight month of contraction.
- Production (51.0) expands for the third time in four months.
- New orders (47.7) contract for the fourth successive month.
- Employment (44.9) contracts for the 11th consecutive month.
- Prices Index (unchanged at 58.5) indicates prices rise for the 15th straight month; exports & imports continue to contract.
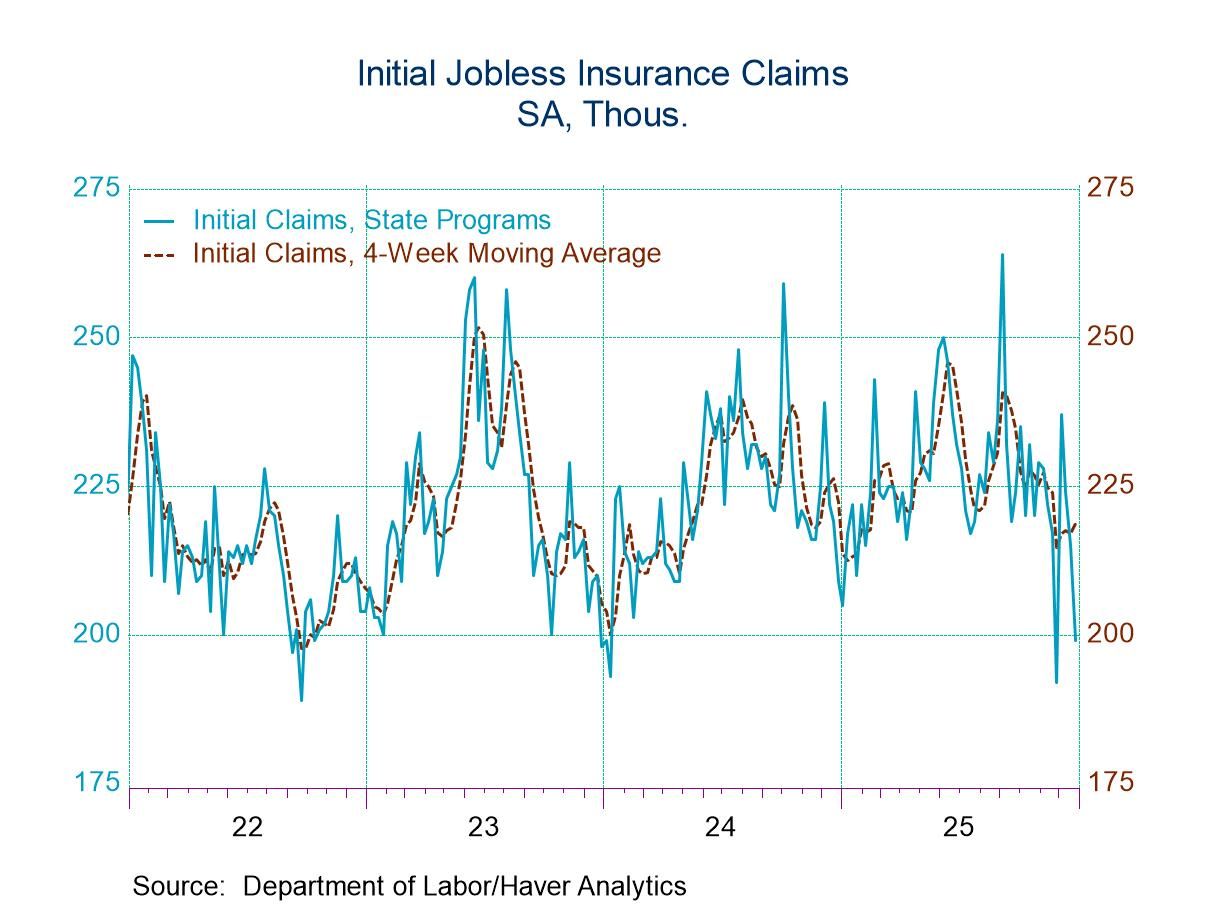
- Initial claims declined from the prior week.
- Continuing claims declined from the prior week.
- The insured unemployment rate was unchanged.
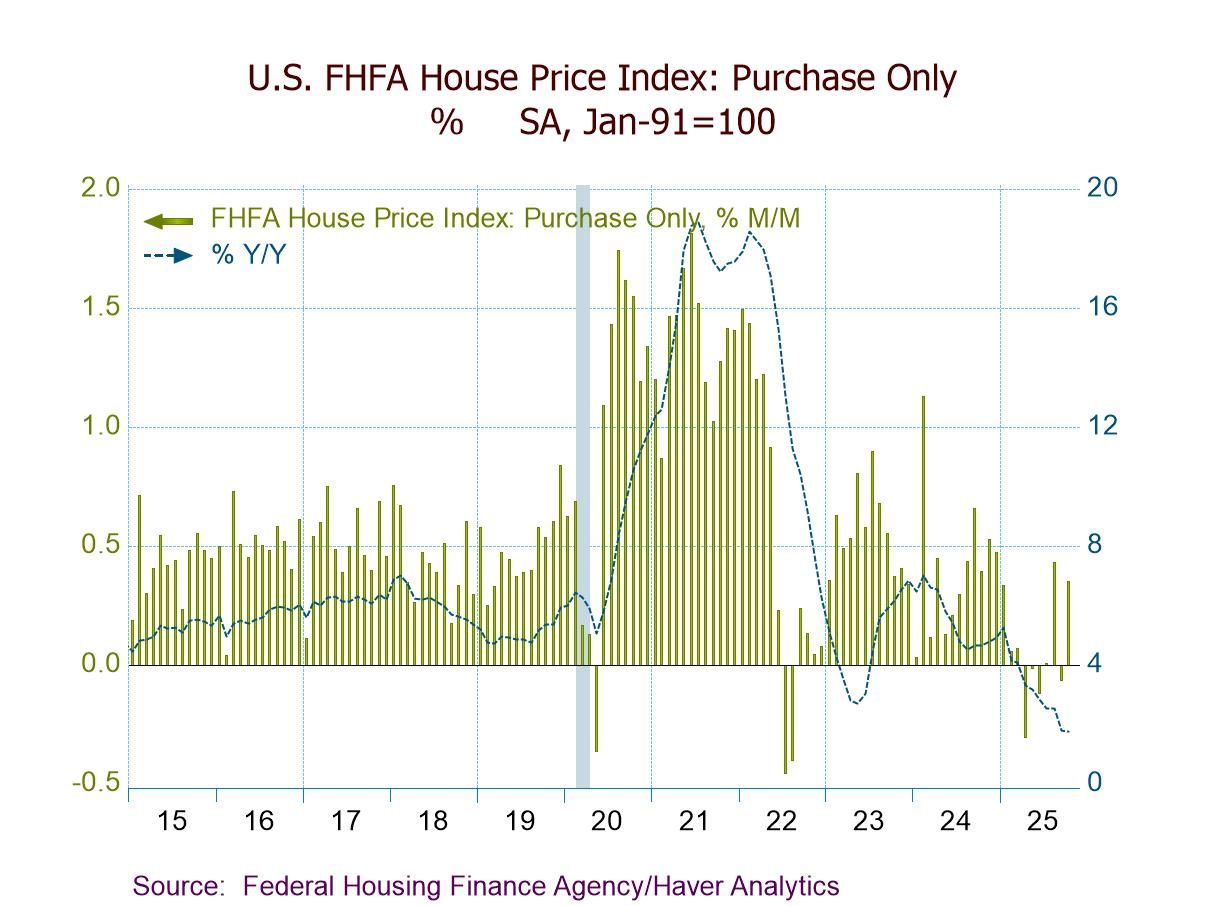
- FHFA HPI +0.4% m/m (+1.7% y/y) in Oct.; second m/m gain in three months.
- House prices up m/m in seven of nine census divisions but down in East South Central (-0.4%) and South Atlantic (-0.2%).
- House prices up y/y in seven of nine regions, led by Middle Atlantic (+5.3%), but down in West South Central (-0.7%) and South Atlantic (-0.5%).
 Spain| Dec 30 2025
Spanish Inflation Flares at Year-End
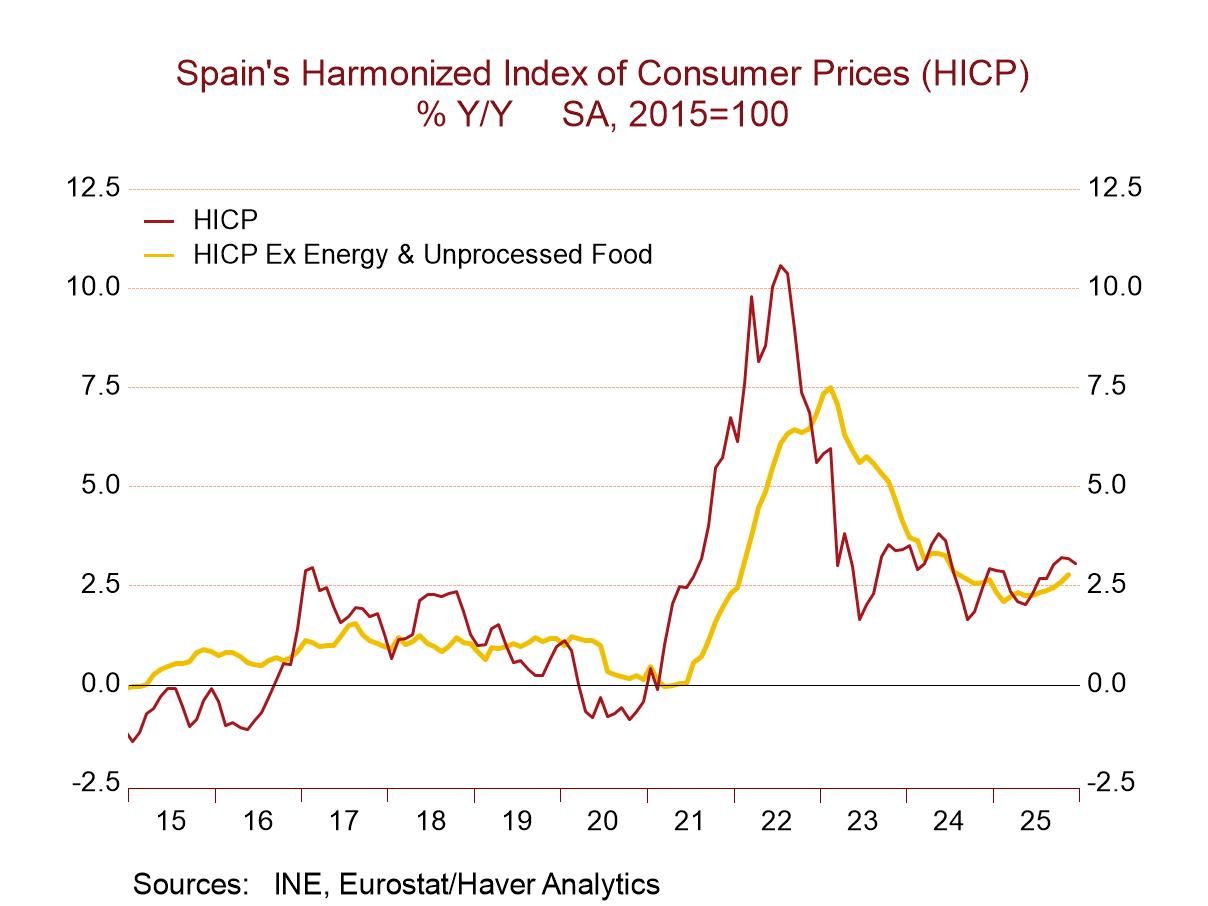
When inflation numbers come hot off the griddle, some part of them might stick to the pan. That's the case this month with Spain’s release of inflation in December. It provides us with the headline for the HICP measure, a headline to the domestic measure, and the domestic measure excluding energy. But it does not release the sector detail for the rest of the report.
However, based upon what's been released, it’s clear that inflation in Spain has picked up. The part of the core that we have in-hand, which is just the portion excluding energy, still appears to be fairly well behaved; however, its gain is still slightly excessive.
HICP trend Spain’s HICP measure in December rose 0.4% after rising by 0.5% in both October and November; those are hot numbers. That translates into a 5.7% annual rate over three months which is hotter than its pace of 4.5% over six months which in turn is hotter than the 12-month increase of 3%. The HCP headline for Spain has clearly been accelerating, the year-over-year rise is too-hot, and the shorter-term metrics are hotter still. This is not good news, and this is not a welcome progression.
Domestic inflation Looking at Spain’s domestic CPI conditions, we find that they are still on the hot side with December showing a headline gain of 0.3% but gains in October and November of 0.5% each, producing a three-month annual rate of 5.4%, which is hotter than its 4.2% over six months, which, in turn, is hotter than the year-over-year gain at 2.9%. And these patterns/results are very similar to the pattern and the readings for the HICP. The domestic inflation picture is too hot over 12 months and accelerating over the shorter periods.
Domestic inflation ex-energy: The CPI excluding energy is not as bloated as the HICP or the domestic headline, but it is still a reading on rough terrain. Over 12 months, inflation excluding energy rises at a 2.6% annual rate; that's above the 2% pace sought by the ECB for the community as a whole. Over six months, the reading ramps up to a 3.1% annual rate, again moving the wrong direction and a reading at 3.1% is simply too hot. Over three months, there's a slight deceleration compared to six months but still a rate that is too hot, at 2.9%, and stronger than the 12-month pace. Core inflation is better behaved than headline inflation and both the domestic and the HICP frameworks, but inflation is unruly overall and, for the most part, showing either acceleration or at least a 3-month pace stronger than its 12-month pace. None of this is what the ECB is looking for or trying to achieve.
Beyond the missing details The details of the Spanish report are missing for December because the data are too preliminary for the authorities to post. However, if we look at the sequential pace of inflation over 12 months, six months, and three months on a lagged basis, it is looking at data that are up-to-date through November rather than through December what's the numbers that are generally excessive and they show too much acceleration moving from 12-months to 6-months to 3-months. Over 12 months compared to a year ago, five of nine categories show inflation accelerating. Over 6 months compared to 12 months, four categories are accelerating. Over 3 months compared to 6 months, six of the nine categories are accelerating. These acceleration tendencies are worrisome.
In addition, over 12 months, six of nine categories have a pace above 2%. Over 6 months, six of nine categories have annualized gains above 2%, and over 3 months, the lagged data show six of nine categories with gains above 2%. Only apparel shows inflation tempered on all horizons (at or below 2%). Food, housing, transport, education and other all show above 2% inflation on all horizons.
- of2725Go to 41 page