U.S. Core PCE Price Inflation Moves Up in June; Real Spending Improves
by:Tom Moeller
|in:Economy in Brief
Summary
- Core price increase is strongest in four months.
- Real spending moves slightly higher.
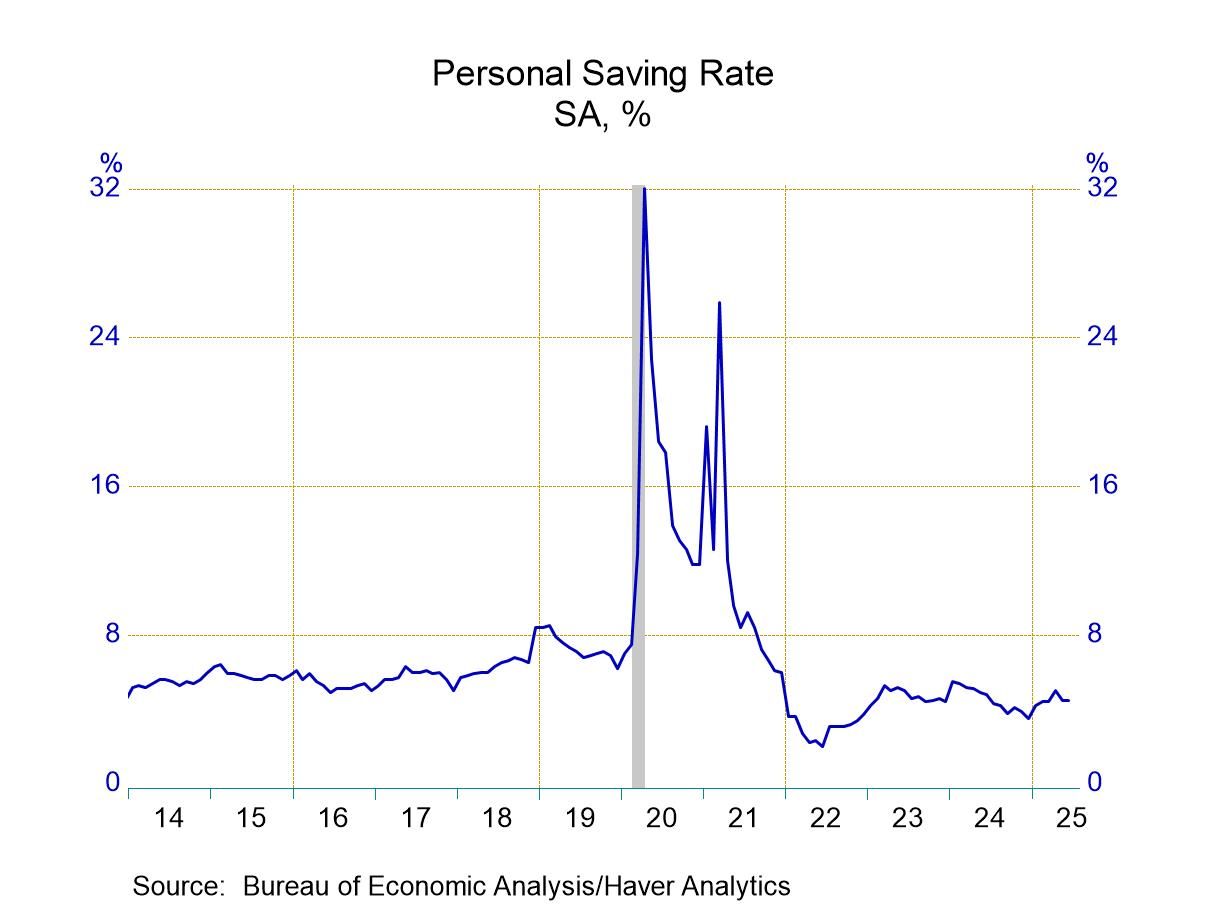
- Real disposable income holds steady along with personal savings rate.

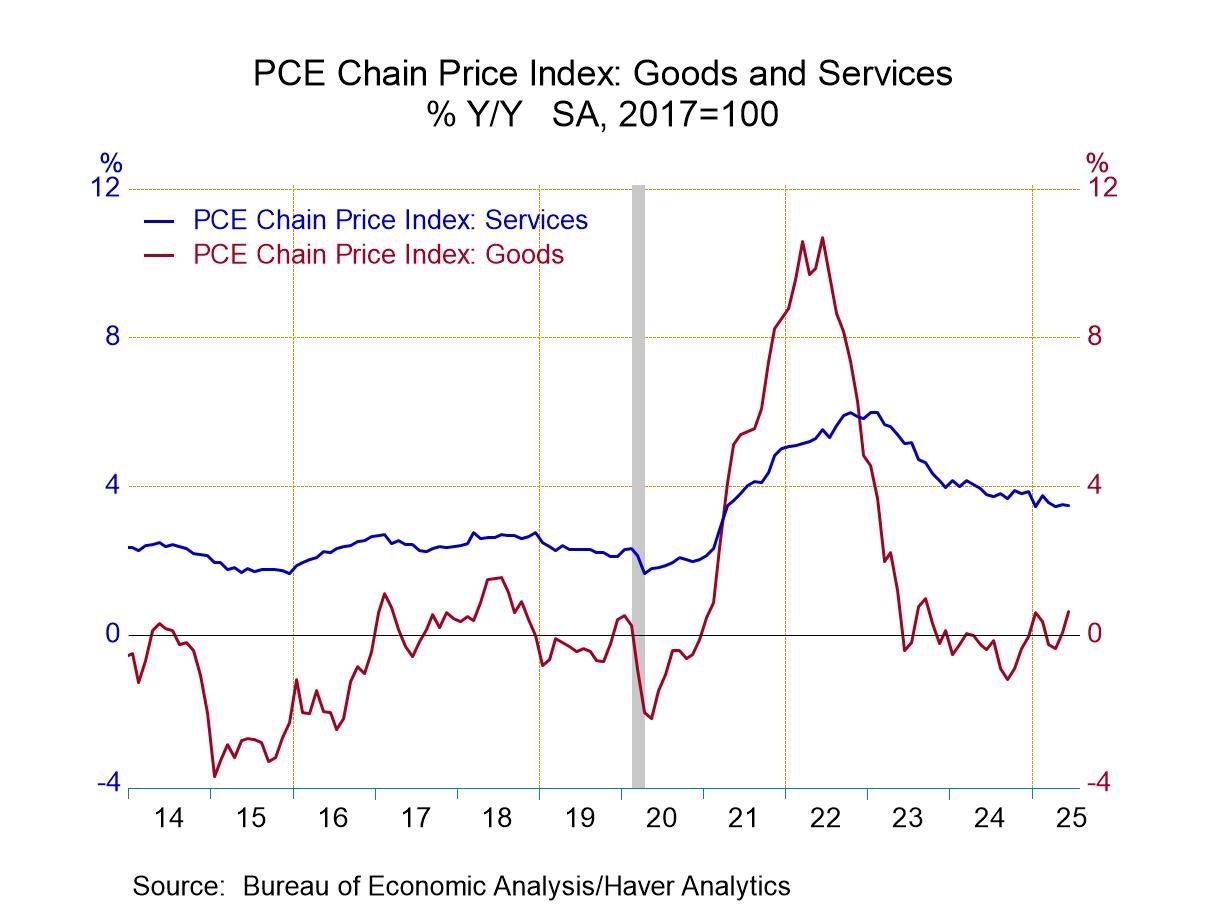
Price Index Strengthens The PCE chain price index increased 0.3% (2.6% y/y) during June after rising 0.2% in May and 0.2% in April, both revised up from 0.1%. The y/y gain rose to 2.6% after a 2.4% increase in May. It was the strongest rise in four months, up from 2.2% in April. Energy prices rose 0.9% (-1.6% y/y) after falling 1.0% in May, while food prices rose 0.3% (2.2% y/y) following a 0.2% rise. The price index excluding food & energy rose 0.3%, after two straight 0.2% increases. The y/y increase held steady at 2.8% last month, and remained near the slowest since March 2021.
Durable goods prices rose 0.5% (0.9% y/y) in June, after holding steady in May. Home furnishings & appliance prices jumped 1.3% (2.1% y/y), after increasing 0.6%. Recreational goods & vehicle costs strengthened 0.9% (0.8% y/y) following a slight easing in May. Motor vehicle & parts prices slipped 0.4% (+0.7% y/y), after a 0.1% May decline.
Prices of nondurable goods rose 0.4% (0.5% y/y) last month after a 0.1% May improvement. Gasoline & other energy prices increased 0.9% (-8.0% y/y), after falling 2.2% in May. Clothing prices rose 0.4% (-0.3% y/y) after falling 0.4% in May. Food & beverage prices rose 0.3% (2.2% y/y) following a 0.2% May increase.
Services prices in June rose 0.2% (3.5% y/y) in June for the fourth straight month. Housing & utility prices rose 0.3% (4.4% y/y), the same as in May, and services prices excluding energy & healthcare gained 0.2% (3.7% y/y) for the second straight month. Healthcare prices strengthened 0.4% (2.4% y/y), after a 0.1% uptick. The cost of financial services & insurance rose 0.4% (5.1% y/y) after falling 0.2% in May. Recreation services costs edged 0.1% higher (3.7% y/y) after falling 0.3%. Transportation prices eased 0.1% (+4.3% y/y), after holding steady In May, while hotel & restaurant prices eased slightly (+2.9% y/y) after rising 0.3% in May.
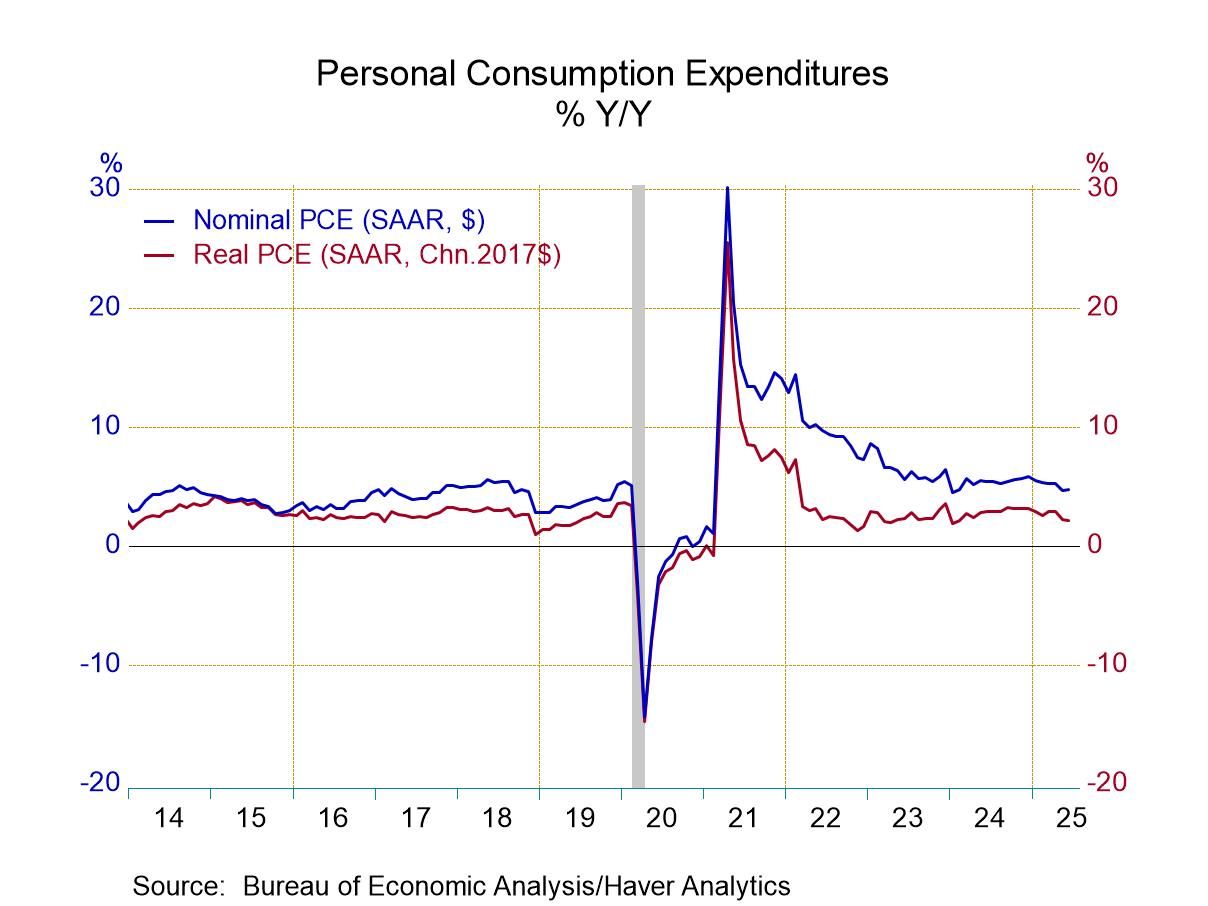
Personal Spending Firms Personal consumption expenditures (PCE) rose 0.3% (+4.7% y/y) in June after holding steady in May, revised from -0.1%. The rise compared to expectations for a 0.4% increase in the Action Economics Forecast Survey. When adjusted for price changes, PCE improved 0.1% in June (2.1% y/y) after falling 0.2% in May.
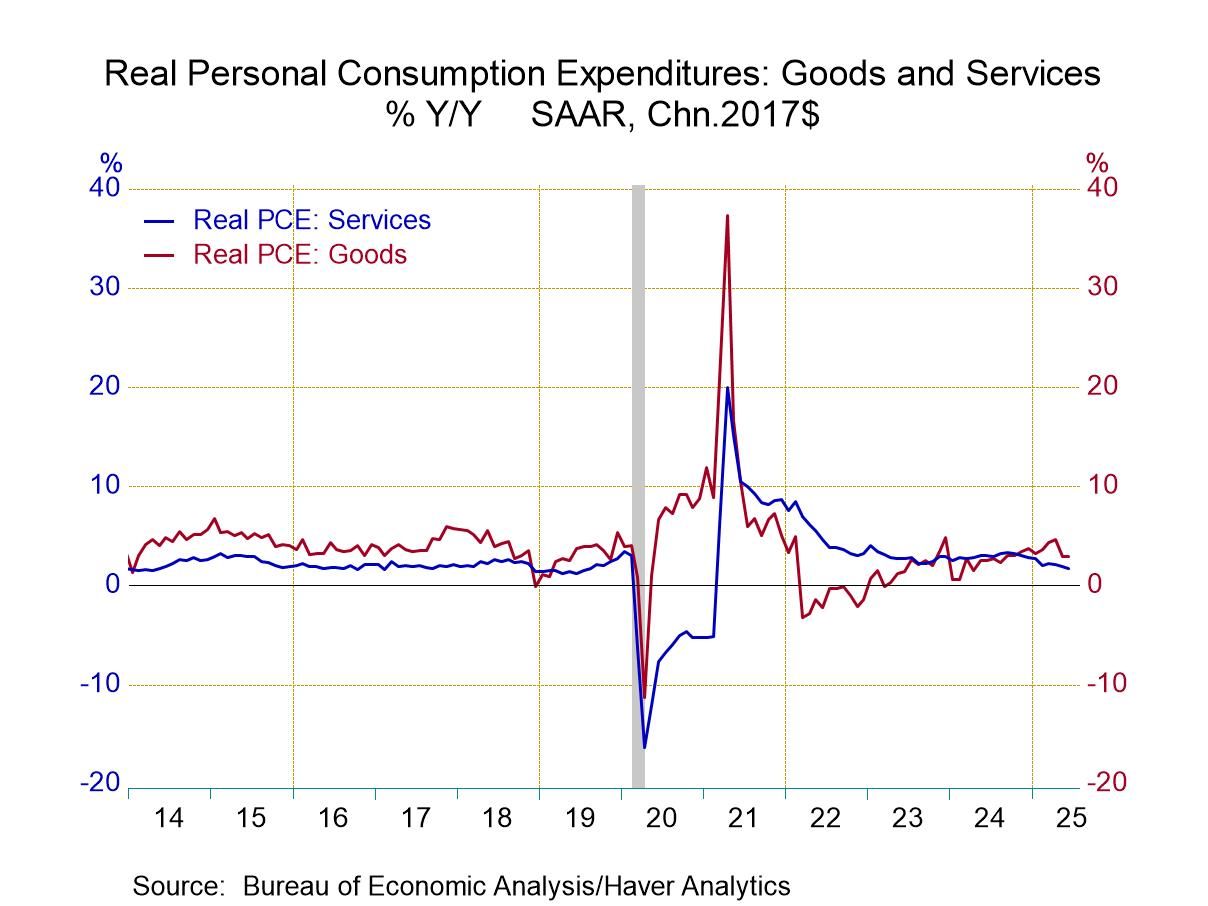
Real spending on durable goods declined 0.5% (+3.5% y/y) in June, after dropping 1.8% in May. Real spending on motor vehicles eased 0.4% (+7.1% y/y), after falling 5.5% in May. Real outlays on furnishings & appliances eased 0.7% (+1.1% y/y), off for the third straight month. Real spending on recreational goods & vehicles fell 0.6% (+2.2% y/y) last month, after rising 1.1% in May. Spending on “other” durable goods eased 0.1% (+1.8% y/y) after rising 0.7% in May.
Nondurable goods spending in real terms rose 0.4% (2.7% y/y) in June after falling 0.3% in May. Real clothing & footwear purchases rose 0.3% (4.2 y/y) last month, following a 1.2% jump during May. Real food & beverage purchases rose 0.2% (1.3% y/y) and reversed the 0.2% decline in the prior month. Real outlays on gasoline & other energy products rose 1.9% (1.7% y/y), after falling 2.6%. Real spending on “other” nondurable goods improved 0.2% (3.7% y/y) last month, following two straight months of 0.3% decline.
Real spending on services roughly improved 0.1% (1.7% y/y) in June for the third straight month. Real spending on housing & utilities rose 0.1% (1.0% y/y) in June, for a second consecutive month, while real health care spending also rose 0.1% (4.7% y/y) after rising 0.2%. Real spending on food services & accommodations increased 0.2% (1.5% y/y), after falling 0.2% in May. Real spending on financial services & insurance rose 0.2% (2.5% y/y) after falling 0.3%. Real spending on transportation services weakened 0.3% (-2.3% y/y) in June, after edging 0.1% higher in May. Recreation spending fell 0.7% (-0.3% y/y), after rising 0.9% in May. Spending on “other” services held steady (+2.3% y/y) for the second straight month.
Income Growth Improves Personal income rose 0.3% last month (4.7% y/y) after falling 0.4% in May. A 0.2% gain was expected. Wages & salaries edged 0.1% higher (4.8% y/y), following a 0.3% increase during May. Rental income declined 0.4% (+3.8 y/y) in June, after falling 0.5% in May. Proprietors’ income improved 0.2% (2.3% y/y), after tumbling 2.6%. Income from assets held steady (+1.0% y/y), after rising 0.2% during May, and current transfer receipts rose 1.0% (8.6% y/y) following a 2.0% May decline.
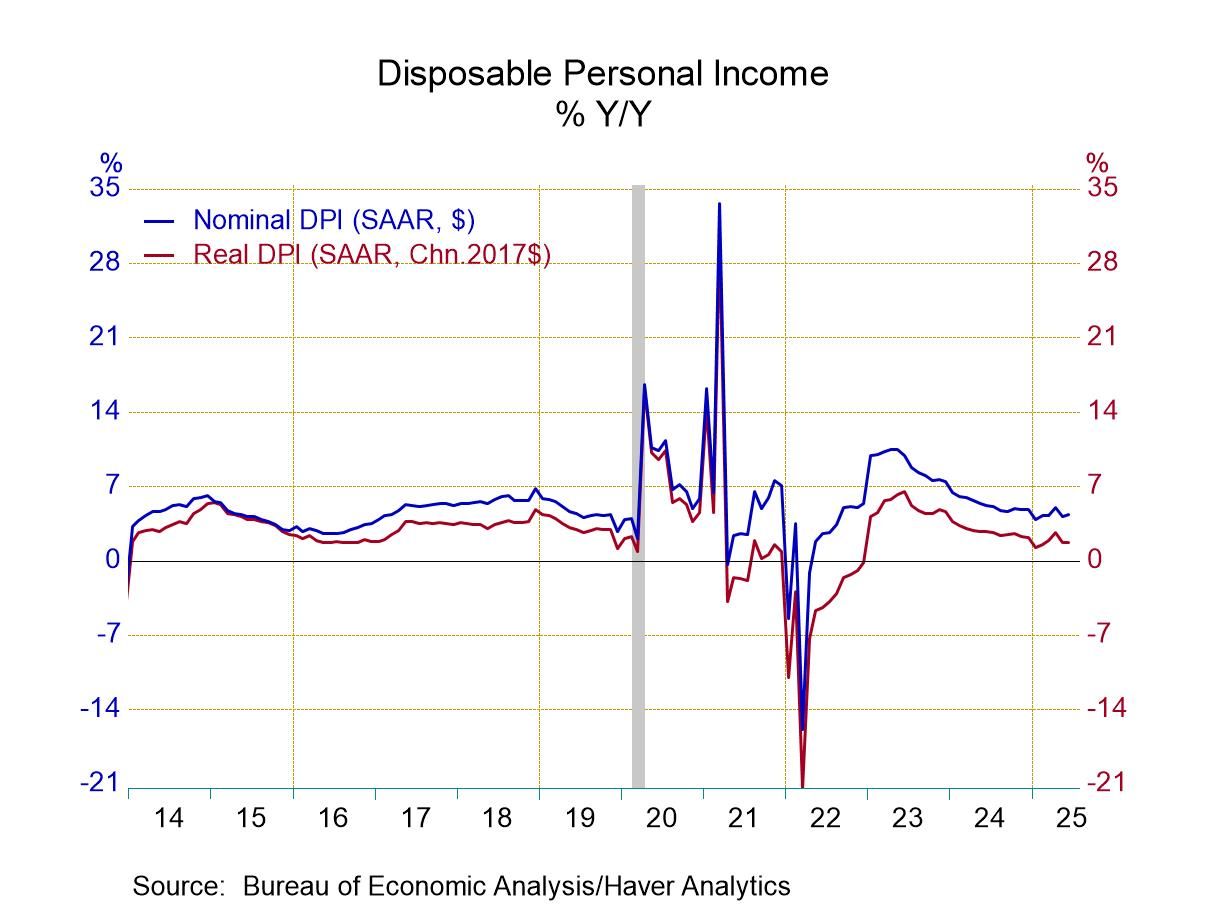
Disposable personal income increased 0.3% (4.3% y/y) during June following a 0.5% May decline. After adjusting for price changes, disposable income eased slightly (+1.7% y/y) after falling 0.7% in May.
The personal saving rate held steady in June at 4.5%, after falling from 5.0% in April. It still stands well above low of 3.5% in December of last year. Personal saving fell 0.8% (-2.2% y/y) in June, after declining 9.8% in May.
The personal income and consumption figures are available in Haver’s USECON database with detail in the USNA database. The Action Economics forecasts are in AS1REPNA.

Tom Moeller
AuthorMore in Author Profile »Prior to joining Haver Analytics in 2000, Mr. Moeller worked as the Economist at Chancellor Capital Management from 1985 to 1999. There, he developed comprehensive economic forecasts and interpreted economic data for equity and fixed income portfolio managers. Also at Chancellor, Mr. Moeller worked as an equity analyst and was responsible for researching and rating companies in the economically sensitive automobile and housing industries for investment in Chancellor’s equity portfolio. Prior to joining Chancellor, Mr. Moeller was an Economist at Citibank from 1979 to 1984. He also analyzed pricing behavior in the metals industry for the Council on Wage and Price Stability in Washington, D.C. In 1999, Mr. Moeller received the award for most accurate forecast from the Forecasters' Club of New York. From 1990 to 1992 he was President of the New York Association for Business Economists. Mr. Moeller earned an M.B.A. in Finance from Fordham University, where he graduated in 1987. He holds a Bachelor of Arts in Economics from George Washington University.
More Economy in Brief


 Global
